
JOURNAL OF NATURAL RESOURCES >
Spatial pattern and water environmental impact of nitrogen and phosphorus emissions from agricultural sources in China in recent 30 years
Received date: 2019-11-01
Request revised date: 2020-04-07
Online published: 2021-05-28
Copyright
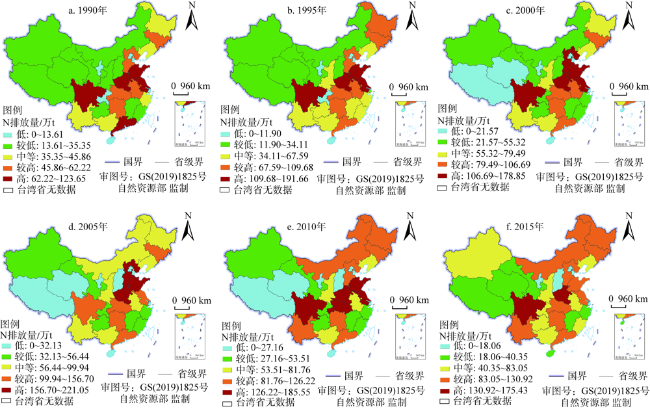
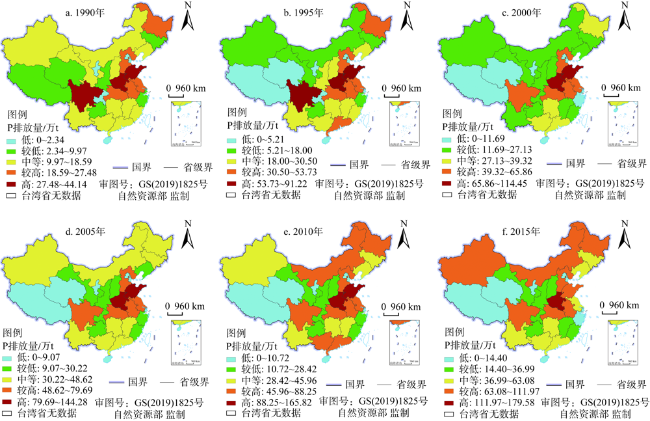
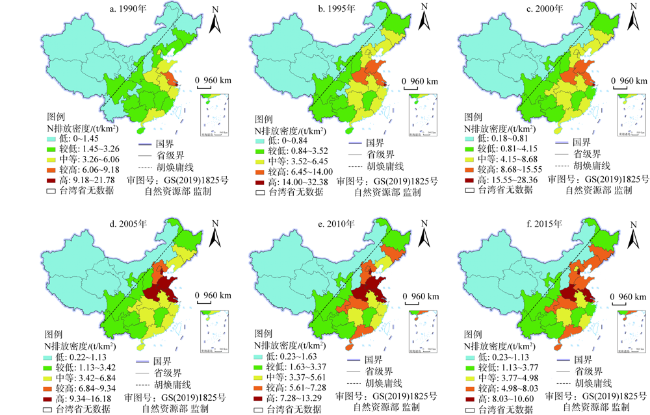
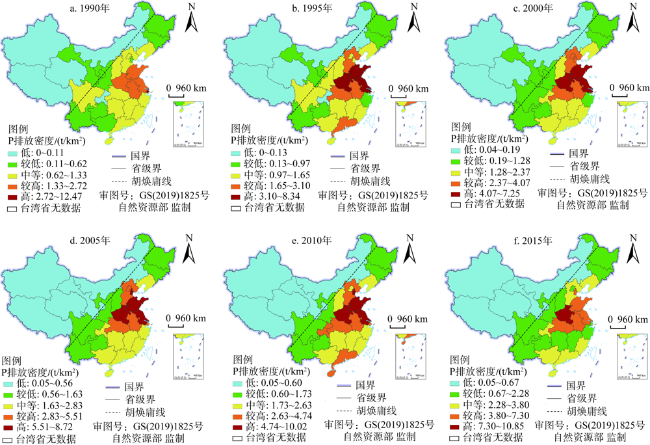
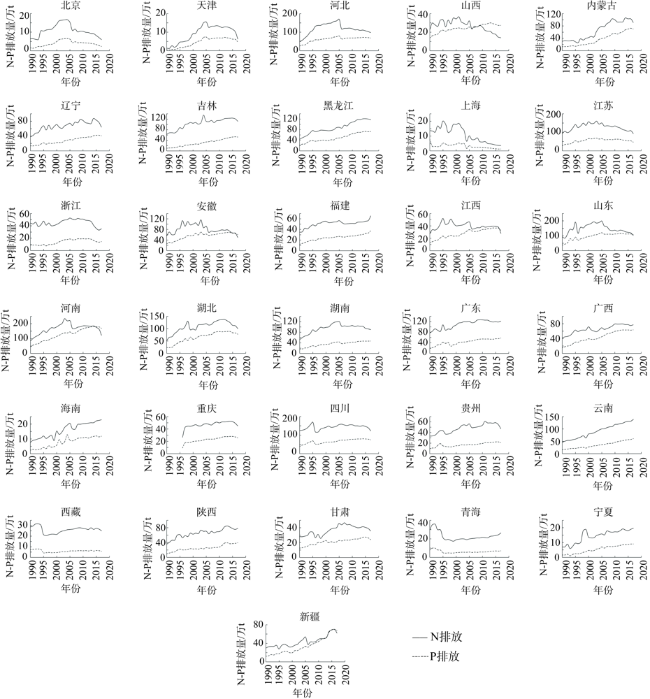
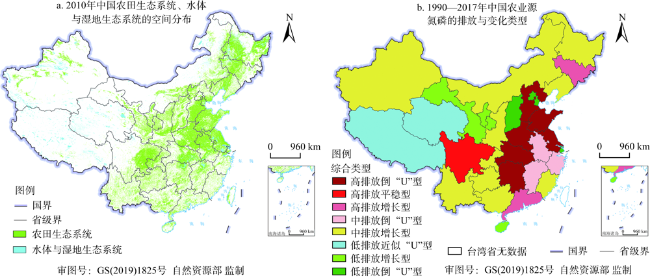
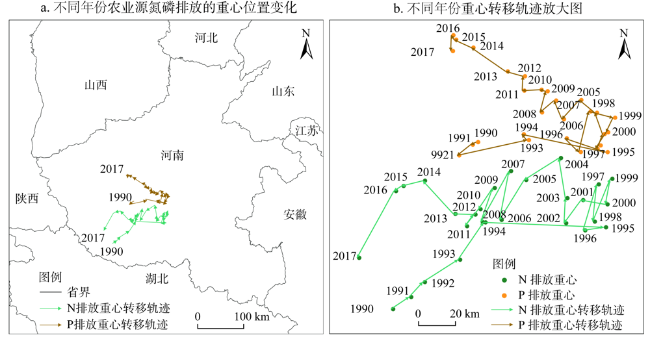
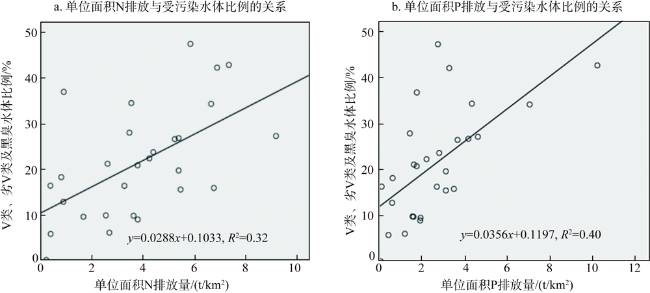
It is important and valuable to reveal the spatial pattern, changing characteristics of nitrogen and phosphorus emissions from agricultural sources and the relationship between them and water environment for rational allocation of investment in agricultural non-point source pollution control and optimization of regional agricultural structure. Based on this understanding, a series of parametric models were established to estimate the agricultural source nitrogen and phosphorus emissions in China from 1990 to 2017. Then, the changing characteristics of nitrogen and phosphorus emissions from agricultural sources were studied from three aspects including total emissions, nitrogen and phosphorus emissions per unit area and migration of emission center, and the relationship between nitrogen and phosphorus emissions from agricultural sources and water environment was revealed through correlation and regression analysis. The study found that the nitrogen and phosphorus emissions from agricultural sources in China were distributed randomly between provinces, indicating that there was no significant interprovincial dependence of nitrogen and phosphorus emissions, which were mainly influenced by internal factors of each province. Throughout the study period, the provinces with the highest annual total nitrogen and phosphorus emissions were Henan, Shandong, Sichuan, Hubei, Hebei, Anhui and Jiangsu provinces. The pattern was relatively stable, but the emission center experienced a reciprocating transfer from east to west and had an overall transfer trend in the northwest direction. Among them, the center of gravity of nitrogen and phosphorus emissions shifted 33.94 km and 52.31 km respectively in the direction of north by west 33.52° and 15.45°. Based on the pattern research and combined with pattern characteristics of spatial dimension and changing characteristics of time dimension, nitrogen and phosphorus emissions of 31 provincial-level regions were divided into 8 categories, namely, high emission growth type, high emission stable type, high emission inverted "U" shape type, medium emission growth type, medium emission inverted "U" shape type, low emission growth type, low emission inverted "U" shape type, and low emission approximate "U" shape type. Furthermore, the water quality data from automatic monitoring stations in 2017 were used to verify the relationship between nitrogen and phosphorus emissions and water environment. The results can be used as the basis for identifying key regions in agricultural non-point source pollution control.
MA En-pu , CAI Jian-ming , LIN Jing , LIAO Liu-wen , GUO Hua , HAN Yan . Spatial pattern and water environmental impact of nitrogen and phosphorus emissions from agricultural sources in China in recent 30 years[J]. JOURNAL OF NATURAL RESOURCES, 2021 , 36(3) : 752 -770 . DOI: 10.31497/zrzyxb.20210316
表1 一单位畜禽一年粪便的总氮和总磷产生量Table 1 Total nitrogen and phosphorus production per unit of livestock and poultry per year (kg) |
| 畜禽种类 | 总氮 | 总磷 |
|---|---|---|
| 猪 | 8.27 | 3.12 |
| 牛 | 61.10 | 10.07 |
| 羊 | 7.12 | 2.47 |
| 禽类 | 0.27 | 0.15 |
表2 农作物每形成100 kg产量需要吸收的氮磷量Table 2 The amount of nitrogen and phosphorus that crops need to absorb for every 100 kg of yield (kg/100 kg) |
| 作物 | 大田作物 | 蔬菜 | 园林水果 | 经济作物 | |||||||||
|---|---|---|---|---|---|---|---|---|---|---|---|---|---|
| 种类 | 水稻 | 小麦 | 玉米 | 谷子 | 大豆 | 棉花 | 薯类(马铃薯) | 油料 | 糖料 | 烟叶 | 茶叶 | ||
| 氮 | 2.20 | 3.00 | 2.30 | 3.80 | 7.20 | 11.70 | 0.50 | 0.36 | 0.51 | 7.19 | 0.33 | 3.85 | 6.40 |
| 磷 | 0.80 | 1.00 | 0.30 | 0.44 | 0.75 | 3.04 | 0.09 | 0.09 | 0.20 | 0.89 | 0.04 | 0.53 | 0.88 |
图5 1990—2017年各省级行政区的农业源氮磷排放Fig. 5 Nitrogen and phosphorus emissions from agricultural sources in provincial-level regions from 1990 to 2017 |
表3 回归方程的模型摘要及F检验Table 3 Model summary and F test of regression equations |
| R2 | 调整R2 | 估计的标准误差 | F | Sig. | |
|---|---|---|---|---|---|
| N组 | 0.32 | 0.29 | 0.10 | 12.25 | 0.002 |
| P组 | 0.40 | 0.37 | 0.10 | 17.03 | 0.000 |
表4 回归系数及t检验Table 4 Regression coefficients and t test |
| N组 | 回归系数 | 标准误差 | t | Sig. | P组 | 回归系数 | 标准误差 | t | Sig. |
|---|---|---|---|---|---|---|---|---|---|
| 单位面积 氮排放量 | 0.0288 | 0.0082 | 3.50 | 0.00 | 单位面积 磷排放量 | 0.0356 | 0.0086 | 4.13 | 0.00 |
| 常数项 | 0.1033 | 0.0369 | 2.80 | 0.01 | 常数项 | 0.1197 | 0.0291 | 4.11 | 0.00 |
| [1] |
陈勇. 陕西省农业非点源污染评价与控制研究. 杨凌: 西北农林科技大学, 2010.
[
|
| [2] |
王琼. 基于SWAT模型的小清河流域氮磷污染负荷核算及总量控制. 北京: 中国科学院大学, 2012.
[
|
| [3] |
曹宁, 曲东, 陈新平, 等. 东北地区农田土壤氮、磷平衡及其对面源污染的贡献分析. 西北农林科技大学学报: 自然科学版, 2006,34(7):127-133.
[
|
| [4] |
李恒鹏, 刘晓玫, 黄文钰. 太湖流域浙西区不同土地类型的面源污染产出. 地理学报, 2004,59(3):401-408.
[
|
| [5] |
黄秋婵, 韦友欢, 韦方立, 等. 农业面源污染对生态环境的影响及其防治措施. 广西民族师范学院学报, 2011,28(3):17-19.
[
|
| [6] |
沈晔娜. 流域非点源污染过程动态模拟及其定量控制. 杭州: 浙江大学, 2010.
[
|
| [7] |
陈同斌, 陈世庆, 徐鸿涛, 等. 中国农用化肥氮磷钾需求比例的研究. 地理学报, 1998,53(1):32-41.
[
|
| [8] |
陈同斌, 曾希柏, 胡清秀. 中国化肥利用率的区域分异. 地理学报, 2002,57(5):531-538.
[
|
| [9] |
张福锁, 王激清, 张卫峰, 等. 中国主要粮食作物肥料利用率现状与提高途径. 土壤学报, 2008,45(5):915-924.
[
|
| [10] |
徐亚新, 何萍, 仇少君, 等. 我国马铃薯产量和化肥利用率区域特征研究. 植物营养与肥料学报, 2019,25(1):22-35.
[
|
| [11] |
马林, 卢洁, 赵浩, 等. 中国硝酸盐脆弱区划分与面源污染阻控. 农业环境科学学报, 2018,37(11):2387-2391.
[
|
| [12] |
路路, 戴尔阜, 程千钉, 等. 基于水环境化学及稳定同位素联合示踪的土地利用类型对地下水体氮素归趋影响. 地理学报, 2019,74(9):1878-1889.
[
|
| [13] |
卫凯平, 武慧君, 黄莉, 等. 农业生产系统氮磷环境影响分析: 以安徽省为例. 农业环境科学学报, 2018,37(8):1802-1810.
[
|
| [14] |
魏静, 马林, 路光, 等. 城镇化对我国食物消费系统氮素流动及循环利用的影响. 生态学报, 2008,28(3):1016-1025.
[
|
| [15] |
|
| [16] |
辛良杰, 李鹏辉. 基于CHNS的中国城乡居民的食品消费特征: 兼与国家统计局数据对比. 自然资源学报, 2018,33(1):75-84.
[
|
| [17] |
武淑霞, 刘宏斌, 黄宏坤, 等. 我国畜禽养殖粪污产生量及其资源化分析. 中国工程科学, 2018,20(5):103-111.
[
|
| [18] |
赵俊伟, 姜昊, 陈永福, 等. 生猪规模养殖粪污治理行为影响因素分析: 基于意愿转化行为视角. 自然资源学报, 2019,34(8):1708-1719.
[
|
| [19] |
何军, 崔远来, 王建鹏, 等. 不同尺度稻田氮磷排放规律试验. 农业工程学报, 2010,26(10):56-62.
[
|
| [20] |
孟岑, 李裕元, 许晓光, 等. 亚热带流域氮磷排放与养殖业环境承载力实例研究. 环境科学学报, 2013,33(2):635-643.
[
|
| [21] |
刘园园, 史书, 木志坚, 等. 三峡库区典型农业小流域水体氮磷浓度动态变化. 西南大学学报: 自然科学版, 2014,36(11):157-163.
[
|
| [22] |
崔超, 刘申, 翟丽梅, 等. 兴山县香溪河流域农业源氮磷排放估算及时空特征分析. 农业环境科学学报, 2015,34(5):937-946.
[
|
| [23] |
邱乐丰, 龙文莉, 方豪, 等. 基于种养平衡的杭州市畜禽养殖环境承载力研究. 自然资源学报, 2016,31(8):1410-1419.
[
|
| [24] |
巨晓棠. 氮肥有效率的概念及意义: 兼论对传统氮肥利用率的理解误区. 土壤学报, 2014,51(5):921-933.
[
|
| [25] |
朱兆良, 文启孝. 中国土壤氮素. 南京:江苏科学技术出版社, 1992: 213-249.
[
|
| [26] |
鲁如坤, 时正元, 顾益初. 土壤积累态磷研究II: 磷肥的表观积累利用率. 土壤, 1995,27(6):286-289.
[
|
| [27] |
茹德平, 赵彩霞, 李习军, 等. 用15N示踪技术研究高产小麦、玉米的施氮规律. 核农学通报, 2005,19(2):151-154.
[
|
| [28] |
黄绍敏, 宝德俊, 皇甫湘荣, 等. 长期定位施肥小麦的肥料利用率研究. 麦类作物学报, 2006,26(2):121-126.
[
|
| [29] |
侯彦林. 肥效评价的生态平衡施肥理论体系、指标体系及其实证. 农业环境科学学报, 2011,30(7):1257-1266.
[
|
| [30] |
王火焰, 周健民. 肥料养分真实利用率计算与施肥策略. 土壤学报, 2014,51(2):216-225.
[
|
| [31] |
|
| [32] |
韩秉进, 陈渊, 孟凯, 等. 黑土农田供肥能力及化肥利用率的试验研究. 土壤通报, 2004,35(3):264-266.
[
|
| [33] |
杨朝飞. 全国规模化畜禽养殖业污染情况调查及防治对策. 北京:中国环境科学出版社, 2002.
[
|
| [34] |
杨金升, 袁雪竹, 张宏伟, 等. 基于日平均养殖量的畜禽养殖排污系数法的改进. 城市环境与城市生态, 2012,25(2):27-30.
[
|
| [35] |
徐新良, 刘纪远, 张增祥, 等. 中国5年间隔陆地生态系统空间分布数据集(1990—2010). 全球变化科学研究数据出版系统, 2015, Doi: 10.3974/geodb.2015.01.01.V1.
[
|
| [36] |
徐新良, 刘纪远, 张增祥, 等. 中国5年间隔陆地生态系统空间分布数据集(1990—2010)内容与研发. 全球变化数据学报, 2017,1(1):52-59.
[
|
| [37] |
慕亚芹, 李群, 崔江浩. 土壤—植物营养学家朱兆良先生的科学研究与贡献. 土壤, 2017,49(1):1-6.
[
|
/
| 〈 |
|
〉 |