
JOURNAL OF NATURAL RESOURCES >
Influence and spillover effect of industrial eco-efficiency on PM2.5 pollution
Received date: 2019-09-05
Request revised date: 2020-03-25
Online published: 2021-05-28
Copyright
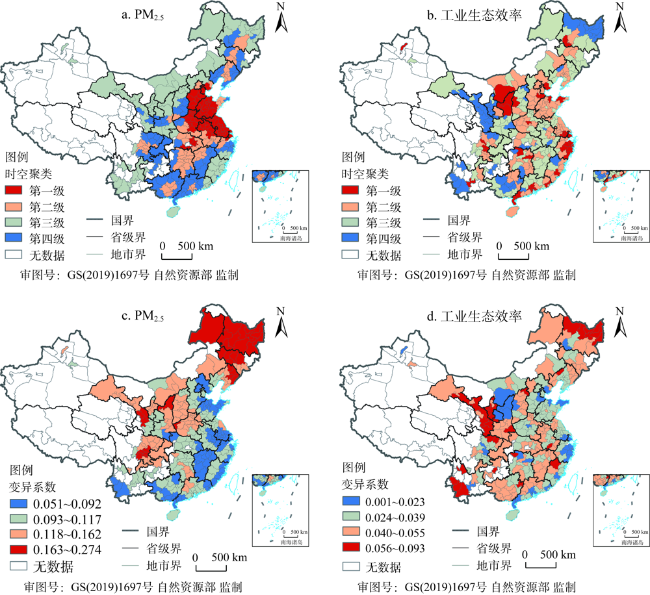
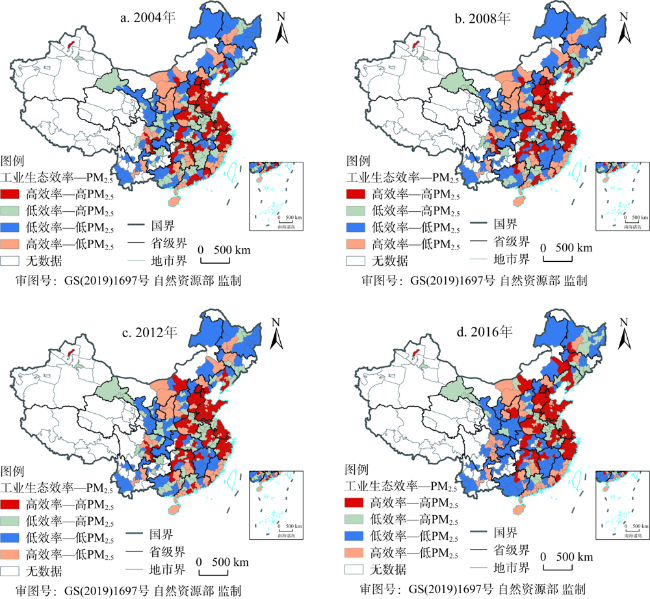
By means of spatial analysis and econometric models, the spatio-temporal correlation characteristics and effects between PM2.5 pollution and industrial eco-efficiency of prefecture-level cities in China from 2004 to 2016. The results show that: (1) Industrial eco-efficiency and PM2.5 shows a pattern of spatio-temporal staggered distribution. Areas with high PM2.5 pollution are mainly concentrated in the North China Plain and the middle and lower reaches of the Yangtze River, while high industrial eco-efficiency areas are distributed in coastal cities such as the Yangtze River Delta, the Pearl River Delta and the Bohai Rim Economic Zone, and a few major cities in the urban agglomerations of central and western China. (2) There is reciprocal interaction relationship between industrial eco-efficiency and PM2.5 pollution. Industrial eco-efficiency has a negative cumulative effect on PM2.5 pollution, and shows a "U-shaped" pattern, while the influence of PM2.5 pollution on industrial eco-efficiency is manifested by the positive cumulative effect of "inverted U-shaped" change. (3) Industrial eco-efficiency and PM2.5 pollution have significant spatio-temporal association, and the evolution of different types of spatio-temporal correlation keeps higher stability. Thereinto, the high industrial eco-efficiency and the high PM2.5 pollution regions are mainly concentrated in the urban agglomerations of the Beijing-Tianjin-Hebei region, the Shandong Peninsula and the Yangtze River Delta; the low industrial eco-efficiency and the low PM2.5 pollution regions are mainly distributed in the urban agglomerations of the Poyang Lake, the Guanzhong and the western region, as well as in a few cities in the northeast region. (4) Overall, industrial eco-efficiency has a significant and robust positive effect on PM2.5 pollution, but shows significant spatial heterogeneity. Specifically, the industrial agglomeration level, technological innovation and urban greening rates have a significant negative impact on PM2.5 pollution, while the effect of other variables is not significant.
LI Zai-jun , HU Mei-juan , ZHANG Ai-ping , ZHOU Nian-xing . Influence and spillover effect of industrial eco-efficiency on PM2.5 pollution[J]. JOURNAL OF NATURAL RESOURCES, 2021 , 36(3) : 737 -751 . DOI: 10.31497/zrzyxb.20210315
表1 各变量的描述性统计Table 1 The statistical description of all variables |
| 变量 | 指标 | 变量代码 | 均值 | 标准差 | 最大值 | 最小值 | 观测值 |
|---|---|---|---|---|---|---|---|
| 雾霾污染 | PM2.5平均浓度 | PM2.5 | 36.85 | 16.39 | 90.86 | 4.52 | 3679 |
| 工业生态效率 | 随机前沿效率 | Iee | 0.67 | 0.11 | 0.99 | 0.31 | 3679 |
| 城市规模水平 | 人口密度/(人/km2) | Den | 424.79 | 327.69 | 2661.54 | 4.7 | 3679 |
| 工业集聚水平 | 工业密度/(万元/km2) | Aggl | 0.01 | 0.23 | 13.92 | 0.001 | 3679 |
| 环境保护监督 | 信息化水平/(数/万人) | Lit | 1.09 | 1.09 | 13.09 | 0.03 | 3679 |
| 科学技术创新 | 科技与教育支出占财政支出占比/% | Tec | 19.88 | 5.62 | 186.86 | 1.58 | 3679 |
| 产业结构系数 | 第三产业产值/第二产业产值 | Ind | 82.12 | 41.29 | 948.22 | 0.09 | 3679 |
| 生态环境禀赋 | 建成区绿化覆盖率/% | Gcba | 37.24 | 14.53 | 386.64 | 0.36 | 3679 |
表2 各变量的平稳性检验Table 2 Test for stationariness of variables |
| 检验方法 | LLC检验 | ADF-Fisher检验 | IPS检验 | |||||
|---|---|---|---|---|---|---|---|---|
| 统计量 | 显著性 | 统计量 | 显著性 | 统计量 | 显著性 | |||
| lnPM2.5 | -7.614 | 0.000 | 36.606 | 0.000 | -15.087 | 0.000 | ||
| lnIee | -43.7195 | 0.000 | 139.708 | 0.000 | -29.615 | 0.000 | ||
注:LLC单位根检验对应的Adjusted t值,而ADF-Fisher检验对应修正后的inv. chi-squared值。 |
表3 面板VAR模型估计结果Table 3 Results of panel VAR model |
| h_lnPM2.5 | h_lnIee | |||
|---|---|---|---|---|
| 变量 | 系数 | 变量 | 系数 | |
| h_lnPM2.5(-1) | 0.780***(9.22) | h_lnPM2.5(-1) | 0.023***(9.15) | |
| h_lnIee(-1) | -0.442***(-7.3) | h_lnIee(-1) | 0.856***(415.76) | |
注:***表示在1%水平上显著;第一、第三列括号里的数字代表滞后1期;第二、第四列括号中数值为T统计值。 |
表4 2004—2016年PM2.5与工业生态效率空间相关系数Table 4 Bivariate Moran's I index between PM2.5 and industrial eco-efficiency during 2004-2016 |
| 年份 | 2004 | 2005 | 2006 | 2007 | 2008 | 2009 | 2010 | 2011 | 2012 | 2013 | 2014 | 2015 | 2016 |
|---|---|---|---|---|---|---|---|---|---|---|---|---|---|
| Moran's I | 0.0813 | 0.0702 | 0.0729 | 0.0664 | 0.0873 | 0.0806 | 0.0715 | 0.0811 | 0.0714 | 0.0727 | 0.0782 | 0.0780 | 0.0793 |
| Z | 3.385 | 2.942 | 3.001 | 2.726 | 3.912 | 3.490 | 3.099 | 3.698 | 2.971 | 3.250 | 3.494 | 3.805 | 3.748 |
| P | 0.001 | 0.001 | 0.001 | 0.001 | 0.001 | 0.001 | 0.001 | 0.001 | 0.001 | 0.001 | 0.001 | 0.001 | 0.001 |
表5 SDM模型估计结果Table 5 Estimation results of SDM |
| 变量 | 空间固定效应 | 时间固定效应 | 时空固定效应 |
|---|---|---|---|
| lnIee | 0.1942(1.73) * | -0.1114(-2.46) ** | 0.2430(2.13) ** |
| lnDen | -0.0032(-0.30) | 0.2890(18.85) *** | -0.0065(-0.60) |
| lnAggl | -0.0089(-1.27) | 0.1134(7.81) *** | -0.0151(-2.08) ** |
| lnLit | -0.0037(-0.43) | -0.3112(-17.74) *** | -0.0089(-0.99) |
| lnTec | -0.0366(-3.99) *** | -0.0184(-0.86) | -0.0435(-4.63) *** |
| lnInd | -0.0003(-0.05) | 0.0635(4.22) *** | 0.0001(0.00) |
| lnGcba | -0.0092(-1.70) * | 0.0704(4.92) ** | -0.0124(-2.27) ** |
| W×lnIee | -0.3316(-1.86) * | -0.3810(-2.82) | 0.2148(0.77) |
| W×lnDen | -0.0622(-2.38) ** | -0.0685(-1.77) | -0.0725(-2.74) *** |
| W×lnAggl | 0.0074(0.95) | 0.067(2.06) | -0.0879(-3.52) *** |
| W×lnLit | 0.0239(1.99) ** | -0.0636(-1.34) | -0.0224(-0.92) |
| W×lnTec | -0.0159(-0.86) | -0.3249(-5.62) | -0.0771(-3.11) *** |
| W×lnInd | 0.049(3.54) *** | 0.091(2.16) | 0.0535(2.30) ** |
| W×lnGcba | 0.0254(1.77) * | 0.0154(0.37) | -0.0032(-0.21) |
| Rho | 0.852(59.89) *** | 0.362(13.38) | 0.7190(36.04) *** |
| σ2 | 0.0071 | 0.0870 | 0.0072 |
| R2 | 0.9716 | 0.6540 | 0.9713 |
| LMlag | 3618.142*** | 310.805*** | 991.272*** |
| R-LMlag | 34.758*** | 83.192*** | 49.643*** |
| LMerror | 3591.523*** | 227.845*** | 968.440*** |
| R-LMerror | 8.138*** | 0.232 | 26.811*** |
| LR检验 | 9039.461*** | 1300.739*** |
注:*、**、***分别代表0.1、0.05和0.01的显著性水平,括号内为统计T值,下同。 |
表6 SDM直接效应和间接效应估计Table 6 Results of direct and indirect effects of SDM |
| 变量 | 直接效应 | 间接效应 | 总效应 |
|---|---|---|---|
| lnIee | 0.2919(2.442) ** | 1.3598(1.446) | 1.6517(1.682) * |
| lnDen | -0.0162(-1.350) | -0.2645(-2.815) *** | -0.2807(-2.809) ** |
| lnAggl | -0.0284(-3.427) *** | -0.3462(-4.012) *** | -0.3745(-4.122) *** |
| lnLit | -0.0122(-1.213) | -0.0940(-1.072) | -0.1063(-1.143) |
| lnTec | -0.0576(-5.530) *** | -0.3738(-4.367) *** | -0.4315(-4.787) *** |
| lnInd | 0.0068(0.787) | 0.1812(2.264) ** | 0.1879(2.223) ** |
| lnGcba | -0.014(-2.285)** | -0.0409(-0.749) | -0.0549(-0.945) |
表7 动态SDM模型估计结果Table 7 Results of dynamic SDM |
| 变量 | 空间固定效应 | 时间固定效应 | 时空固定效应 |
|---|---|---|---|
| lnPM2.5(t-1) | 1.0571(158.55) *** | 0.3137(17.68) *** | |
| W×lnPM2.5(t-1) | 0.2621(11.66) *** | -0.0821(-2.05) ** | |
| lnIee | 0.1395(2.19) ** | 0.0357(3.84) *** | 0.1308(2.08) ** |
| lnDen | 0.0057(0.53) | -0.0080(-1.24) | 0.0019(0.18) |
| lnAggl | -0.0083(-1.13) | -0.0271(-4.58) *** | -0.0119(-1.62) |
| lnLit | -0.0126(-1.40) | 0.0110(1.50) | -0.0124(-1.36) |
| lnTec | -0.0380(-4.00) *** | 0.0011(0.13) | -0.0473(-4.99) *** |
| lnInd | -0.0031(-0.40) | -0.0006(-0.09) | 0.0048(0.61) |
| lnGcba | -0.0132(-2.26) ** | 0.0008(0.14) | -0.0116(-2.00) ** |
| W×lnIee | 0.1526(1.53) | 0.2823(10.14) *** | 0.0440(0.29) |
| W×lnDen | -0.0331(-1.27) | -0.0608(-3.97) *** | -0.0511(-1.99) ** |
| W×lnAggl | 0.0064(0.78) | -0.1335(-9.77) *** | -0.0398(-1.51) |
| W×lnLit | -0.0453(-3.36) *** | 0.2367(11.60) *** | -0.0247(-0.99) |
| W×lnTec | 0.0006(0.03) | 0.1813(7.51) *** | -0.0338(-1.32) |
| W×lnInd | 0.0204(1.44) | -0.0434(-2.49) ** | 0.0396(1.65) * |
| W×lnGcba | 0.0101(0.63) | 0.0479(2.74) *** | 0.0003(0.02) |
| Rho | 0.8598(46.29) *** | 0.3815(22.46) *** | 0.6910(28.92) *** |
| σ2 | 0.0074 | 0.0142 | 0.0073 |
| R2 | 0.1650 | 0.9910 | 0.7530 |
表8 动态空间杜宾模型效应分解Table 8 Results of direct and indirect effects of dynamic SDM |
| 变量 | 短期直接效应 | 短期间接效应 | 长期直接效应 | 长期间接效应 |
|---|---|---|---|---|
| lnIee | 0.3077(2.53)** | 0.8701(0.96) | 0.5108(2.45) ** | 6.1439(0.32) |
| lnDen | -0.0043(-0.39) | -0.1607(-2.00)** | -0.0145(-0.63) | -0.9902(-0.25) |
| lnAggl | -0.0174(-2.12)** | -0.1467(-1.68)* | -0.0333(-2.13) ** | -0.8240(-0.55) |
| lnLit | -0.0162(-1.60) | -0.1100(-1.37) | -0.0293(-1.55) | -0.4930(-0.29) |
| lnTec | -0.0551(-5.12)*** | -0.2054(-2.58)*** | -0.0940(-3.15) *** | -1.4578(-0.22) |
| lnInd | 0.0099(1.20) | 0.1362(1.71)* | 0.0223(0.75) | 1.0015(0.15) |
| lnGcba | -0.0120(-1.84)* | -0.0226(-0.42) | -0.0193(-1.61) | -0.1552(-0.20) |
表9 分地区空间滞后回归结果Table 9 Results of sub-regional spatial lag regression |
| 变量 | 东部 | 中部 | 西部 | 东北 |
|---|---|---|---|---|
| lnIee | -0.5477(-4.68) *** | 0.0191(0.31) | 0.1668(2.61) *** | 0.4361(4.60) *** |
| lnDen | 0.1853(8.39) *** | 0.4342(33.66) *** | 0.4111(27.27) *** | 0.2798(16.08) *** |
| lnAggl | 0.1284(10.41) *** | 0.0014(0.18) | -0.0362(-3.03) *** | 0.0985(8.77) *** |
| lnLit | -0.2079(-8.28) *** | -0.1071(-6.53) *** | -0.0722(-3.04) *** | -0.0802(-2.62) *** |
| lnTec | -0.3653(-7.14) *** | -0.0043(-0.17) | 0.2415(7.5) *** | -0.0516(-1.58) |
| lnInd | -0.3425(-9.46) *** | -0.0037(-0.27) | -0.0276(-1.36) | 0.1078(5.38) *** |
| lnGcba | 0.1541(3.22) ** | 0.0925(3.93) *** | 0.0099(0.56) | -0.078(-2.55) ** |
| Rho | -0.087(-1.72) ** | 0.137(3.43) *** | -0.04(-1.06) | 0.008(0.19) |
| σ2 | 0.1132 | 0.0260 | 0.0684 | 0.0241 |
| R2 | 0.4324 | 0.7335 | 0.7305 | 0.8328 |
| LR | 336.4115*** | 252.6049*** | 167.4672*** | 219.2451*** |
| Hausman | -492.7477*** | 14.8111* | 60.1267*** | 2695.1631*** |
| [1] |
|
| [2] |
|
| [3] |
|
| [4] |
王振波, 方创琳, 许光, 等. 2014年中国城市PM2.5浓度的时空变化规律. 地理学报, 2015,70(11):1720-1734.
[
|
| [5] |
|
| [6] |
徐冬, 黄震方, 黄睿. 基于空间面板计量模型的雾霾对中国城市旅游流影响的空间效应. 地理学报, 2019,74(4):814-830.
[
|
| [7] |
|
| [8] |
刘海猛, 方创琳, 黄解军, 等. 京津冀城市群大气污染的时空特征与影响因素解析. 地理学报, 2018,73(1):177-191.
[
|
| [9] |
|
| [10] |
|
| [11] |
邵帅, 李欣, 曹建华, 等. 中国雾霾污染治理的经济政策选择: 基于空间溢出效应的视角. 经济研究, 2016,51(9):73-88.
[
|
| [12] |
邵帅, 李欣, 曹建华. 中国的城市化推进与雾霾治理. 经济研究, 2019,54(2):148-165.
[
|
| [13] |
东童童, 李欣, 刘乃全. 空间视角下工业集聚对雾霾污染的影响: 理论与经验研究. 经济管理, 2015,37(9):29-41.
[
|
| [14] |
东童童. 雾霾污染(PM2.5)、工业集聚与工业效率的交互影响研究. 软科学, 2016,30(3):26-30.
[
|
| [15] |
胡熠娜, 彭建, 刘焱序, 等. 区域生态效率研究进展. 生态学报, 2018,38(23):8277-8284.
[
|
| [16] |
关伟, 许淑婷. 中国能源生态效率的空间格局与空间效应. 地理学报, 2015,70(6):980-992.
[
|
| [17] |
李在军, 胡美娟, 周年兴. 中国地级市工业生态效率空间格局及影响因素. 经济地理, 2018,38(12):126-134.
[
|
| [18] |
卢燕群, 袁鹏. 中国省域工业生态效率及影响因素的空间计量分析. 资源科学, 2017,39(7):1326-1337.
[
|
| [19] |
袁荷, 仇方道, 朱传耿, 等. 江苏省工业环境效率时空格局及影响因素. 地理与地理信息科学, 2017,33(5):112-118.
[
|
| [20] |
张新林, 仇方道, 王长建, 等. 长三角城市群工业生态效率空间溢出效应及其影响因素. 长江流域资源与环境, 2019,28(8):1791-1800.
[
|
| [21] |
任胜钢, 张如波, 袁宝龙. 长江经济带工业生态效率评价及区域差异研究. 生态学报, 2018,38(15):5485-5497.
[
|
| [22] |
李成宇, 张士强, 张伟. 中国省际工业生态效率空间分布及影响因素研究. 地理科学, 2018,38(12):1970-1978.
[
|
| [23] |
吴文洁, 刘雪梦, 唐娟莉. FDI与中国工业生态效率: 基于面板联立方程模型的实证分析. 商业研究, 2019, ( 6):63-72.
[
|
| [24] |
童玉芬, 王莹莹. 中国城市人口与雾霾: 相互作用机制路径分析. 北京社会科学, 2014, ( 5):4-10.
[
|
| [25] |
胡志强, 苗健铭, 苗长虹. 中国地市工业集聚与污染排放的空间特征及计量检验. 地理科学, 2018,38(2):168-176.
[
|
| [26] |
|
| [27] |
|
| [28] |
|
| [29] |
|
| [30] |
刘帅宾, 杨山, 王钊. 基于人口流的中国省域城镇化空间关联特征及形成机制. 地理学报, 2019,74(4):648-663.
[
|
| [31] |
徐冬, 黄震芳, 黄睿, 等. 中国中东部雾霾污染与入境旅游的时空动态关联分析. 自然资源学报, 2019,34(5):1108-1120.
[
|
| [32] |
|
| [33] |
张国俊, 邓毛颖, 姚洋洋, 等. 广东省产业绿色发展的空间格局及影响因素分析. 自然资源学报, 2019,34(8):1593-1605.
[
|
/
| 〈 |
|
〉 |
