
JOURNAL OF NATURAL RESOURCES >
China's provincial agricultural carbon emissions measurement and low carbonization level evaluation: Based on the application of derivative indicators and TOPSIS
Received date: 2019-10-06
Request revised date: 2019-12-16
Online published: 2021-04-28
Copyright
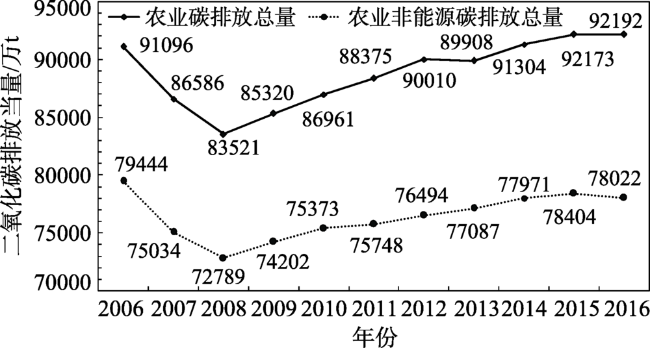
The calculation of agricultural carbon emissions and the evaluation of low carbonization levels are important bases for realizing green development of agriculture and formulating carbon emission reduction plans. This article firstly calculated the agricultural carbon emissions of 30 provincial-level regions in China from 2006 to 2016. Based on the calculation results, the agricultural carbon emission derivative indicators were constructed from three aspects: agricultural land, livestock farming and agricultural energy. The low carbonization levels of agriculture in the 30 regions were evaluated by the TOPSIS method with dynamic natural weights. The results showed that China's total agricultural carbon emissions showed a V-shaped tendency, which was 910.96 million tons in 2006 and dropped to 835.21 million tons in 2008, and steadily increased to 921.92 million tons in 2016 afterwards. Agricultural non-energy carbon emissions accounted for more than 84% of the total agricultural carbon emissions, and soil management was the largest source of agricultural non-energy carbon emissions. China's inter-provincial agricultural carbon emission derivatives were heterogeneous, and the overall low carbonization level of agriculture was not high. These provided references for agricultural and environmental departments to carry out low-carbon agriculture evaluation.
TIAN Cheng-shi , CHEN Yu . China's provincial agricultural carbon emissions measurement and low carbonization level evaluation: Based on the application of derivative indicators and TOPSIS[J]. JOURNAL OF NATURAL RESOURCES, 2021 , 36(2) : 395 -410 . DOI: 10.31497/zrzyxb.20210210
表1 肠道发酵碳源与排放系数Table 1 Intestinal fermentation carbon sources and emission coefficient |
| 碳源 | 排放系数 | 排放气体、单位 | 碳源 | 排放系数 | 排放气体、单位 |
|---|---|---|---|---|---|
| 奶牛 | 88.1/89.3/99.3 | CH4、kg/头/年 | 骆驼 | 46 | CH4、kg/峰/年 |
| 非奶牛 | 52.9/67.9/85.3 | CH4、kg/头/年 | 猪 | 1 | CH4、kg/头/年 |
| 马 | 18 | CH4、kg/匹/年 | 山羊 | 8.9/9.4/6.7 | CH4、kg/头/年 |
| 驴/骡 | 10 | CH4、kg/匹/年 | 绵羊 | 8.2/8.7/7.5 | CH4、kg/头/年 |
注:奶牛、非奶牛、山羊和绵羊的排放系数“88.1/89.3/99.3”,分别对应规模化饲养、农户散养和放牧饲养模式下动物肠道发酵产生甲烷的排放系数。 |
表2 粪便管理碳源与排放系数Table 2 Manure management carbon source and emission coefficient (kg/头/年) |
| 排放气体 | 地区 | 禽兽 | ||||||||
|---|---|---|---|---|---|---|---|---|---|---|
| 奶牛 | 非奶牛 | 绵羊 | 山羊 | 猪 | 家禽 | 马 | 驴/骡 | 骆驼 | ||
| CH4 | 华北 | 7.46 | 2.82 | 0.15 | 0.17 | 3.12 | 0.01 | 1.09 | 0.60 | 1.28 |
| 东北 | 2.23 | 1.02 | 0.15 | 0.16 | 1.12 | 0.01 | 1.09 | 0.60 | 1.28 | |
| 华东 | 8.33 | 3.31 | 0.26 | 0.28 | 5.08 | 0.02 | 1.64 | 0.90 | 1.92 | |
| 中南 | 8.45 | 4.72 | 0.34 | 0.31 | 5.85 | 0.02 | 1.64 | 0.90 | 1.92 | |
| 西南 | 6.51 | 3.21 | 0.48 | 0.53 | 4.18 | 0.02 | 1.64 | 0.90 | 1.92 | |
| 西北 | 5.93 | 1.86 | 0.28 | 0.32 | 1.38 | 0.01 | 1.09 | 0.60 | 1.28 | |
| 排放气体 | 地区 | 禽兽 | ||||||||
| 奶牛 | 非奶牛 | 绵羊 | 山羊 | 猪 | 家禽 | 马 | 驴/骡 | 骆驼 | ||
| N2O | 华北 | 1.846 | 0.794 | 0.093 | 0.093 | 0.227 | 0.007 | 0.330 | 0.188 | 0.330 |
| 东北 | 1.096 | 0.913 | 0.057 | 0.057 | 0.266 | |||||
| 华东 | 2.065 | 0.846 | 0.113 | 0.113 | 0.175 | |||||
| 中南 | 1.710 | 0.805 | 0.106 | 0.106 | 0.157 | |||||
| 西南 | 1.884 | 0.691 | 0.064 | 0.064 | 0.159 | |||||
| 西北 | 1.447 | 0.545 | 0.074 | 0.074 | 0.195 | |||||
表3 中国省际农业碳排放量Table 3 China's inter-provincial agricultural carbon emissions (万t CO2e) |
| 省(市、 自治区) | 农业碳排放总量 | 农业能源碳排放总量 | 农业非能源碳排放总量 | ||||||||
|---|---|---|---|---|---|---|---|---|---|---|---|
| 2006年 | 2011年 | 2016年 | 2006年 | 2011年 | 2016年 | 2006年 | 2011年 | 2016年 | |||
| 北京 | 303.58 | 283.79 | 191.89 | 127.56 | 118.90 | 63.76 | 176.02 | 164.89 | 128.13 | ||
| 天津 | 331.53 | 340.50 | 343.57 | 92.50 | 124.89 | 136.58 | 239.03 | 215.61 | 206.99 | ||
| 河北 | 3842.92 | 3443.68 | 3622.36 | 126.70 | 616.26 | 732.85 | 3716.22 | 2827.42 | 2889.50 | ||
| 山西 | 1491.38 | 1406.16 | 1466.55 | 421.70 | 547.66 | 530.07 | 1069.68 | 858.50 | 936.47 | ||
| 内蒙古 | 2849.89 | 3560.09 | 3924.07 | 391.13 | 921.56 | 1043.35 | 2458.76 | 2638.53 | 2880.72 | ||
| 辽宁 | 2328.42 | 2561.16 | 2565.50 | 506.94 | 527.15 | 510.45 | 1821.48 | 2034.01 | 2055.05 | ||
| 吉林 | 2426.01 | 2162.04 | 2474.17 | 415.97 | 231.41 | 390.59 | 2010.04 | 1930.63 | 2083.58 | ||
| 黑龙江 | 2939.40 | 3498.20 | 4170.41 | 564.33 | 644.12 | 1234.42 | 2375.07 | 2854.08 | 2935.99 | ||
| 上海 | 385.16 | 340.38 | 298.35 | 126.50 | 95.01 | 96.98 | 258.66 | 245.37 | 201.37 | ||
| 江苏 | 5214.81 | 5278.83 | 5233.19 | 555.78 | 768.75 | 774.75 | 4659.04 | 4510.08 | 4458.44 | ||
| 浙江 | 2454.35 | 2396.18 | 2239.20 | 622.95 | 685.28 | 740.61 | 1831.40 | 1710.90 | 1498.59 | ||
| 安徽 | 4691.98 | 4639.04 | 4859.00 | 251.73 | 375.66 | 406.61 | 4440.25 | 4263.39 | 4452.39 | ||
| 福建 | 2264.32 | 2086.65 | 1802.71 | 548.67 | 437.53 | 173.89 | 1715.65 | 1649.11 | 1628.82 | ||
| 江西 | 4318.49 | 4263.15 | 4374.57 | 294.74 | 211.23 | 225.15 | 4023.75 | 4051.92 | 4149.42 | ||
| 山东 | 6812.77 | 5042.44 | 5093.62 | 1373.27 | 655.82 | 800.71 | 5439.49 | 4386.62 | 4292.91 | ||
| 河南 | 7320.79 | 6493.30 | 6620.45 | 510.97 | 589.46 | 619.79 | 6809.82 | 5903.84 | 6000.66 | ||
| 湖北 | 5263.14 | 5596.47 | 5550.38 | 729.03 | 825.17 | 719.06 | 4534.11 | 4771.30 | 4831.32 | ||
| 湖南 | 6305.31 | 6415.26 | 6763.21 | 650.41 | 799.80 | 1010.80 | 5654.90 | 5615.46 | 5752.42 | ||
| 广东 | 3886.11 | 3803.24 | 3932.58 | 443.33 | 435.26 | 533.66 | 3442.78 | 3367.99 | 3398.91 | ||
| 广西 | 4210.26 | 3784.60 | 4025.33 | 100.31 | 127.17 | 345.29 | 4109.95 | 3657.43 | 3680.04 | ||
| 海南 | 885.86 | 953.34 | 863.83 | 107.57 | 199.32 | 157.07 | 778.29 | 754.02 | 706.75 | ||
| 重庆 | 1778.16 | 1902.06 | 1544.06 | 544.32 | 659.61 | 241.45 | 1233.84 | 1242.45 | 1302.61 | ||
| 四川 | 5486.46 | 5418.86 | 5507.82 | 362.04 | 454.26 | 514.47 | 5124.42 | 4964.60 | 4993.35 | ||
| 贵州 | 3021.17 | 2110.61 | 2454.58 | 577.46 | 221.15 | 456.52 | 2443.71 | 1889.46 | 1998.06 | ||
| 云南 | 3188.87 | 3348.63 | 3707.87 | 448.20 | 454.64 | 505.53 | 2740.67 | 2893.99 | 3202.34 | ||
| 陕西 | 1528.76 | 1497.88 | 1582.31 | 144.75 | 203.46 | 193.56 | 1384.01 | 1294.41 | 1388.75 | ||
| 甘肃 | 1592.12 | 1857.07 | 2038.73 | 153.82 | 207.12 | 223.83 | 1438.31 | 1649.94 | 1814.90 | ||
| 青海 | 956.54 | 1029.98 | 1070.98 | 16.77 | 35.61 | 37.88 | 939.77 | 994.36 | 1033.10 | ||
| 宁夏 | 386.90 | 435.21 | 468.21 | 23.04 | 36.14 | 31.19 | 363.86 | 399.07 | 437.02 | ||
| 新疆 | 2631.00 | 2425.80 | 3402.56 | 419.92 | 417.71 | 719.43 | 2211.09 | 2008.09 | 2683.13 | ||
图1 2006—2016年中国农业碳排放总量与农业非能源碳排放总量Fig. 1 China's total agricultural carbon emissions and total agricultural non-energy carbon emissions in 2006-2016 |
表4 中国省际农业非能源碳排放结构Table 4 China's inter-provincial agricultural non-energy carbon emission structure (%) |
| 省(市、 自治区) | 水稻种植 | 土壤管理 | 禽畜粪便 | 肠道发酵 | |||||||||||
|---|---|---|---|---|---|---|---|---|---|---|---|---|---|---|---|
| 2006年 | 2011年 | 2016年 | 2006年 | 2011年 | 2016年 | 2006年 | 2011年 | 2016年 | 2006年 | 2011年 | 2016年 | ||||
| 北京 | 0.11 | 0.04 | 0.04 | 44.19 | 47.08 | 43.77 | 25.15 | 25.36 | 26.68 | 30.55 | 27.52 | 29.51 | |||
| 天津 | 1.45 | 1.62 | 2.10 | 46.27 | 51.42 | 47.53 | 19.83 | 21.16 | 23.03 | 32.45 | 25.80 | 27.34 | |||
| 河北 | 0.79 | 0.97 | 0.93 | 36.59 | 51.52 | 51.92 | 18.91 | 18.18 | 18.43 | 43.72 | 29.32 | 28.72 | |||
| 山西 | 0.02 | 0.02 | 0.01 | 40.22 | 59.00 | 56.89 | 15.20 | 13.76 | 14.85 | 44.57 | 27.21 | 28.25 | |||
| 内蒙古 | 0.57 | 0.66 | 0.67 | 21.50 | 28.06 | 35.08 | 16.28 | 15.48 | 14.39 | 61.65 | 55.79 | 49.86 | |||
| 辽宁 | 6.91 | 6.53 | 5.51 | 36.84 | 41.76 | 41.31 | 16.09 | 15.90 | 16.17 | 40.16 | 35.81 | 37.01 | |||
| 吉林 | 4.20 | 4.60 | 4.82 | 31.38 | 43.09 | 47.33 | 14.28 | 13.05 | 12.42 | 50.14 | 39.26 | 35.43 | |||
| 黑龙江 | 15.26 | 18.78 | 19.85 | 31.64 | 36.25 | 38.70 | 11.95 | 10.56 | 10.38 | 41.15 | 34.41 | 31.07 | |||
| 上海 | 48.70 | 49.23 | 53.78 | 40.41 | 36.56 | 34.61 | 9.97 | 12.96 | 10.63 | 0.92 | 1.25 | 0.98 | |||
| 江苏 | 53.80 | 56.44 | 58.26 | 31.00 | 32.50 | 30.96 | 7.47 | 7.23 | 7.08 | 7.73 | 3.83 | 3.69 | |||
| 浙江 | 55.33 | 53.95 | 55.75 | 28.32 | 30.91 | 33.02 | 10.68 | 11.31 | 8.04 | 5.66 | 3.82 | 3.19 | |||
| 安徽 | 46.04 | 49.17 | 49.94 | 28.91 | 34.22 | 32.55 | 8.61 | 8.09 | 8.38 | 16.44 | 8.52 | 9.13 | |||
| 福建 | 39.95 | 40.07 | 39.17 | 34.46 | 37.13 | 38.39 | 12.53 | 12.77 | 12.51 | 13.06 | 10.03 | 9.93 | |||
| 江西 | 60.52 | 61.68 | 60.73 | 16.17 | 18.09 | 17.67 | 8.48 | 9.10 | 9.67 | 14.83 | 11.12 | 11.93 | |||
| 山东 | 1.05 | 1.27 | 1.11 | 47.26 | 56.03 | 54.37 | 17.11 | 16.98 | 18.76 | 34.58 | 25.71 | 25.77 | |||
| 河南 | 3.21 | 4.13 | 4.17 | 32.33 | 46.30 | 48.12 | 17.88 | 16.83 | 17.19 | 46.58 | 32.74 | 30.51 | |||
| 湖北 | 43.52 | 42.81 | 43.50 | 28.78 | 32.31 | 29.34 | 10.10 | 10.75 | 11.66 | 17.60 | 14.14 | 15.50 | |||
| 湖南 | 50.07 | 52.37 | 51.10 | 18.16 | 20.55 | 20.59 | 12.99 | 12.73 | 13.25 | 18.78 | 14.34 | 15.05 | |||
| 广东 | 40.58 | 41.73 | 40.48 | 26.93 | 32.14 | 33.81 | 14.42 | 14.02 | 13.43 | 18.07 | 12.11 | 12.27 | |||
| 广西 | 36.71 | 39.08 | 36.70 | 20.40 | 27.01 | 30.10 | 13.66 | 13.72 | 13.72 | 29.23 | 20.19 | 19.48 | |||
| 海南 | 27.22 | 30.08 | 28.19 | 25.52 | 36.90 | 39.40 | 11.71 | 11.74 | 12.23 | 35.56 | 21.28 | 20.19 | |||
| 重庆 | 29.85 | 30.27 | 29.10 | 28.64 | 34.24 | 33.30 | 15.75 | 16.29 | 16.34 | 25.77 | 19.20 | 21.26 | |||
| 四川 | 22.23 | 22.14 | 21.83 | 20.25 | 23.55 | 23.51 | 18.19 | 18.05 | 17.95 | 39.33 | 36.26 | 36.70 | |||
| 贵州 | 13.08 | 16.97 | 15.88 | 13.95 | 21.85 | 23.13 | 15.41 | 15.52 | 15.40 | 57.56 | 45.66 | 45.59 | |||
| 云南 | 5.86 | 5.79 | 5.48 | 24.96 | 31.75 | 34.35 | 17.97 | 17.02 | 16.75 | 51.22 | 45.44 | 43.42 | |||
| 陕西 | 2.36 | 2.52 | 2.39 | 40.26 | 59.89 | 62.82 | 12.11 | 9.47 | 9.08 | 45.27 | 28.12 | 25.72 | |||
| 甘肃 | 0.06 | 0.05 | 0.04 | 30.65 | 41.43 | 44.29 | 13.58 | 11.92 | 11.37 | 55.72 | 46.60 | 44.30 | |||
| 青海 | 0 | 0 | 0 | 3.10 | 4.14 | 4.60 | 16.09 | 15.84 | 15.30 | 80.81 | 80.02 | 80.10 | |||
| 宁夏 | 3.92 | 3.40 | 2.78 | 33.14 | 39.91 | 38.23 | 14.08 | 12.36 | 13.40 | 48.85 | 44.33 | 45.59 | |||
| 新疆 | 0.70 | 0.80 | 0.59 | 30.09 | 49.09 | 51.33 | 15.72 | 12.52 | 11.93 | 53.49 | 37.59 | 36.16 | |||
| 全国 | 24.77 | 26.43 | 25.71 | 28.26 | 34.73 | 35.53 | 14.01 | 13.43 | 13.50 | 32.96 | 25.41 | 25.26 | |||
表5 2006—2016年中国省际农业低碳化水平Table 5 China's inter-provincial low carbonization level in 2006-2016 |
| 省(市、 自治区) | 2006年 | 2007年 | 2008年 | 2009年 | 2010年 | 2011年 | 2012年 | 2013年 | 2014年 | 2015年 | 2016年 |
|---|---|---|---|---|---|---|---|---|---|---|---|
| 北京 | 0.544 | 0.551 | 0.512 | 0.497 | 0.501 | 0.505 | 0.488 | 0.528 | 0.522 | 0.516 | 0.480 |
| 天津 | 0.481 | 0.455 | 0.413 | 0.394 | 0.419 | 0.433 | 0.435 | 0.456 | 0.452 | 0.454 | 0.450 |
| 河北 | 0.479 | 0.454 | 0.373 | 0.360 | 0.351 | 0.334 | 0.321 | 0.328 | 0.316 | 0.309 | 0.314 |
| 山西 | 0.471 | 0.412 | 0.421 | 0.417 | 0.417 | 0.419 | 0.420 | 0.434 | 0.437 | 0.420 | 0.436 |
| 内蒙古 | 0.324 | 0.319 | 0.270 | 0.268 | 0.265 | 0.309 | 0.314 | 0.350 | 0.366 | 0.361 | 0.320 |
| 辽宁 | 0.240 | 0.235 | 0.204 | 0.198 | 0.202 | 0.211 | 0.213 | 0.223 | 0.218 | 0.221 | 0.231 |
| 吉林 | 0.283 | 0.297 | 0.230 | 0.208 | 0.205 | 0.213 | 0.208 | 0.211 | 0.201 | 0.203 | 0.198 |
| 黑龙江 | 0.249 | 0.240 | 0.200 | 0.197 | 0.191 | 0.202 | 0.219 | 0.268 | 0.278 | 0.291 | 0.295 |
| 上海 | 0.510 | 0.514 | 0.508 | 0.482 | 0.492 | 0.512 | 0.505 | 0.549 | 0.545 | 0.546 | 0.529 |
| 江苏 | 0.439 | 0.432 | 0.417 | 0.411 | 0.415 | 0.419 | 0.416 | 0.425 | 0.417 | 0.407 | 0.409 |
| 浙江 | 0.476 | 0.479 | 0.484 | 0.468 | 0.472 | 0.479 | 0.472 | 0.492 | 0.477 | 0.442 | 0.419 |
| 安徽 | 0.411 | 0.376 | 0.339 | 0.336 | 0.345 | 0.347 | 0.352 | 0.355 | 0.352 | 0.346 | 0.353 |
| 福建 | 0.467 | 0.454 | 0.460 | 0.448 | 0.450 | 0.454 | 0.457 | 0.488 | 0.471 | 0.447 | 0.468 |
| 江西 | 0.438 | 0.430 | 0.410 | 0.410 | 0.415 | 0.418 | 0.420 | 0.421 | 0.419 | 0.415 | 0.417 |
| 山东 | 0.444 | 0.419 | 0.408 | 0.389 | 0.393 | 0.406 | 0.430 | 0.414 | 0.398 | 0.384 | 0.401 |
| 河南 | 0.480 | 0.446 | 0.368 | 0.357 | 0.369 | 0.383 | 0.379 | 0.378 | 0.362 | 0.352 | 0.362 |
| 湖北 | 0.379 | 0.388 | 0.377 | 0.373 | 0.375 | 0.373 | 0.373 | 0.383 | 0.377 | 0.368 | 0.374 |
| 湖南 | 0.459 | 0.455 | 0.431 | 0.420 | 0.428 | 0.425 | 0.419 | 0.417 | 0.410 | 0.399 | 0.403 |
| 广东 | 0.490 | 0.492 | 0.474 | 0.464 | 0.469 | 0.468 | 0.461 | 0.452 | 0.438 | 0.426 | 0.426 |
| 广西 | 0.457 | 0.429 | 0.376 | 0.369 | 0.375 | 0.377 | 0.374 | 0.374 | 0.356 | 0.350 | 0.350 |
| 海南 | 0.477 | 0.430 | 0.369 | 0.367 | 0.363 | 0.371 | 0.371 | 0.390 | 0.386 | 0.379 | 0.371 |
| 重庆 | 0.455 | 0.430 | 0.366 | 0.343 | 0.369 | 0.381 | 0.385 | 0.340 | 0.322 | 0.307 | 0.318 |
| 四川 | 0.358 | 0.358 | 0.329 | 0.322 | 0.328 | 0.336 | 0.331 | 0.324 | 0.308 | 0.301 | 0.307 |
| 贵州 | 0.450 | 0.387 | 0.240 | 0.237 | 0.252 | 0.268 | 0.248 | 0.249 | 0.236 | 0.248 | 0.257 |
| 云南 | 0.298 | 0.304 | 0.256 | 0.242 | 0.241 | 0.253 | 0.259 | 0.260 | 0.246 | 0.243 | 0.248 |
| 陕西 | 0.372 | 0.315 | 0.189 | 0.186 | 0.183 | 0.192 | 0.195 | 0.197 | 0.192 | 0.195 | 0.193 |
| 甘肃 | 0.247 | 0.238 | 0.194 | 0.194 | 0.186 | 0.199 | 0.201 | 0.200 | 0.198 | 0.201 | 0.199 |
| 青海 | 0.372 | 0.381 | 0.378 | 0.376 | 0.376 | 0.381 | 0.379 | 0.378 | 0.376 | 0.373 | 0.375 |
| 宁夏 | 0.270 | 0.291 | 0.246 | 0.244 | 0.226 | 0.241 | 0.258 | 0.253 | 0.239 | 0.251 | 0.255 |
| 新疆 | 0.333 | 0.316 | 0.233 | 0.209 | 0.192 | 0.193 | 0.197 | 0.224 | 0.224 | 0.229 | 0.251 |
| [1] |
|
| [2] |
Food and Agriculture Organization of the United Nations. FAOSTAT. http://www.fao.org/faostat/zh/#data/GT, 2019-11-23.
|
| [3] |
中华人民共和国农业农村部. 关于印发《国家质量兴农战略规划(2018—2022年)》的通知. http://www.moa.gov.cn/nybgb/2019/201902/201905/t20190517_6309469.htm, 2019-02-20.
[ Ministry of Agriculture and Rural Affairs, PRC. Notice on printing and distributing the national strategic plan for promoting agriculture by quality (2018-2022). http://www.moa.gov.cn/nybgb/2019/201902/201905/t20190517_6309469.htm, 2019-02-20.]
|
| [4] |
|
| [5] |
|
| [6] |
|
| [7] |
|
| [8] |
|
| [9] |
|
| [10] |
|
| [11] |
董红敏, 李玉娥, 陶秀萍, 等. 中国农业源温室气体碳排放与减排技术对策. 农业工程学报, 2008,24(10):269-273.
[
|
| [12] |
王若梅, 马海良, 王锦. 基于水—土要素匹配视角的农业碳排放时空分异及影响因素: 以长江经济带为例. 资源科学, 2019,41(8):1450-1461.
[
|
| [13] |
李国志, 李宗植. 中国农业能源消费碳排放因素分解实证分析: 基于LMDI模型. 农业技术经济, 2010, (10):66-72.
[
|
| [14] |
谭秋成. 中国农业碳排放: 现状及挑战. 中国人口·资源与环境, 2011,21(10):69-75.
[
|
| [15] |
黄坚雄, 陈源泉, 隋鹏, 等. 农田温室气体净排放研究进展. 中国人口·资源与环境, 2011,21(8):87-94.
[
|
| [16] |
陈罗烨, 薛领, 雪燕. 中国农业净碳汇时空演化特征分析. 自然资源学报, 2016,31(4):56-67.
[
|
| [17] |
田云, 张俊飚. 中国农业生产净碳效应分异研究. 自然资源学报, 2013,28(8):1298-1309.
[
|
| [18] |
田云, 张俊飚, 李波. 中国农业碳排放研究: 测算、时空比较及脱钩效应. 资源科学, 2012,34(11):2097-2105.
[
|
| [19] |
|
| [20] |
|
| [21] |
|
| [22] |
|
| [23] |
揭懋汕, 郭洁, 陈罗烨, 等. 碳约束下中国县域尺度农业全要素生产率比较研究. 地理研究, 2016,35(5):98-108.
[
|
| [24] |
展进涛, 徐钰娇, 葛继红. 考虑碳排放成本的中国农业绿色生产率变化. 资源科学, 2019,41(5):62-74.
[
|
| [25] |
卢新海, 匡兵, 李菁. 碳排放约束下耕地利用效率的区域差异及其影响因素. 自然资源学报, 2018,33(4):657-668.
[
|
| [26] |
王宝义, 张卫国. 中国农业生态效率测度及时空差异研究. 中国人口·资源与环境, 2016,26(6):11-19.
[
|
| [27] |
高鸣, 宋洪远. 中国农业碳排放绩效的空间收敛与分异: 基于Malmquist-luenberger指数与空间计量的实证分析. 经济地理, 2015,35(4):142-148, 185.
[
|
| [28] |
闵继胜, 胡浩. 中国农业生产温室气体排放量的测算. 中国人口·资源与环境, 2012,22(7):21-27.
[
|
| [29] |
|
| [30] |
胡向东, 王济民. 中国畜禽碳排放量估算. 农业工程学报, 2010,26(10):247-252.
[
|
| [31] |
中华人民共和国农业农村部. 农业部办公厅关于印发《2016年畜禽养殖标准化示范创建活动工作方案》的通知. , 2016-02-15.
[ Ministry of Agriculture and Rural Affairs, PRC. Notice of the general office of the ministry of agriculture on printing and distributing the work plan for the 2016 model establishment of livestock and poultry standardization. , 2016-02-15.]
|
| [32] |
中华人民共和国国务院办公厅. 国务院关于促进畜牧业持续健康发展的意见. http://www.gov.cn/zwgk/2007-02/06/content_519464.htm, 2007-02-06.
[ General Office of the State Council, PRC. Opinions of the State Council on promoting sustainable and healthy development of animal husbandry. http://www.gov.cn/zwgk/2007-02/06/content_519464.htm, 2007-02-06.]
|
/
| 〈 |
|
〉 |