
JOURNAL OF NATURAL RESOURCES >
Optimizing the ecological networks based on the supply and demand of ecosystem services in Xiamen-Zhangzhou-Quanzhou region
Received date: 2019-05-30
Request revised date: 2019-07-24
Online published: 2021-04-28
Copyright
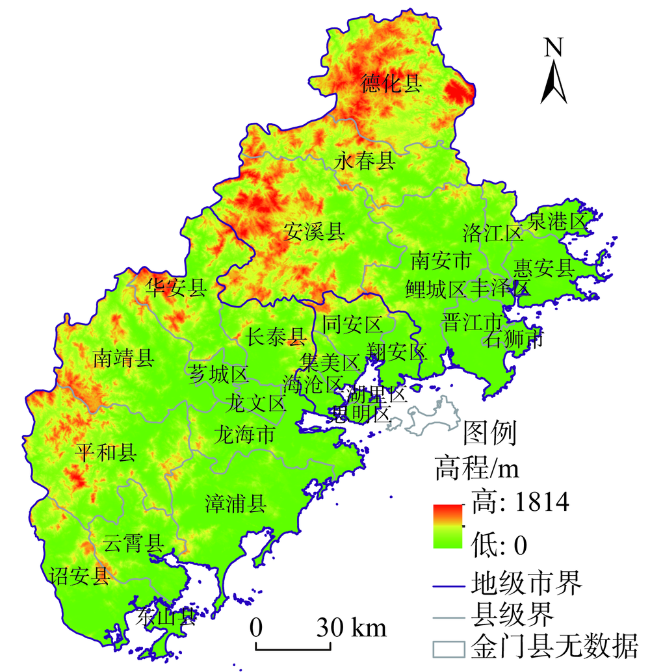
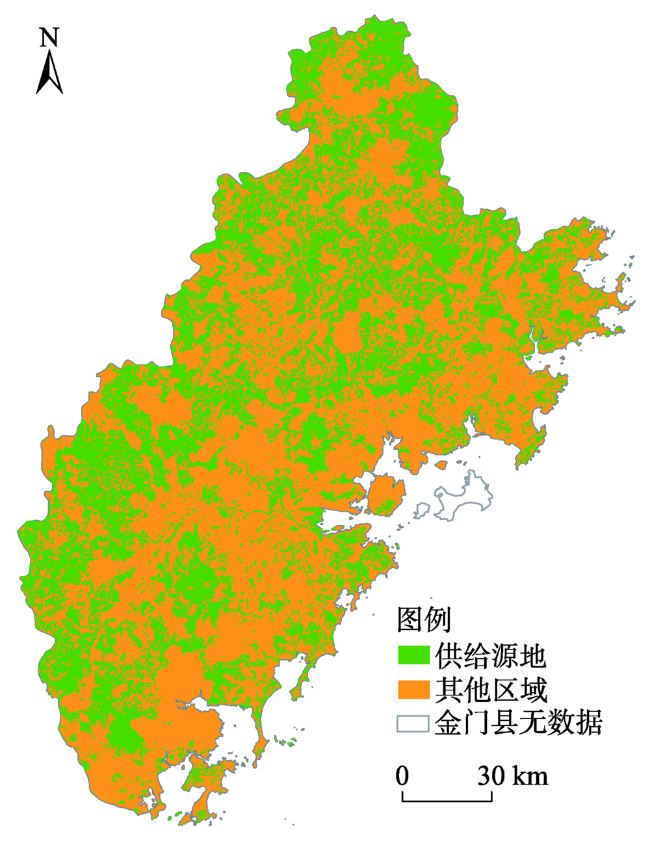
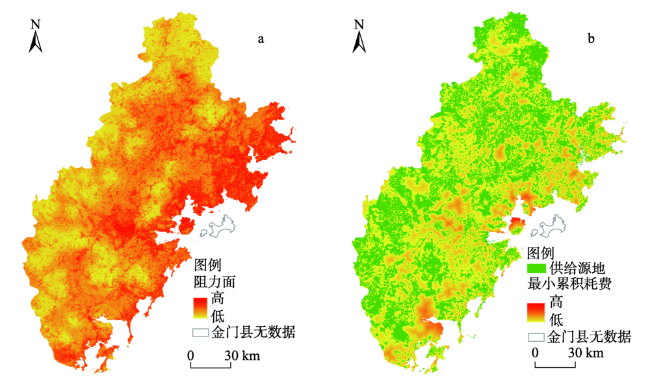
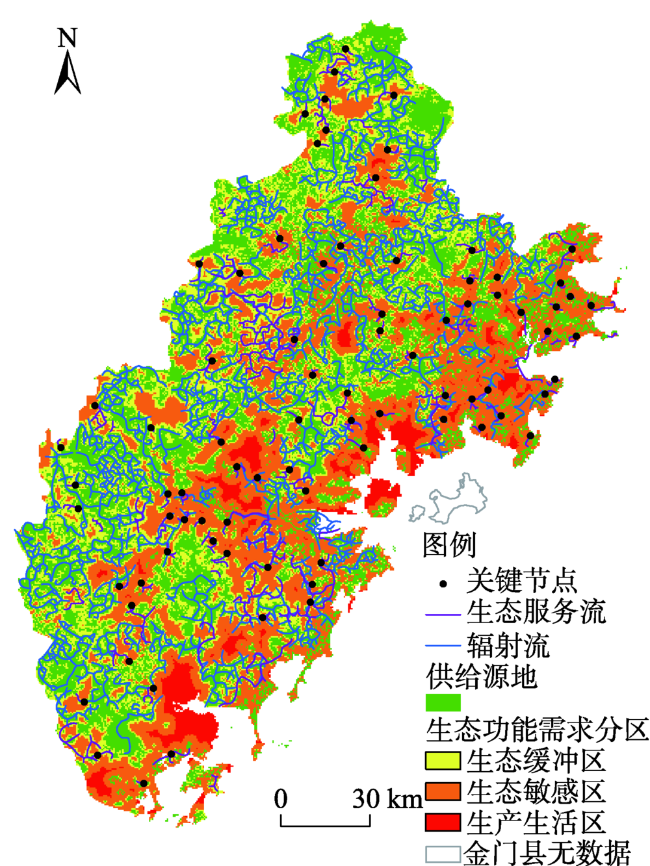
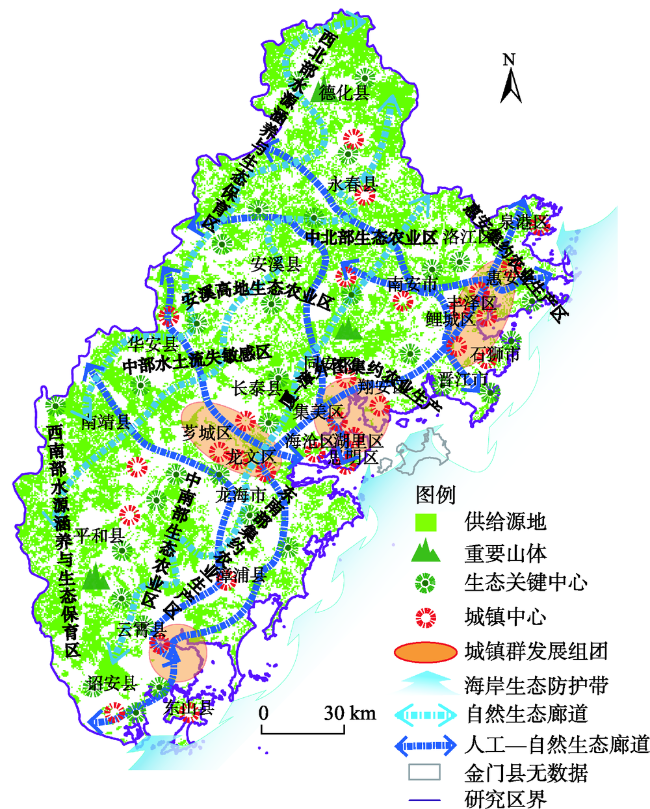
Coupling the supply and demand of ecosystem service with the security pattern of landscape ecology, and deconstructing the ecological space structure of urban agglomerations are the basis for optimizing the spatial arrangement of agriculture-urban areas-ecology networks. Based on the theory of supply and demand for ecosystem service, ecosystem service supply area was determined by fusing the most important areas of the integrated ecosystem services and the boundaries of the ecological red line, by taking Xiamen-Zhangzhou-Quanzhou Urban Agglomeration in the southeast coast of Fujian province as an example. In combination of natural and economic factors, the consumption pattern can be constructed. The minimum cumulative resistance model was further applied to establish a landscape ecology security pattern in order to identify landscape components, such as demand zones, network of ecological flows, and key nodes. Furthermore, the ecological network space of Xiamen-Zhangzhou-Quanzhou region was reconstructed by utilizing layered overlay analysis. The results showed that: (1) The supply area occupied 41.64% of the study area, in addition, ecological buffer zones, ecological sensitive zones, and production and living zones accounted for 22.67%, 31.58%, and 4.11%, respectively. (2) The source of supply was mainly distributed in the hilly and mountainous areas of the central and western regions, where the low-cost areas of ecosystem service were located. The high-cost areas concentrated in the coastal regions were characterized by an octothorpe shaped distribution pattern. (3) Ecological flow paths were highly meshed. They were mainly composed of forests in the central and western regions, and urban water system, green space systems and surrounding farmland in the eastern coastal areas. Both the type and intensity of the driving factors suggested significant spatial heterogeneity. (4) Constructing an ecological network space optimization layout of "nine zones, four groups, one belt, nine corridors and multi-centers" in the study region was also proposed in this research, so as to coordinate the production-living-ecological function among the region and facilitate the synergetic development of the economic-ecological space.
HU Qi-yu , CHEN Song-lin . Optimizing the ecological networks based on the supply and demand of ecosystem services in Xiamen-Zhangzhou-Quanzhou region[J]. JOURNAL OF NATURAL RESOURCES, 2021 , 36(2) : 342 -355 . DOI: 10.31497/zrzyxb.20210206
表1 评价因子体系及阻力系数Table 1 Evaluation factors and resistance coefficients |
| 评价因子 | 单位 | 权重 | 阻力值 | ||||
|---|---|---|---|---|---|---|---|
| 10 | 30 | 50 | 70 | 90 | |||
| 人口密度 | 人·km-2 | 0.251 | 0~50 | 50~500 | 500~3000 | 3000~6000 | >6000 |
| 土地利用类型 | — | 0.251 | 森林、湿地、水域 | 灌木林、草地 | 耕地 | 裸地等 | 建设用地 |
| 距交通干线距离 | m | 0.027 | >5000 | 2000~5000 | 1000~2000 | 500~1000 | <500 |
| 距水源涵养区距离 | km | 0.251 | 0~1 | 1~3 | 3~5 | 5~10 | >10 |
| 坡度 | (°) | 0.054 | 0~5 | 5~10 | 10~25 | 25~35 | >35 |
| 高程 | m | 0.054 | 0~200 | 200~400 | 400~600 | 600~1000 | >1000 |
| 土壤侵蚀强度 | — | 0.114 | 微弱 | 轻度 | 中度 | 强度 | 极强和剧烈 |
注:森林的阻力值为5。 |
表2 “九区四组团一带九廊道多中心”生态网络空间优化说明Table 2 Interpretation of "nine zones, four groups, one belt, nine corridors and multi-centers" |
| 核心概念 | 解释说明 | |
|---|---|---|
| 九区 | 生态保育核心区与水土保持敏感区 | 将生态保育核心区与水土保持敏感区划分为西北部水源涵养与生态保育、中部水土流失敏感、西南部水源涵养与生态保育三大区 |
| 生态—农业交错区 | 将生态—农业交错区划分为中北部生态农业、安溪高地生态农业、中南部生态农业三大区 | |
| 城郊集约农业区 | 将城郊集约农业区划分为惠安集约农业生产、厦—漳外围集约农业生产、东南部集约农业生产三大区 | |
| 四组团 | 一核 | 厦门市中心城区 |
| 双翼 | 泉州市和漳州市中心 | |
| 一重心 | 漳江河口城镇中心 | |
| 一带九廊 | 一带 | 海岸生态防护带 |
| 九廊道 | 人工—自然生态廊道、自然生态廊道共同形成“五横四纵”生态廊道网络 | |
| 多中心 | 城镇中心 | 市区城镇中心 |
| 县级城镇中心 | ||
| 生态关键中心 | — | |
| [1] |
景永才, 陈利顶, 孙然好. 基于生态系统服务供需的城市群生态安全格局构建框架. 生态学报, 2018,38(12):4121-4131.
[
|
| [2] |
|
| [3] |
|
| [4] |
彭保发, 郑俞, 刘宇. 耦合生态服务的区域生态安全格局研究框架. 地理科学, 2018,38(3):361-367.
[
|
| [5] |
|
| [6] |
马琳, 刘浩, 彭建, 等. 生态系统服务供给和需求研究进展. 地理学报, 2017,72(7):1277-1289.
[
|
| [7] |
|
| [8] |
|
| [9] |
肖玉, 谢高地, 鲁春霞, 等. 基于供需关系的生态系统服务空间流动研究进展. 生态学报, 2016,36(10):3096-3102.
[
|
| [10] |
曾辉, 陈立顶, 丁圣彦. 景观生态学. 北京: 高等教育出版社, 2017: 107-132.
[
|
| [11] |
任志远, 刘焱序. 基于价值量的区域生态安全评价方法探索: 以陕北能源区为例. 地理研究, 2013,32(10):1771-1781.
[
|
| [12] |
|
| [13] |
甄霖, 刘雪林, 魏云洁. 生态系统服务消费模式、计量及其管理框架构建. 资源科学, 2008,30(1):100-106.
[
|
| [14] |
|
| [15] |
武爱彬, 赵艳霞, 沈会涛, 等. 京津冀区域生态系统服务供需格局时空演变研究. 生态与农村环境学报, 2018,34(11):968-975.
[
|
| [16] |
|
| [17] |
|
| [18] |
|
| [19] |
|
| [20] |
方创琳, 周成虎, 顾朝林, 等. 特大城市群地区城镇化与生态环境交互耦合效应解析的理论框架及技术路径. 地理学报, 2016,71(4):531-550.
[
|
| [21] |
|
| [22] |
|
| [23] |
杨姗姗, 邹长新, 沈渭寿, 等. 基于生态红线划分的生态安全格局构建: 以江西省为例. 生态学杂志, 2016,35(1):250-258.
[
|
| [24] |
谢高地, 张彩霞, 张雷明, 等. 基于单位面积价值当量因子的生态系统服务价值化方法改进. 自然资源学报, 2015,30(8):1243-1254.
[
|
| [25] |
谢高地, 甄霖, 鲁春霞, 等. 一个基于专家知识的生态系统服务价值化方法. 自然资源学报, 2008,23(5):911-919.
[
|
| [26] |
|
| [27] |
刘慧敏, 刘绿怡, 丁圣彦. 人类活动对生态系统服务流的影响. 生态学报, 2017,37(10):3232-3242.
[
|
| [28] |
|
| [29] |
黄隆杨, 刘胜华, 方莹, 等. 基于“质量—风险—需求”框架的武汉市生态安全格局构建. 应用生态学报, 2019,30(2):615-626.
[
|
| [30] |
马明, 顾康康, 李咏. 基于生态安全格局的城乡生态空间布局与优化: 以宣城市为例. 中国农业资源与区划, 2019,40(4):93-102.
[
|
| [31] |
蒙吉军, 王雅, 王晓东, 等. 基于最小累积阻力模型的贵阳市景观生态安全格局构建. 长江流域资源与环境, 2016,25(7):1052-1061.
[
|
| [32] |
|
| [33] |
郑达贤, 汤小华. 福建省生态功能区划研究. 北京: 中国环境科学出版社, 2007: 41-56.
[
|
| [34] |
李潇然, 李阳兵, 王永艳, 等. 三峡库区县域景观生态安全格局识别与功能分区: 以奉节县为例. 生态学杂志, 2015,34(7):1959-1967.
[
|
| [35] |
蔡青, 曾光明, 石林, 等. 基于栅格数据和图论算法的生态廊道识别. 地理研究, 2012,31(8):1523-1534.
[
|
| [36] |
刘慧敏, 范玉龙, 丁圣彦. 生态系统服务流研究进展. 应用生态学报, 2016,27(7):2161-2171.
[
|
| [37] |
杨天荣, 匡文慧, 刘卫东, 等. 基于生态安全格局的关中城市群生态空间结构优化布局. 地理研究, 2017,36(3):441-452.
[
|
| [38] |
朱鹤健. 我国亚热带山地生态系统脆弱区生态恢复的战略思想: 基于长汀水土保持11年研究成果. 自然资源学报, 2013,28(9):1498-1506.
[
|
| [39] |
池源, 石洪华, 孙景宽, 等. 城镇化背景下海岛资源环境承载力评估. 自然资源学报, 2017,32(8):1374-1384.
[
|
| [40] |
|
| [41] |
陈峰, 李红波, 张安录. 基于生态系统服务的中国陆地生态风险评价. 地理学报, 2019,74(3):432-445.
[
|
| [42] |
陶岸君, 王兴平. 面向协同规划的县域空间功能分区实践研究: 以安徽省郎溪县为例. 城市规划, 2016,40(11):101-112.
[
|
/
| 〈 |
|
〉 |