
JOURNAL OF NATURAL RESOURCES >
Urban ecological well-being intensity and driving mode based on three-dimensional well-being:Taking the Yangtze Delta as an example
Received date: 2019-05-30
Request revised date: 2019-08-26
Online published: 2021-04-28
Copyright
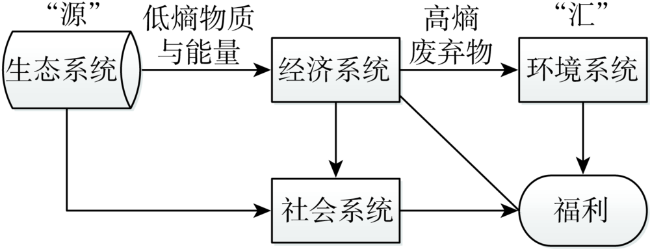
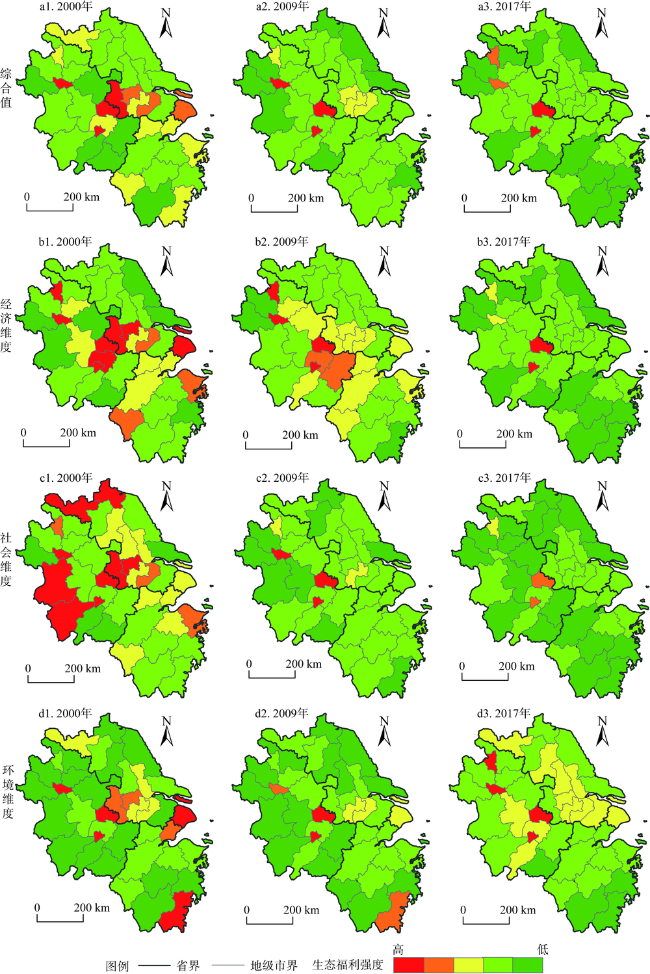
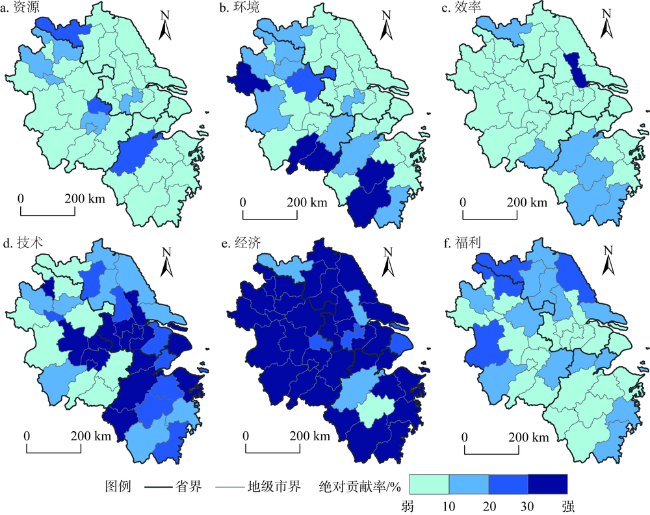
Through examining the urban ecological consumption and well-being level in the Yangtze River Delta from 2000 to 2017, this study analyzes the temporal and spatial evolution process and the driving model of ecological well-being intensity. The results show that the ecological intensity of well-being in most cities in the study area decreased by varying degrees with most cities having low or medium intensity. An increase in natural capital was required for every percentage point increase in well-being level, and the efficiency of transforming urban ecosystem services into well-being increased to varying degrees. Moreover, the efficiency of social services in generating social well-being was relatively high, so the corresponding amount of necessary natural capital was small. The intensity of environmental well-being first increased and then decreased over the time period. Analysis of spatial evolution shows that the ecological well-being intensity of the peripheral cities was lower than that of the core cities with the range of low intensity types spreading to the central part of the delta within four weeks. However, the medium and high intensity types were mainly distributed in resource-based and industry-intensive areas. In examining the driving factors of well-being, the resource consumption effect, technical effect, and well-being effect significantly increased urban ecological well-being intensity, while the strengthening of efficiency effect and economic effect decreased it. Additionally, the driving forces of the environmental consumption effect and scale effect were not significant. Furthermore, the driving model of urban well-being ecological intensity can be divided into four types: single-factor dominant, two-factor dominant, three-factor synergistic, and four-factor balanced.
HU Mei-juan , LI Zai-jun , DING Zheng-shan , ZHOU Nian-xing , QIN Dong-li , ZHANG Chen . Urban ecological well-being intensity and driving mode based on three-dimensional well-being:Taking the Yangtze Delta as an example[J]. JOURNAL OF NATURAL RESOURCES, 2021 , 36(2) : 327 -341 . DOI: 10.31497/zrzyxb.20210205
表1 生态消耗评价指标Table 1 The evaluation index of ecological consumption |
| 一级指标 | 二级指标 | 三级指标 |
|---|---|---|
| 资源消耗(RC) | 土地资源消耗 | 人均建成区面积 |
| 水资源消耗 | 人均用水量 | |
| 能源资源消耗 | 人均能源消费量 | |
| 人力资源消耗 | 全社会就业率 | |
| 环境污染(EP) | 废水排放量 | 人均工业废水排放量、人均生活污水排放量 |
| 废气排放量 | 人均二氧化硫排放量、人均氮氧化物排放量、人均烟粉尘排放量 | |
| 固体废弃物产生量 | 人均工业固体废弃物产生量、人均城市生活垃圾清运量 |
表2 城市福利水平评价指标体系Table 2 Urban welfare level evaluation index system |
| 一级指标 | 二级指标 | 三级指标 |
|---|---|---|
| 经济福利(B1) | 经济水平(C1) | 人均GDP(D1)、城镇居民人均可支配收入 (D2)、农村居民人均纯收入(D3)、人均财政收入(D4)、人均固定资产投资(D5)、职工平均工资 (D6)、人均储蓄额(D7) |
| 经济活力(C2) | 城镇居民人均消费水平(D8)、农村居民人均消费水平(D9)、城镇居民恩格 尔系数*(D10)、农村居民恩格尔系数*(D11)、居民消费价格指数*(D12)、 居住价格指数*(D13)、固定投资占GDP比例(D14) | |
| 社会福利(B2) | 医疗服务(C3) | 卫生事业投入增长率(D15)、每万人拥有医生数 (D16)、每万人拥有医院数(D17)、每万人拥有医院床位数(D18) |
| 教育水平(C4) | 平均受教育年限(D19)、全社会识字率(D20) | |
| 社会保障(C5) | 基本医疗参保率(D21)、最低生活保障率(D22) | |
| 就业水平(C6) | 全社会就业率(D23)、城镇登记失业率*(D24) | |
| 基础设施服务 (C7) | 人均拥有道路面积(D25)、每万人拥有公交车数(D26)、城镇居民人均住房 建筑面积(D27)、农村居民人均住房建筑面积(D28)、互联网普及率 (D29)、每万人拥有公共厕所数(D30)、社会公共服务财政支出比例 (D31)、千人拥有图书馆数(D32) | |
| 环境福利(B3) | 生态建设(C8) | 建成区绿化覆盖率(D33)、人均公园绿地面积(D34)、森林覆盖率(D35)、 万人拥有公园数(D36) |
| 环境质量(C9) | 空气质量优良率(D37)、环保治理投资比例(D38)、工业废水排放达标率 (D39)、工业固体废物综合利用率(D40)、生活垃圾无害化处理率(D41)、 城市节约用水重复利用率(D42) |
注:带*号为负向指标。 |
表3 2000—2017年长三角总体生态福利强度驱动因素的相对贡献率变化Table 3 Changes in the relative contribution rate of the ecological intensity drivers of urban well-being in Yangtze River Delta from 2000 to 2017 |
| 时段/年 | 资源消耗 | 环境污染 | 效率效应 | 技术效应 | 经济效应 | 规模效应 | 福利效应 |
|---|---|---|---|---|---|---|---|
| 2000—2001 | 23.68 | -20.49 | -0.91 | 21.26 | -26.73 | -1.25 | 24.36 |
| 2001—2002 | 14.49 | -38.55 | -2.16 | 37.08 | -58.67 | -2.49 | 4.08 |
| 2002—2003 | 24.81 | 10.03 | -8.52 | 68.93 | -90.49 | -1.39 | 73.54 |
| 2003—2004 | 51.18 | 27.63 | -11.02 | 118.30 | -135.20 | -3.32 | 107.89 |
| 2004—2005 | 60.81 | 24.95 | -2.52 | 147.28 | -165.94 | -3.52 | 121.99 |
| 2005—2006 | 64.18 | 16.94 | -9.59 | 160.21 | -187.47 | -4.49 | 132.74 |
| 2006—2007 | 66.16 | 13.09 | 20.87 | 160.54 | -205.88 | -5.06 | 146.31 |
| 2007—2008 | 75.76 | 1.31 | -18.00 | 173.77 | -227.17 | -5.85 | 155.73 |
| 2008—2009 | 91.17 | 3.89 | -12.71 | 201.18 | -246.47 | -6.64 | 157.08 |
| 2009—2010 | 104.94 | 14.29 | -19.72 | 234.33 | -273.74 | -6.75 | 176.01 |
| 2010—2011 | 119.90 | 5.82 | -24.96 | 263.00 | -290.02 | -10.89 | 187.70 |
| 2011—2012 | 118.24 | 4.66 | -27.37 | 270.41 | -301.64 | -11.19 | 187.06 |
| 2012—2013 | 114.34 | -5.94 | -22.32 | 312.17 | -353.82 | -13.31 | 201.81 |
| 2013—2014 | 118.91 | 8.86 | -28.68 | 311.71 | -355.68 | -13.77 | 207.34 |
| 2014—2015 | 110.26 | 4.55 | -23.77 | 297.95 | -339.76 | -13.38 | 193.45 |
| 2015—2016 | 111.42 | 19.41 | -36.29 | 307.73 | -345.28 | -13.25 | 199.35 |
| 2016—2017 | 106.18 | 42.09 | 13.89 | 518.81 | -429.54 | -97.23 | 263.83 |
| 均值 | 80.97 | 7.80 | -16.67 | 212.04 | -237.26 | -12.58 | 149.43 |
表4 长三角城市生态福利强度驱动模式Table 4 Driving model of urban ecological intensity of well-being in Yangtze River Delta |
| 类型 | 城市 |
|---|---|
| 单因素支配型 | 上海(D)、苏州(E)、绍兴(E)、淮北(E)、蚌埠(E)、南通(E)、扬州(E)、宿迁 (E)、舟山(E)、盐城(E)、淮安(E)、连云港(E)、安庆(E)、金华(B) |
| 双因素主导型 | 南京(DE)、无锡(DE)、镇江(DE)、宁波(DE)、衢州(DE)、合肥(DE)、芜湖 (DE)、铜陵(DE)、湖州(DE)、池州(BE)、阜阳(BE)、黄山(BE)、滁州(BE)、泰州 (CD) |
| 三因素协同型 | 常州(BDE)、嘉兴(DEG)、台州(DEG)、亳州(DEG)、马鞍山(ADE)、淮南(ADE) 、宣城(BEG)、六安(BEG) |
| 四因素协同型 | 杭州(BCDE)、丽水(BCDE)、徐州(ABCG)、温州(BDEG)、宿州(ABEG) |
注:字母A~G分别表示资源消耗、环境污染、效率效应、技术效应、经济效应、规模效应、福利效应驱动因素。 |
| [1] |
|
| [2] |
|
| [3] |
|
| [4] |
|
| [5] |
胡鞍钢, 周绍杰. 绿色发展: 功能界定、机制分析与发展战略. 中国人口·资源与环境, 2014,24(1):14-20.
[
|
| [6] |
张军. 生态福利观念的兴起与医疗保障模式的转型. 生态经济, 2009,25(1):90-92, 116.
[
|
| [7] |
何林, 陈欣. 基于生态福利的陕西省经济可持续发展研究. 开发研究, 2011,27(6):24-28.
[
|
| [8] |
郑伟, 石洪华, 陈尚, 等. 从福利经济学的角度看生态系统服务功能. 生态经济, 2006,21(6):78-81.
[
|
| [9] |
|
| [10] |
诸大建, 张帅. 生态福利绩效及其与经济增长的关系研究. 中国人口·资源与环境, 2014,24(9):59-67.
[
|
| [11] |
臧漫丹, 诸大建, 刘国平. 生态福利绩效: 概念、内涵及G20实证. 中国人口·资源与环境, 2013,23(5):118-124.
[
|
| [12] |
龙亮军, 王霞, 郭兵. 基于改进DEA模型的城市生态福利绩效评价研究: 以我国35个大中城市为例. 自然资源学报, 2017,32(4):595-605.
[
|
| [13] |
|
| [14] |
|
| [15] |
|
| [16] |
|
| [17] |
|
| [18] |
|
| [19] |
|
| [20] |
|
| [21] |
|
| [22] |
|
| [23] |
|
| [24] |
|
| [25] |
|
| [26] |
|
| [27] |
|
| [28] |
|
| [29] |
|
| [30] |
杨洋, 梅洁, 何春阳, 等. 基于弱HSDI与强HSDI的区域可持续性评价: 以中国环渤海地区为例. 自然资源学报, 2019,34(6):1285-1295.
[
|
| [31] |
李晓西, 刘一萌, 宋涛. 人类绿色发展指数的测算. 中国社会科学, 2014,35(6):65-95, 207-208.
[
|
| [32] |
|
| [33] |
陈志鸿, 李扬. 中国分区域城镇居民福利水平测度. 财经研究, 2018,44(10):111-124.
[
|
| [34] |
|
| [35] |
|
| [36] |
UNDP (United Nations Development Program). China Human Development Report 2005: Development with Equity. Beijing: UNDP, 2005.
|
/
| 〈 |
|
〉 |