
JOURNAL OF NATURAL RESOURCES >
Spatial patterns and moving trajectory of inbound tourists based on geo-tagged photos:A case study of Nanjing city
Received date: 2019-06-20
Request revised date: 2019-09-04
Online published: 2021-04-28
Copyright
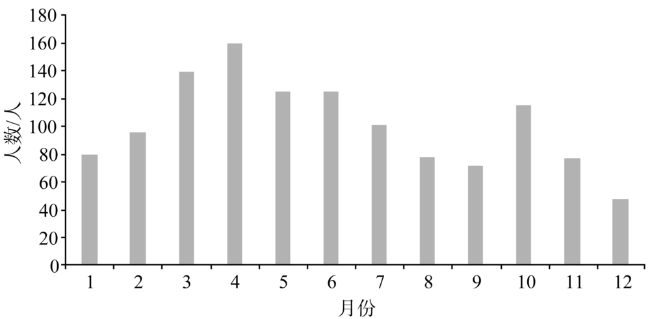
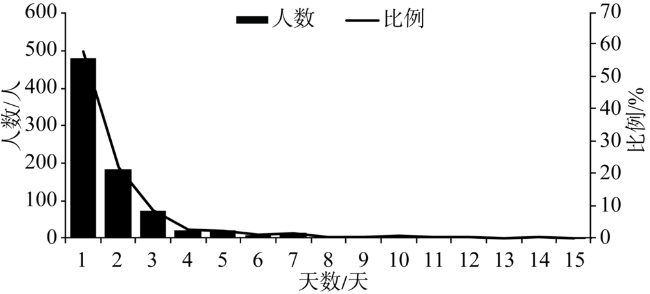
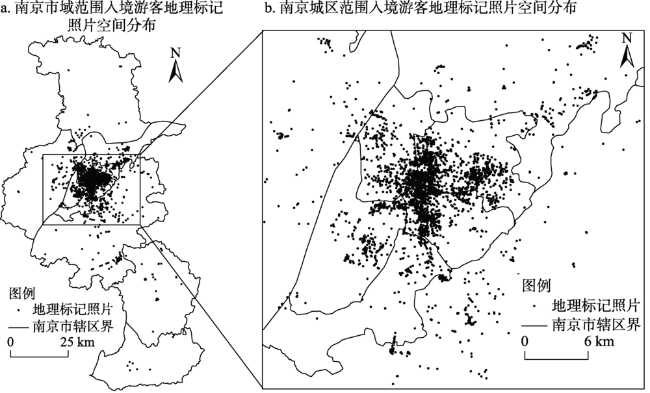
With the rise of the Internet and social media, geo-tagged data in the sharing of users has become an important content of tourism flow research. Based on the photos of on the Flickr platform during 2010-2018, this study takes the spatial characteristics of Nanjing inbound tourism flow as the research object, and uses the methods of DBSCAN algorithm, ArcGIS 10.2 and others to explore inbound tourism hotspots area, the features of moving trajectory and patterns of Nanjing. The results of the study show that: (1) The peak of inbound visits occurred in March-June and October, and the tourists mainly took one-day trips. (2) There are obvious differences in the spatial distribution of Area of Interest (AOI) in Nanjing. The historical urban district (HUD) is most popular for inbound tourists, and has the largest number of AOI, followed by the central urban area (CUA), and the suburbs. The distribution of AOI in the HUD is highly coincident with its related industrial space, such as tourist attractions and commercial shopping centers; Zhongshan Scenic Area in the CUA is a hotspot for tourists who are interested in history and culture; the distribution of AOI in the suburbs is basically consistent with that of local tourist attractions. (3) There are great differences in moving trajectories between single-day and multi-day trips, which are reflected in the network scope, network system, tourism inflow and outflow, and transfer difference. (4) The patterns of inbound moving trajectory can be divided into intra-area pattern and inter-area pattern. Based on the above results, suggestions are proposed for development of historical urban area, central urban area and the suburbs.
LU Shu-ying , HUANG Xin , TAO Zhuo-min . Spatial patterns and moving trajectory of inbound tourists based on geo-tagged photos:A case study of Nanjing city[J]. JOURNAL OF NATURAL RESOURCES, 2021 , 36(2) : 315 -326 . DOI: 10.31497/zrzyxb.20210204
图1 2010—2018年入境游客月度分布Fig. 1 Monthly distribution of inbound tourists during 2010-2018 |
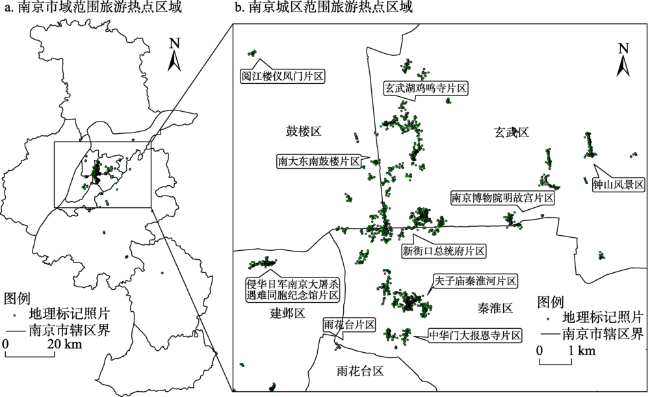
表1 南京市入境游客AOI分类及热度排序表Table 1 AOI classification and ranking of inbound tourists in Nanjing |
| 所属区域 | 热点区域 | 具体地点 | 排名 | 访客量/名 |
|---|---|---|---|---|
| 历史城区 | 玄武湖鸡鸣寺片区 | 玄武湖公园、鸡鸣寺、神策门至解放门城墙、南京站等 | 1 | 273 |
| 夫子庙秦淮河片区 | 夫子庙、秦淮河、瞻园、东水关等 | 3 | 227 | |
| 新街口总统府片区 | 新街口、总统府、净觉寺、郑和公园等 | 4 | 142 | |
| 阅江楼仪凤门片区 | 阅江楼、仪凤门至定淮门城墙、南京长江大桥等 | 5 | 117 | |
| 中华门大报恩寺片区 | 中华门瓮城、朝天宫、大报恩寺遗址公园等 | 6 | 65 | |
| 南大东南鼓楼片区 | 南京大学、东南大学、鼓楼公园、紫峰大厦、清凉山等 | 7 | 57 | |
| 南京博物院明故宫片区 | 南京博物院、明故宫遗址、太平门至光华门城墙等 | 10 | 38 | |
| 中心城区 | 钟山风景区 | 紫金山天文台、中山陵、明孝陵、灵谷寺等 | 2 | 232 |
| 雨花台片区 | 雨花台风景区、南京科技馆、花神湖、南京南站等 | 8 | 54 | |
| 侵华日军南京大屠杀遇难同胞纪念馆片区 | 侵华日军南京大屠杀遇难同胞纪念馆、莫愁湖公园等 | 9 | 46 | |
| 栖霞山仙林大学城片区 | 栖霞山、南京大学仙林校区等 | 12 | 29 | |
| 河西CBD | 绿博园、奥体中心、国际博览中心等 | 13 | 17 | |
| 郊区 | 浦口片区 | 浦口火车站、四方美术馆、老山森林公园等 | 15 | 9 |
| 牛首汤山片区 | 牛首山、汤山等 | 11 | 30 | |
| 南京禄口机场 | 南京国际禄口机场 | 14 | 15 | |
| 溧水片区 | 傅家边、观音禅寺、无想山等 | 16 | 4 |
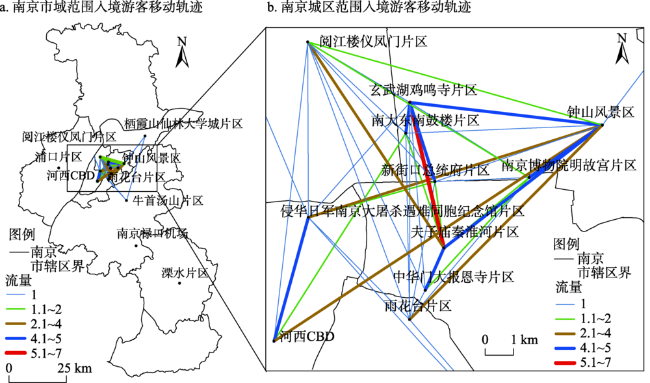
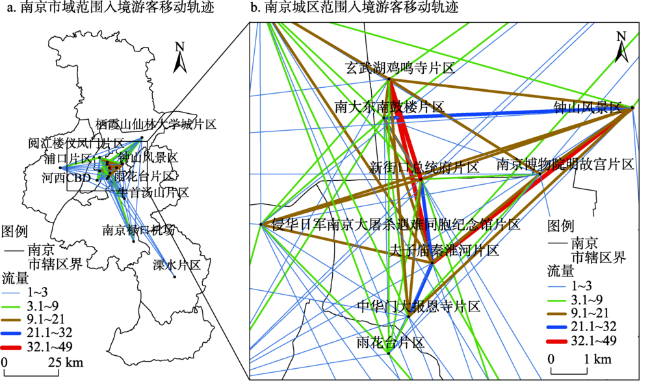
表2 南京市入境游客单日游、多日游流量统计表Table 2 Statistics of single-day trips and multi-day trips flow of inbound tourists in Nanjing |
| AOI名称 | 单日游 | 多日游 | ||||||||||
|---|---|---|---|---|---|---|---|---|---|---|---|---|
| 单个AOI | 多个AOI | |||||||||||
| 游客数/个 | 排名 | 入度 | 出度 | 流量 | 排名 | 入度 | 出度 | 流量 | 排名 | |||
| 玄武湖鸡鸣寺片区 | 81 | 1 | 13 | 15 | 28 | 2 | 116 | 111 | 227 | 1 | ||
| 钟山风景区 | 52 | 3 | 20 | 10 | 30 | 1 | 106 | 115 | 221 | 2 | ||
| 夫子庙秦淮河片区 | 63 | 2 | 10 | 17 | 27 | 3 | 109 | 104 | 213 | 3 | ||
| 新街口总统府片区 | 25 | 6 | 7 | 9 | 16 | 4 | 89 | 77 | 166 | 4 | ||
| 中华门大报恩寺片区 | 6 | 14 | 3 | 7 | 10 | 10 | 45 | 51 | 96 | 5 | ||
| 侵华日军南京大屠杀遇难同胞纪念馆片区 | 11 | 9 | 8 | 4 | 12 | 7 | 46 | 42 | 88 | 6 | ||
| 南大东南鼓楼片区 | 26 | 5 | 6 | 8 | 14 | 5 | 50 | 38 | 88 | 6 | ||
| 阅江楼仪凤门片区 | 30 | 4 | 8 | 4 | 12 | 7 | 34 | 38 | 72 | 8 | ||
| 南京博物院明故宫片区 | 8 | 13 | 7 | 7 | 14 | 5 | 28 | 30 | 58 | 9 | ||
| 雨花台片区 | 17 | 7 | 3 | 8 | 11 | 9 | 21 | 24 | 45 | 10 | ||
| 栖霞山仙林大学城片区 | 9 | 12 | 2 | 0 | 2 | 13 | 13 | 18 | 31 | 11 | ||
| 河西CBD | 11 | 9 | 4 | 5 | 9 | 11 | 11 | 13 | 24 | 12 | ||
| 牛首汤山片区 | 12 | 8 | 2 | 1 | 3 | 12 | 11 | 11 | 22 | 13 | ||
| 浦口片区 | 10 | 11 | 1 | 0 | 1 | 14 | 6 | 9 | 15 | 14 | ||
| 南京禄口机场 | 6 | 14 | 0 | 0 | 0 | 15 | 8 | 7 | 15 | 14 | ||
| 溧水片区 | 0 | 15 | 0 | 0 | 0 | 15 | 2 | 1 | 3 | 16 | ||
| [1] |
王永明, 王美霞, 吴殿廷, 等. 基于ZINB模型的中国省域间入境旅游流影响因素. 经济地理, 2018,38(11):234-240.
[
|
| [2] |
|
| [3] |
唐弘久, 保继刚. 我国主要入境客源地游客的时空特征及影响因素. 经济地理, 2018,38(9):222-230, 239.
[
|
| [4] |
|
| [5] |
鲁小波, 陈晓颖, 马斌斌. 东北亚各国间旅游流规模与潜力分析. 干旱区资源与环境, 2015,29(11):208-213.
[
|
| [6] |
马晓龙. 西安旅游区入境旅游流时空演变及系统调控. 人文地理, 2006,21(4):88-93.
[
|
| [7] |
卞显红, 沙润, 杜长海. 长江三角洲城市入境旅游流区域内流动份额分析. 人文地理, 2007,22(2):32-38.
[
|
| [8] |
刘宏盈, 马耀峰, 白凯, 等. 口岸入境旅游流扩散转移特征研究: 以上海为例. 社会科学家, 2008, (1):99-103.
[
|
| [9] |
杨敏, 马耀峰, 李天顺, 等. 网络信息与入境旅游流的V-R耦合关系分析: 以澳大利亚入境旅游流为例. 干旱区资源与环境, 2012,26(6):214-219.
[
|
| [10] |
张春晖, 马耀峰, 吴晶, 等. 供需视角下西部入境旅游流与目的地耦合协调度及其时空分异研究. 经济地理, 2013,33(10):174-181.
[
|
| [11] |
董亚娟, 马耀峰, 李振亭, 等. 西安入境旅游流与城市旅游环境耦合协调关系研究. 地域研究与开发, 2013,32(1):98-101.
[
|
| [12] |
李幼龙, 胡敏, 马耀峰. 新疆入境旅游流与区域经济耦合协调度分析. 资源开发与市场, 2013,29(4):418-421.
[
|
| [13] |
杨兴柱, 蒋锴, 陆林. 南京市游客路径轨迹空间特征研究: 以地理标记照片为例. 经济地理, 2014,34(1):181-187.
[
|
| [14] |
朱鹤, 刘家明, 陶慧, 等. 基于网络信息的北京市旅游资源吸引力评价及空间分析. 自然资源学报, 2015,30(12):2081-2094.
[
|
| [15] |
王守成, 郭风华, 傅学庆, 等. 基于自发地理信息的旅游地景观关注度研究: 以九寨沟为例. 旅游学刊, 2014,29(2):84-92.
[
|
| [16] |
|
| [17] |
|
| [18] |
|
| [19] |
唐鸣镝, 秦静, 黄震宇, 等. 北京城市旅游功能热区的演变与规划响应. 规划师, 2018,34(4):88-94.
[
|
| [20] |
秦静, 李郎平, 唐鸣镝, 等. 基于地理标记照片的北京市入境旅游流空间特征. 地理学报, 2018,73(8):1556-1570.
[
|
| [21] |
范梦余, 陈怡宁, 张辉. 呼伦贝尔游客POI空间格局与移动轨迹研究: 基于地理标记照片的实证分析. 干旱区资源与环境, 2019,33(6):203-208.
[
|
| [22] |
|
| [23] |
李新延, 李德仁. DBSCAN空间聚类算法及其在城市规划中的应用. 测绘科学, 2005, (3):51-53, 5.
[
|
| [24] |
周红芳, 王鹏. DBSCAN算法中参数自适应确定方法的研究. 西安理工大学学报, 2012,28(3):289-292.
[
|
| [25] |
朱孟珏, 庄大昌, 李涛. 1990—2014年中国煤炭运输网络的时空特征研究. 自然资源学报, 2018,33(3):454-466.
[
|
| [26] |
段亚明, 刘勇, 刘秀华, 等. 基于POI大数据的重庆主城区多中心识别. 自然资源学报, 2018,33(5):788-800.
[
|
/
| 〈 |
|
〉 |