
JOURNAL OF NATURAL RESOURCES >
Spatial and temporal characteristics and influencing factors of urban resources and environmental efficiency in the Yellow River Basin
Received date: 2020-05-18
Request revised date: 2020-09-28
Online published: 2021-03-28
Copyright
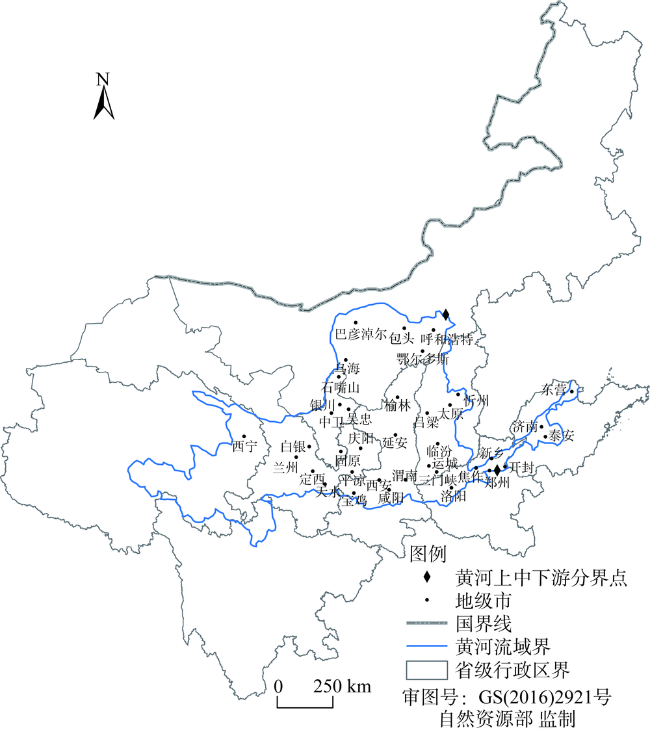
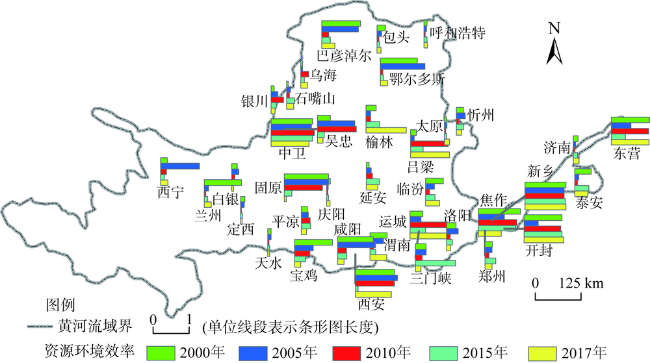
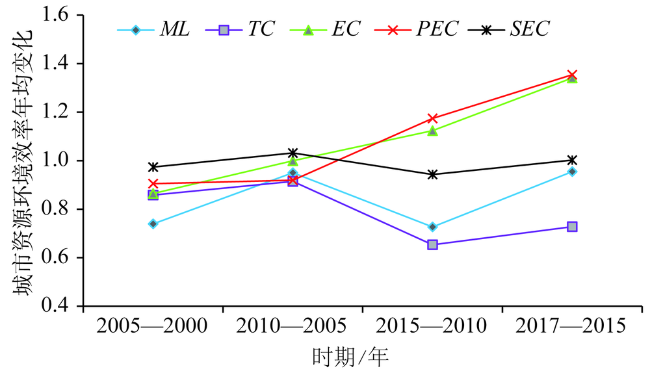
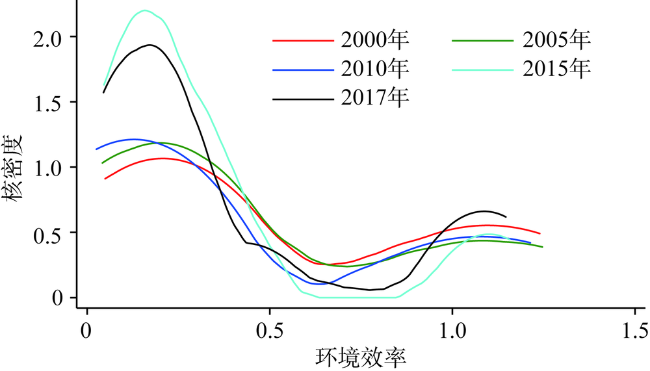
Improving urban resources and environmental efficiency is of great significance to the high-quality development of the river basin. This article uses the SBM super-efficiency model based on undesired output and the Malmquist-Luenberger index, the resources and environmental efficiency of cities above prefecture level in the Yellow River Basin in 2000, 2005, 2010, 2015 and 2017 were measured and calculated, and their spatial and temporal characteristics were analyzed in combination with the kernel density function. Finally, the Tobit model is used to measure the main influencing factors of urban resources and environmental efficiency, which is expected to provide a scientific reference for improving the quality and efficiency of the resources and environment of the study area. The results show that the urban resources and environmental efficiency of the Yellow River Basin has generally shown a U-shaped change trend, and the overall level is not high. The number of non-DEA effective cities is much larger than that of DEA effective cities. Urban total factor productivity has shown a downward trend, but efficiency changes and pure technical efficiency changes show an improvement trend; industrial structure and government intervention are positively correlated with resources and environmental efficiency. The level of economic development, urbanization, energy consumption and environmental governance have a negative effect on the resources and environmental efficiency.
LIN Jiang-biao , WANG Ya-juan , ZHANG Xiao-hong , LIU Xiao-peng . Spatial and temporal characteristics and influencing factors of urban resources and environmental efficiency in the Yellow River Basin[J]. JOURNAL OF NATURAL RESOURCES, 2021 , 36(1) : 208 -222 . DOI: 10.31497/zrzyxb.20210114
表1 城市资源环境效率投入产出指标体系Table 1 Input and output index system of urban resources and environmental efficiency |
| 指标 | 类别 | 指标内容 |
|---|---|---|
| 投入指标 | 劳动力 | 年末从业人员/万人 |
| 资本投入 | 全社会固定资产投资总额/万元 | |
| 水资源投入 | 全社会供水总量/万t | |
| 土地投入 | 城市建成区面积/km2 | |
| 能源消耗 | 能源消费总量/万t标煤 | |
| 产出指标 | 期望产出 | 地区GDP/万元 |
| 非期望产出 | 工业废水排放量/万t | |
| 工业废气排放量/万标m3 | ||
| 工业固体废物产生量/万t |
表2 黄河流域城市资源环境效率聚类结果Table 2 Clustering results of urban resources and environmental efficiency in the Yellow River Basin |
| 类别 | 城市 |
|---|---|
| 第一类 | 中卫、新乡 |
| 第二类 | 焦作、开封、西安、东营、固原 |
| 第三类 | 运城、巴彦淖尔、吴忠、咸阳、吕梁、鄂尔多斯、宝鸡 |
| 第四类 | 西宁、渭南、临汾、兰州、白银、银川、包头、定西、呼和浩特、济南、洛阳、郑州、平凉、三门峡、榆林、庆阳、石嘴山、太原、泰安、天水、乌海、忻州、延安 |
表3 黄河流域城市ML指数及其分解Table 3 ML Index and its decomposition of cities in the Yellow River Basin |
| 城市 | 全要素生产率ML | 技术变化TC | 效率变化EC | 纯技术效率变化PEC | 规模效率变化SEC |
|---|---|---|---|---|---|
| 巴彦淖尔 | 0.835 | 0.900 | 1.105 | 1.105 | 0.998 |
| 白银 | 0.502 | 0.616 | 0.820 | 1.182 | 0.721 |
| 包头 | 0.619 | 0.753 | 1.010 | 0.980 | 1.029 |
| 宝鸡 | 0.551 | 0.689 | 0.797 | 0.836 | 0.965 |
| 定西 | 0.726 | 0.843 | 0.853 | 1.000 | 0.853 |
| 东营 | 0.887 | 0.875 | 1.018 | 1.013 | 1.000 |
| 鄂尔多斯 | 0.979 | 0.823 | 1.247 | 1.291 | 0.975 |
| 固原 | 0.402 | 0.634 | 0.703 | 1.000 | 0.703 |
| 呼和浩特 | 0.647 | 0.727 | 0.971 | 0.989 | 0.990 |
| 济南 | 0.846 | 0.779 | 1.136 | 1.152 | 0.993 |
| 焦作 | 0.700 | 0.699 | 0.996 | 1.000 | 0.996 |
| 开封 | 0.778 | 0.772 | 1.010 | 1.008 | 1.000 |
| 兰州 | 0.682 | 0.635 | 1.153 | 1.198 | 0.964 |
| 临汾 | 0.813 | 0.818 | 1.046 | 1.017 | 0.993 |
| 吕梁 | 1.830 | 1.131 | 1.393 | 1.031 | 1.225 |
| 洛阳 | 0.644 | 0.739 | 0.905 | 0.905 | 0.997 |
| 平凉 | 0.743 | 0.786 | 0.911 | 1.066 | 0.852 |
| 庆阳 | 0.805 | 0.848 | 1.083 | 1.000 | 1.083 |
| 三门峡 | 0.877 | 0.883 | 0.982 | 0.970 | 0.933 |
| 石嘴山 | 0.820 | 0.715 | 1.252 | 1.131 | 1.089 |
| 太原 | 1.163 | 0.646 | 1.632 | 1.660 | 0.995 |
| 泰安 | 0.914 | 0.764 | 1.356 | 1.317 | 0.998 |
| 天水 | 0.799 | 0.712 | 1.167 | 1.315 | 1.071 |
| 渭南 | 0.954 | 0.720 | 1.286 | 1.250 | 1.003 |
| 乌海 | 1.482 | 0.698 | 1.771 | 1.174 | 1.398 |
| 吴忠 | 0.766 | 0.786 | 0.915 | 0.967 | 0.927 |
| 西安 | 0.718 | 0.680 | 1.058 | 1.051 | 1.000 |
| 西宁 | 0.786 | 0.721 | 1.063 | 1.038 | 0.981 |
| 咸阳 | 0.641 | 0.782 | 0.814 | 0.866 | 0.942 |
| 忻州 | 0.855 | 0.887 | 1.106 | 1.165 | 0.926 |
| 新乡 | 0.736 | 0.736 | 1.000 | 1.000 | 1.000 |
| 延安 | 1.065 | 0.854 | 1.244 | 1.355 | 0.921 |
| 银川 | 0.711 | 0.758 | 0.951 | 0.938 | 1.000 |
| 榆林 | 1.144 | 1.173 | 1.180 | 1.136 | 1.025 |
| 运城 | 1.115 | 0.987 | 1.082 | 1.049 | 1.020 |
| 郑州 | 0.799 | 0.753 | 1.028 | 1.114 | 0.975 |
| 中卫 | 0.853 | 0.853 | 1.000 | 1.000 | 1.000 |
| 均值 | 0.843 | 0.789 | 1.082 | 1.088 | 0.988 |
表4 黄河流域城市资源环境效率影响因素回归结果Table 4 Regression results of influencing factors of urban resources and environmental efficiency in the Yellow River Basin |
| 影响因素 | 相关系数 | 标准误 | z统计量 | P>|z| |
|---|---|---|---|---|
| GDP | -0.122** | 0.465 | -2.13 | 0.033 |
| URBAN | -0.050** | 0.115 | -2.37 | 0.027 |
| EG | -0.043*** | 0.245 | -2.83 | 0.008 |
| EC | -0.170* | 0.667 | -1.77 | 0.089 |
| GS | 0.108 | 0.026 | 0.610 | 0.540 |
| GOV | 0.301* | 0.002 | 2.29 | 0.064 |
注:***、**、*分别表示在1%,5%和10%显著性水平显著。 |
| [1] |
尹科, 王如松, 周传斌, 等. 国内外生态效率核算方法及其应用研究述评. 生态学报, 2012,32(11):3595-3605.
[
|
| [2] |
[
|
| [3] |
World Business Council for Sustainable Development. Eco-efficiency: Leadership for Improved Economic and Environmental Performance. Geneva: WBCSD, 1996: 1-16.
|
| [4] |
任宇飞, 方创琳, 蔺雪芹. 中国东部沿海地区四大城市群生态效率评价. 地理学报, 2017,72(11):2047-2063.
[
|
| [5] |
杨青山, 张郁, 李雅军. 基于DEA的东北地区城市群环境效率评价. 经济地理, 2012,32(9):51-55, 60.
[
|
| [6] |
|
| [7] |
|
| [8] |
盖美, 聂晨. 环渤海地区生态效率评价及空间演化规律. 自然资源学报, 2019,34(1):104-115.
[
|
| [9] |
曹永利. 我国能源经济效率及国际比较. 时代金融, 2018, (1):52.
[
|
| [10] |
杨刚强, 季轶凡, 王嵩, 等. 我国区域空气污染治理效率及其影响机制: 基于超效率SBM模型和门槛回归模型. 中国环境管理, 2020, (1):71-79.
[
|
| [11] |
曾贤刚, 牛木川. 高质量发展条件下中国城市环境效率评价. 中国环境科学, 2019,39(6):2667-2677.
[
|
| [12] |
李政通, 白彩全, 姚成胜, 等. 长江流域经济发展效率与生态环境补偿机制研究. 统计与决策, 2016, (24):126-130.
[
|
| [13] |
孙伟, 韩裕光. 淮河流域生态效率的测度及分析. 江淮论坛, 2018, (1):45-49.
[
|
| [14] |
胡振华, 龙婧宇. 基于DEA-Malmquist的湘江流域城市群河流环境效率研究. 科技管理研究, 2020, (2):237-245.
[
|
| [15] |
李惟昊. 基于Laspeyres模型的低碳城市试点生态效率评价研究: 以江西赣江新区为例. 巢湖学院学报, 2019,21(6):42-50.
[
|
| [16] |
崔木花. 基于改进熵权TOPSIS模型的城镇生态效率评价研究. 新乡学院学报, 2019,36(1):12-18.
[
|
| [17] |
季丹. 中国区域生态效率评价: 基于生态足迹方法. 当代经济管理, 2013,35(2):57-62.
[
|
| [18] |
|
| [19] |
|
| [20] |
|
| [21] |
邓光耀, 张忠杰. 基于网络SBM-DEA模型和GML指数的中国各省工业用水效率研究. 自然资源学报, 2019,34(7):1457-1470.
[
|
| [22] |
李林泽, 李建松, 蒋子龙. 基于SBM-DEA模型的中部地区资源环境效率格局演化及成因机理分析. 长江流域与资源环境, 2017,26(11):1761-1773.
[
|
| [23] |
朴胜任, 李健. 基于超效率DEA模型的中国区域环境效率时空差异研究. 干旱区资源与环境, 2018,32(4):1-6.
[
|
| [24] |
张子龙, 逯承鹏, 陈兴鹏, 等. 中国城市环境绩效及其影响因素分析: 基于超效率DEA模型和面板回归分析. 干旱区资源与环境, 2015,29(6):1-7.
[
|
| [25] |
盖美, 连东, 田成诗, 等. 辽宁省环境效率及其时空分异. 地理研究, 2014,33(12):2345-2357.
[
|
| [26] |
黄永春, 石秋平. 中国区域环境效率与环境全要素的研究: 基于包含R&D投入的SBM模型的分析. 中国人口·资源与环境, 2015,25(12):25-34.
[
|
| [27] |
胡彪, 程达. 京津冀地区城市新陈代谢效率的时空格局演变研究. 现代城市研究, 2018, (6):37-43.
[
|
| [28] |
|
| [29] |
成刚. 数据包络分析方法与MaxDEA软件. 北京: 知识产权出版社, 2014.
[
|
| [30] |
|
| [31] |
|
| [32] |
杨勇, 邓祥征. 中国城市生态效率时空演变及影响因素的区域差异分析. 地理科学, 2019,39(7):1111-1118.
[
|
| [33] |
佟宝全, 包玉龙, 杨兵兵, 等. 锡林郭勒牧区聚落体系演化特征及其机制. 地理科学, 2018,38(3):410-418.
[
|
| [34] |
王兆峰, 刘庆芳. 长江经济带旅游生态效率时空演变及其与旅游经济互动响应. 自然资源学报, 2019,34(9):1945-1961.
[
|
| [35] |
汪杰, 李姣, 周翠烟, 等. 基于DEA-Tobit模型的湖南省环洞庭湖地区农业生态效率研究. 天津农业科学, 2019,25(12):48-55.
[
|
| [36] |
周亮, 车磊, 周成虎. 中国城市绿色发展效率时空演变特征及影响因素. 地理学报, 2019,74(10):2028-2044.
[
|
| [37] |
陈浩, 陈平, 罗艳. 基于超效率DEA模型的中国资源型城市生态效率评价. 大连理工大学学报: 社会科学版, 2015,36(2):34-40.
[
|
| [38] |
卢春天, 齐晓亮. 社会治理视域下当代中国环境政策演进及其治理逻辑. 河北学刊, 2020, (2):166-172.
[
|
| [39] |
孙佑海. 如何使环境法治真正管用: 环境法治40年回顾和建议. 环境保护, 2013,41(14):24-27.
[
|
| [40] |
黄和平, 李亚丽, 王智鹏. 基于Super-SBM模型的中国省域城市工业用地生态效率时空演变及影响因素研究. 生态学报, 2020,40(1):1-12.
[
|
/
| 〈 |
|
〉 |