
JOURNAL OF NATURAL RESOURCES >
Construction of ecological zone based on value-risk ecological function area in the Upper Yellow River
Received date: 2020-05-06
Request revised date: 2020-08-21
Online published: 2021-03-28
Copyright
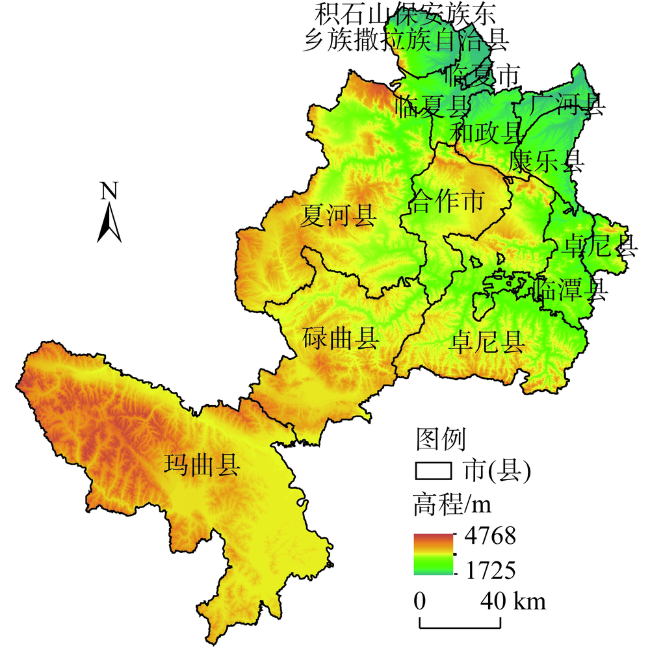
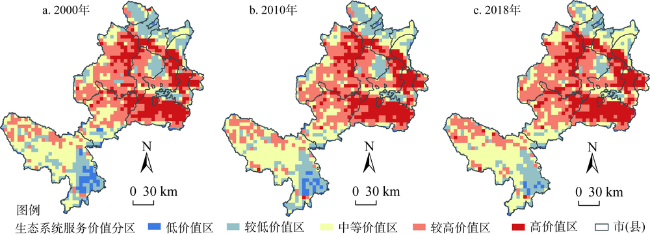
The ecological environment in the upper reaches of the Yellow River is fragile, and ecological and environmental problems such as soil erosion and land degradation continue to threaten the health of the ecosystem and the quality of human settlements. In order to explore the safety status of the ecological environment in the ecological function area in the upper reaches of the Yellow River, this article quantitatively analyzed the spatio-temporal distribution of ecosystem service value and ecological risk index based on land use data in 2000, 2010 and 2018, with the help of ecosystem service models and ecological risk models, and built four types of ecological divisions through z-score standardized methods. The results show that: (1) During the study period, various land use types changed to varying degrees. Among them, construction land increased most significantly due to the transfer of cultivated land and grassland, with an increase area of 118 km2 and a growth rate of 46.36%. (2) The overall service value of the study area has a small degree of change, the ecosystem services are mainly regulating services and the grassland provides the highest value. High service value areas are mainly distributed in areas with high vegetation coverage such as the southwestern part of Linxia prefecture and Zhuoni county. (3) The ecological risk level of the study area is generally low, showing the characteristics of "high in the north and south, but low in the middle". The low and low ecological risk areas account for more than 76% of the total area. (4) Little changes have taken place in the four types of ecological zoning, indicating that the ecological zoning is in a relatively stable state of development. The continuity of the spatial distribution of different ecological zones is poor, among which high ecosystem service value-high ecological risk area (I) is the most typical. Constructing ecological zoning through ecosystem services and ecological risks (value-risk) can provide a theoretical basis for coordinating the relationship between humans and land in the region and clarifying future development directions.
XIE Li-xia , BAI Yong-ping , CHE Lei , QIAO Fu-wei , SUN Shuai-shuai , YANG Xue-di . Construction of ecological zone based on value-risk ecological function area in the Upper Yellow River[J]. JOURNAL OF NATURAL RESOURCES, 2021 , 36(1) : 196 -207 . DOI: 10.31497/zrzyxb.20210113
表1 2000—2018年黄河上游生态功能区土地利用转移矩阵Table 1 Land use transfer matrix of the ecological function area in the Upper Yellow River from 2000 to 2018 (km2) |
| 土地利用类型 | 2018年土地利用面积 | ||||||
|---|---|---|---|---|---|---|---|
| 耕地 | 林地 | 草地 | 水域 | 建设用地 | 未利用地 | ||
| 2000年土地 利用面积 | 耕地 | 2114.14 | 150.45 | 435.33 | 23.84 | 164.63 | 4.88 |
| 林地 | 76.71 | 5673.69 | 1699.40 | 13.02 | 7.50 | 27.19 | |
| 草地 | 430.09 | 1700.33 | 17764.13 | 63.72 | 55.40 | 355.81 | |
| 水体 | 19.11 | 11.30 | 45.21 | 159.73 | 3.70 | 6.53 | |
| 建设用地 | 79.51 | 7.40 | 24.56 | 1.52 | 141.74 | 0.59 | |
| 未利用地 | 1.79 | 17.13 | 419.01 | 17.76 | 0.92 | 1873.29 | |
表2 不同土地利用类型生态系统服务价值及占比Table 2 Ecosystem service value and proportion of different land use types |
| 土地利用类型 | 2000年 | 2010年 | 2018年 | |||||
|---|---|---|---|---|---|---|---|---|
| ESV/万元 | 占比/% | ESV/万元 | 占比% | ESV/万元 | 占比/% | |||
| 耕地 | 2540.30 | 4.69 | 2435.63 | 4.48 | 2389.22 | 4.40 | ||
| 林地 | 23501.80 | 43.40 | 23630.93 | 43.43 | 23683.46 | 43.61 | ||
| 草地 | 26443.82 | 48.83 | 26365.92 | 48.45 | 26440.19 | 48.68 | ||
| 水体 | 1305.01 | 2.41 | 1622.96 | 2.98 | 1451.96 | 2.67 | ||
| 未利用地 | 359.22 | 0.66 | 358.22 | 0.66 | 348.58 | 0.64 | ||
| 供给服务 | 5057.63 | 9.12 | 5058.49 | 9.03 | 5058.49 | 9.07 | ||
| 调节服务 | 28695.17 | 51.74 | 29177.65 | 52.07 | 29177.65 | 52.32 | ||
| 支持服务 | 17638.66 | 31.81 | 17677.45 | 31.55 | 17677.45 | 31.70 | ||
| 文化服务 | 4064.53 | 7.33 | 4123.84 | 7.36 | 4123.84 | 7.39 | ||
表3 生态风险分级Table 3 Classification of ecological risks |
| 生态风险 | 风险水平 | ||||
|---|---|---|---|---|---|
| 低生态风险 | 较低生态风险 | 中等生态风险 | 较高生态风险 | 高生态风险 | |
| 等级 | I | II | III | IV | V |
| 生态风险值 | 0.15<ERI | 0.15≤ERI<0.25 | 0.25≤ERI<0.35 | 0.35≤ERI<0.45 | ERI ≥0.45 |
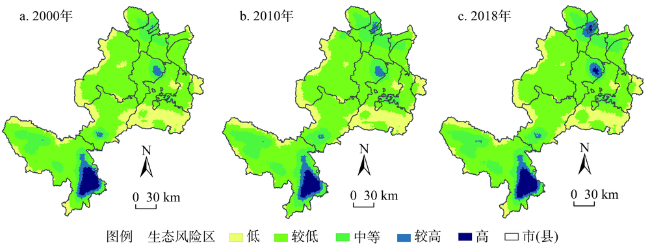
图3 黄河上游生态功能区生态风险等级分布Fig. 3 Distribution of ecological risk levels of ecological function area in the Upper Yellow River |
表4 黄河上游生态功能区生态风险等级面积及比例Table 4 Ecological risk grade area and proportion in ecological function area of the Upper Yellow River |
| 生态风险等级 | 2000年 | 2010年 | 2018年 | |||||
|---|---|---|---|---|---|---|---|---|
| 面积/km2 | 占比/% | 面积/km2 | 占比/% | 面积/km2 | 占比/% | |||
| 低生态风险区 | 10529.58 | 31.48 | 10263.95 | 30.69 | 8337.05 | 24.96 | ||
| 较低生态风险区 | 16421.78 | 49.10 | 16343.19 | 48.86 | 17310.04 | 51.81 | ||
| 中等生态风险区 | 4196.73 | 12.55 | 4390.99 | 13.13 | 4826.17 | 14.45 | ||
| 较高生态风险区 | 1145.84 | 3.43 | 1295.84 | 3.87 | 1614.42 | 4.83 | ||
| 高生态风险区 | 1154.88 | 3.45 | 1154.88 | 3.45 | 1319.76 | 3.95 | ||
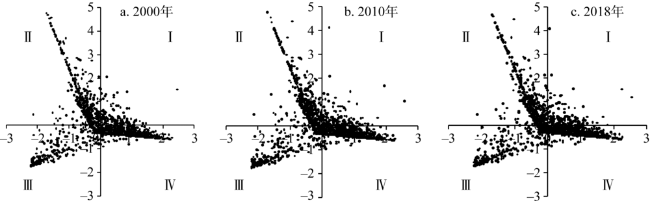
图4 黄河上游生态功能区生态分区象限分布Fig. 4 Quadrant distribution of ecological zones in the ecological function area of the Upper Yellow River |
表5 2000—2018年黄河上游生态功能区生态分区变化Table 5 Changes in ecological zones of ecological function areas in the Upper Yellow River from 2000 to 2018 |
| 象限 | 分区类型 | 总数/个 | 变化率/% | |||||
|---|---|---|---|---|---|---|---|---|
| 2000年 | 2010年 | 2018年 | 2000—2010年 | 2010—2018年 | 2000—2018年 | |||
| I | 高生态系统服务价值— 高生态风险区 | 121 | 138 | 135 | 14.05 | -2.14 | 11.57 | |
| II | 低生态系统服务价值— 高生态风险区 | 390 | 398 | 382 | 2.05 | -4.02 | -2.05 | |
| III | 低生态系统服务价值— 低生态风险区 | 336 | 327 | 350 | -2.68 | 7.03 | 4.17 | |
| IV | 高生态系统服务价值— 低生态风险区 | 675 | 659 | 655 | -2.37 | -0.61 | -2.96 | |
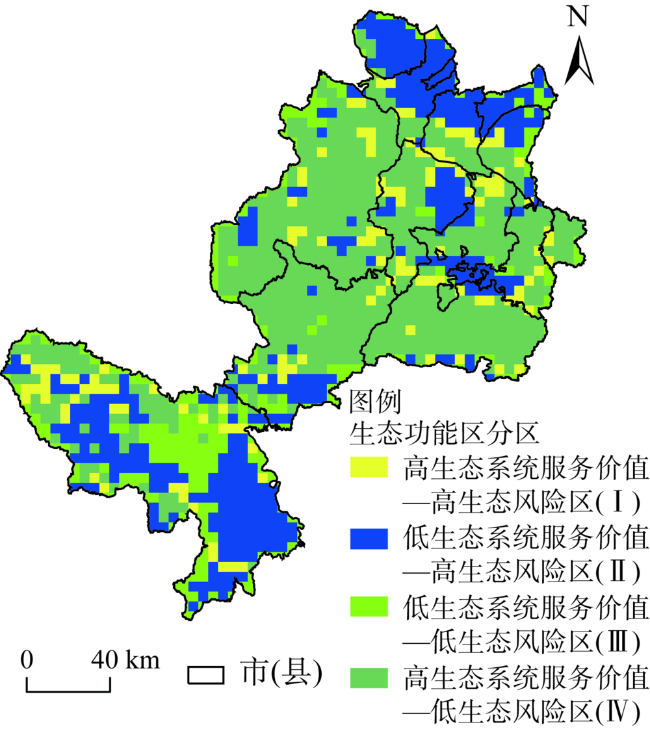
图5 黄河上游生态功能区生态分区Fig. 5 Ecological zoning of ecological function area in the Upper Yellow River |
表6 黄河上游生态功能区不同生态分区管理措施Table 6 Management measures of different ecological zones in the ecological function area of the Upper Yellow River |
| 象限 | 分区类型 | 主要分布地区 | 分区管理措施 |
|---|---|---|---|
| I | 高生态系统服务价值—高生态风险区 | 全区均有分布,呈较为分散状态 | 建立生态保护片区,通过就近原则责任到乡镇,落实生态环境保护政策的实施与生态环境修复责任;增加生态建设的资金与技术投入 |
| II | 低生态系统服务价值—高生态风险区 | 积石山县、临夏市、临夏县、广河县、合作市、临潭县、玛曲县 | 加大环境保护力度,禁止过度开发、严格执行环境保护政策,为经济发展创造良好的生态环境;城区增加绿化面积,提高人居环境质量;依据草场载畜量合理放牧 |
| III | 低生态系统服务价值—低生态风险区 | 玛曲县、黄河上游生态功能区周边地区 | 适度合理开发,增强耕地、林地、草地的利用率;开展生态旅游,提高经济发展水平;开展生态旅游 |
| IV | 高生态系统服务价值—低生态风险区 | 夏河县、卓尼县、碌曲县北部 | 保护原有景观,建立村镇一级的生态示范区 |
| [1] |
|
| [2] |
|
| [3] |
|
| [4] |
杜悦悦, 彭建, 赵士权, 等. 西南山地滑坡灾害生态风险评价: 以大理白族自治州为例. 地理学报, 2016,71(9):1544-1561.
[
|
| [5] |
肖武, 张文凯, 吕雪娇, 等. 西部生态脆弱区矿山不同开采强度下生态系统服务时空变化: 以神府矿区为例. 自然资源学报, 2020,35(1):68-81.
[
|
| [6] |
刘焱序, 王仰麟, 彭建, 等. 基于生态适应性循环三维框架的城市景观生态风险评价. 地理学报, 2015,70(7):1052-1067.
[
|
| [7] |
耿甜伟, 陈海, 张行, 等. 基于GWR的陕西省生态系统服务价值时空演变特征及影响因素分析. 自然资源学报, 2020,35(7):1714-1727.
[
|
| [8] |
|
| [9] |
|
| [10] |
康鹏, 陈卫平, 王美娥. 基于生态系统服务的生态风险评价研究进展. 生态学报, 2015,36(5):1192-1203.
[
|
| [11] |
曹祺文, 张曦文, 马洪坤, 等. 景观生态风险研究进展及基于生态系统服务的评价框架: ESRISK. 地理学报, 2018,73(5):843-855.
[
|
| [12] |
|
| [13] |
陈峰, 李红波, 张安录. 基于生态系统服务的中国陆地生态风险评价. 地理学报, 2019,74(3):26-39.
[
|
| [14] |
|
| [15] |
欧阳晓, 朱翔, 贺清云. 基于生态系统服务和生态系统健康的生态风险评价: 以长株潭城市群为例. 生态学报, 2020,40(16):1-12.
[
|
| [16] |
|
| [17] |
王慧芳, 林子雁, 肖燚, 等. 基于生态系统服务潜在损失的滑坡灾害生态风险评价. 应用生态学报, 2019,30(10):3553-3562.
[
|
| [18] |
|
| [19] |
李俊翰, 高明秀. 滨州市生态系统服务价值与生态风险时空演变及其关联性. 生态学报, 2019,39(21):7815-7828.
[
|
| [20] |
金凤君. 黄河流域生态保护与高质量发展的协调推进策略. 改革, 2019, (11):304-310.
[
|
| [21] |
乔旭宁, 王林峰, 牛海鹏, 等. 基于NPP数据的河南省淮河流域生态经济协调性分析. 经济地理, 2016,36(7):173-181.
[
|
| [22] |
朱会义, 孙明慧. 土地集约化研究的回顾与未来工作的重点. 地理学报, 2014,69(9):1346-1357.
[
|
| [23] |
陆大道. 关于黄河流域高质量发展的认识与建议. 中国科学报, 2019-12-10(7). http://news.sciencenet.cn/dz/dznews_photo.aspx?id=33727.
[
|
| [24] |
谢高地, 甄霖, 鲁春霞, 等. 一个基于专家知识的生态系统服务价值化方法. 自然资源学报, 2008,23(5):911-919.
[
|
| [25] |
王万同, 孙汀, 王金霞, 等. 基于多源遥感数据的区域生态系统服务价值年际动态监测: 以中原城市群为例. 地理科学, 2019,39(4):680-687.
[
|
| [26] |
徐羽, 钟业喜, 冯兴华, 等. 鄱阳湖流域土地利用生态风险格局. 生态学报, 2016,36(23):7850-7857.
[
|
| [27] |
白立敏, 修春亮, 冯兴华. 基于土地利用变化的长春市生态风险评价. 生态科学, 2019,38(3):26-35.
[
|
| [28] |
彭建, 杨旸, 谢盼, 等. 基于生态系统服务供需的广东省绿地生态网络建设分区. 生态学报, 2017,37(13):4562-4572.
[
|
/
| 〈 |
|
〉 |