
JOURNAL OF NATURAL RESOURCES >
The relationship between supply and demand of ecosystem services and its spatio-temporal variation in the Yellow River Basin
Received date: 2020-04-27
Request revised date: 2020-07-30
Online published: 2021-03-28
Copyright
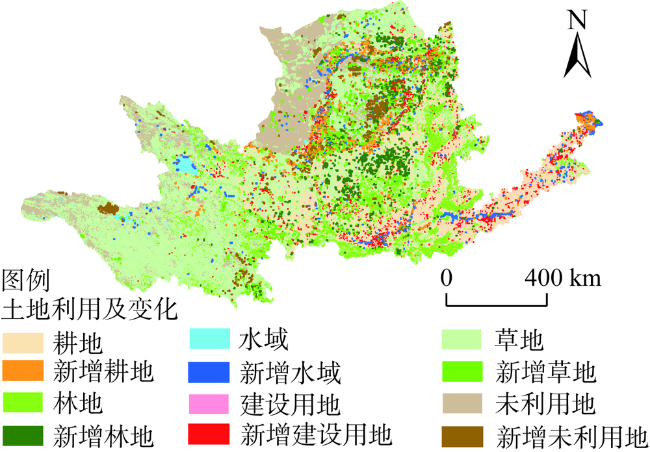
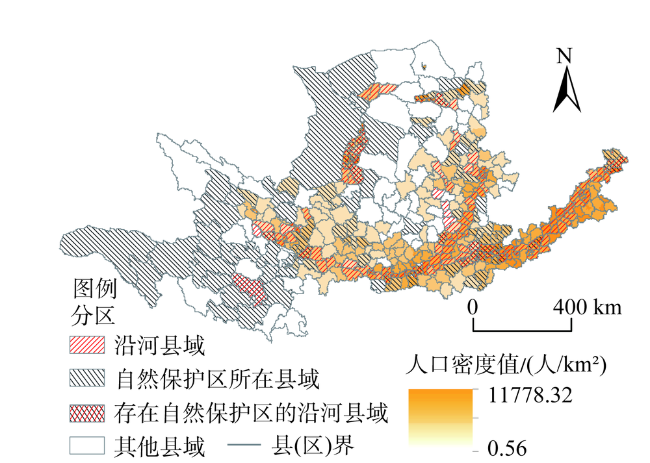
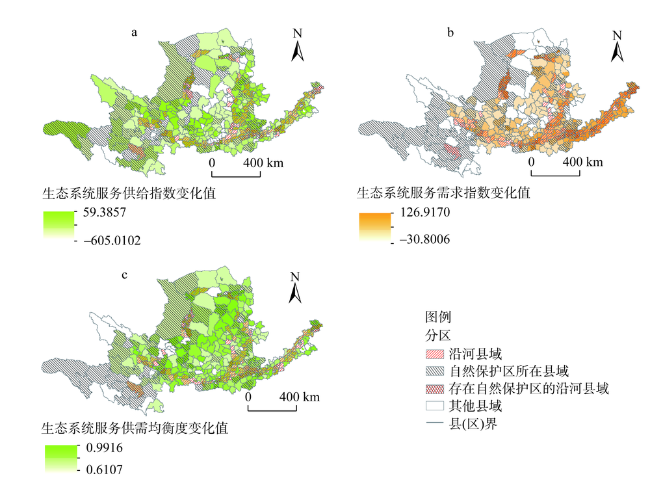
Based on the calculation of the ecosystem service supply, demand and coordination degree in the Yellow River Basin, we comprehensively analyzed the co-variation trend of land spatial pattern and coordination degree of supply-demand in this basin. Then, correlation analysis and quantile regression were used to analyze the influence of various land spaces on the coordination degree of supply-demand, and its regional heterogeneity. The results showed that: (1) Land spatial pattern, and supply and demand of ecosystem services showed significant spatio-temporal differentiation. The upper and middle reaches of the river and the lower reach are areas with densely distributed and significantly increased productive land and living land from 2000 to 2015. The increase in supply of ecosystem service was consistent with the distribution of cultivated land and forest land, and that in demand of ecosystem service was consistent with the distribution of population density and construction land. (2) The spatio-temporal change of the coordination degree was affected by the evolution of land spatial pattern. The influence of the land spaces on the coordination degree of supply and demand was different under different coordination levels, and there was significant regional heterogeneity in different regions. (3) According to different land spaces that had an impact on the coordination degree, different areas should rationally lay out land space and formulate development policies to promote effective ecosystem management.
LIU Jing-jing , WANG Jing , DAI Jian-wang , ZHAI Tian-lin , LI Ze-hui . The relationship between supply and demand of ecosystem services and its spatio-temporal variation in the Yellow River Basin[J]. JOURNAL OF NATURAL RESOURCES, 2021 , 36(1) : 148 -161 . DOI: 10.31497/zrzyxb.20210110
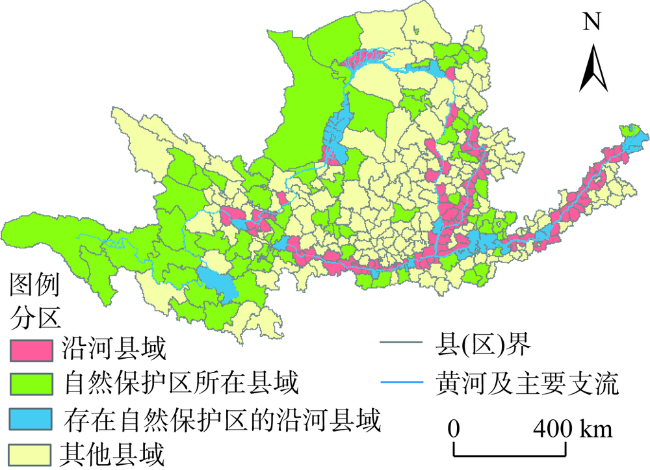
表1 2015年黄河流域不同区域的土地利用结构和社会经济指标Table 1 Land use structure and socio-economic indicators in different regions of the Yellow River Basin in 2015 (%) |
| 指标 | 黄河 流域 | 沿河 县域 | 自然保护区 所在县域 | 存在自然保护区 的沿河县域 | 其他 县域 | |
|---|---|---|---|---|---|---|
| 生活用地 | 城镇用地比例 | 0.98 | 2.85 | 0.53 | 2.00 | 0.92 |
| 农村居民点比例 | 2.12 | 5.42 | 1.03 | 3.55 | 2.33 | |
| 生产用地 | 铁路比例 | 9.44 | 10.46 | 6.90 | 7.32 | 11.60 |
| 公路比例 | 6.20 | 3.73 | 5.92 | 4.44 | 7.24 | |
| 采矿用地比例 | 0.07 | 0.15 | 0.04 | 0.13 | 0.07 | |
| 水浇地比例 | 6.13 | 20.48 | 2.81 | 10.84 | 5.41 | |
| 旱地比例 | 9.38 | 11.72 | 5.00 | 6.61 | 12.89 | |
| 果园比例 | 1.07 | 2.39 | 0.28 | 0.89 | 1.43 | |
| 生态用地 | 河流水面比例 | 0.50 | 1.20 | 0.42 | 1.23 | 0.45 |
| 天然草地比例 | 36.89 | 11.40 | 47.11 | 16.27 | 33.06 | |
| 有林地比例 | 9.44 | 10.46 | 7.36 | 14.65 | 11.60 | |
| 社会经济 | 人口比例 | 100 | 50.01 | 19.83 | 6.95 | 48.79 |
| GDP比例 | 100 | 51.98 | 22.90 | 8.11 | 46.32 | |
表2 2000—2015年黄河流域不同区域的生态系统服务供需Table 2 Ecosystem service supply and demand in different regions of the Yellow River Basin from 2000 to 2015 |
| 区域 | 供给指数 | 需求指数 | 供需均衡度 | |||||
|---|---|---|---|---|---|---|---|---|
| 2000年 | 2015年 | 2000年 | 2015年 | 2000年 | 2015年 | |||
| 黄河流域 | 27.76 | 28.70 | 3.92 | 9.18 | 0.47 | 0.56 | ||
| 沿河县域 | 23.95 | 27.12 | 4.22 | 9.33 | 0.63 | 0.72 | ||
| 自然保护区所在县域 | 26.88 | 30.85 | 2.89 | 4.68 | 0.34 | 0.45 | ||
| 存在自然保护区的沿河县域 | 22.87 | 25.99 | 3.67 | 6.84 | 0.61 | 0.72 | ||
| 其他县域 | 29.63 | 29.51 | 3.99 | 9.19 | 0.44 | 0.52 | ||
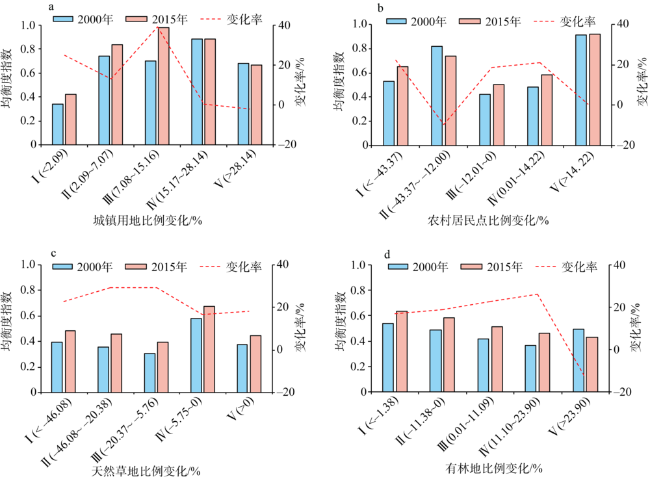
图5 2000—2015年不同用地比例下生态系统服务供需均衡度及其变化率Fig. 5 The coordination degree and change rate of supply-demand in the Yellow River Basin under different land use change ratios from 2000 to 2015 |
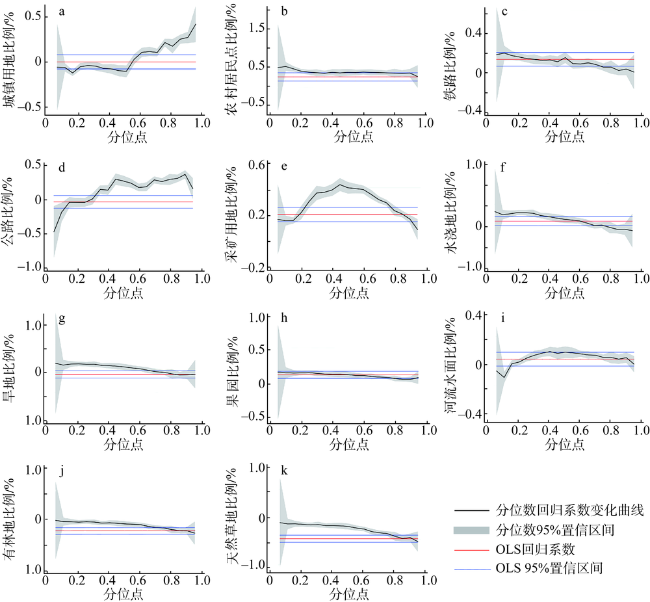
表3 黄河流域不同生态系统服务供需均衡度水平下各类用地比例的分位数估计结果Table 3 Elasticity coefficients of the proportion of various types of land space under different coordination degrees of supply-demand using quantile regression estimates in the Yellow River Basin |
| 解释变量 | OLS | 分位点 | |||||
|---|---|---|---|---|---|---|---|
| 0.1 | 0.3 | 0.5 | 0.7 | 0.9 | |||
| 截距项 | -2.22 (-1.09) | -0.569*** (-12.02) | -0.281** (-8.46) | 0.0223 (0.79) | 0.0868** (2.16) | 0.487*** (15.30) | |
| 生活用地 | 城镇用地比例 | -0.018 (-0.45) | -0.0811 (-1.09) | -0.0654 (-1.63) | -0.124*** (-3.22) | 0.0868** (2.16) | 0.257*** (5.10) |
| 农村居民点比例 | 0.298*** (5.01) | 0.595*** (5.44) | 0.416*** (7.05) | 0.429*** (7.55) | 0.422*** (7.13) | 0.409*** (5.52) | |
| 生产用地 | 铁路比例 | 0.111*** (3.21) | 0.175*** (2.74) | 0.111*** (3.23) | 0.129*** (-0.35) | 0.0600* (1.74) | 0.0137 (0.32) |
| 公路比例 | -0.077 (-1.65) | -0.225*** (-2.62) | -0.0341 (-0.74) | 0.224*** (5.02) | 0.239*** (5.16) | 0.319*** (5.49) | |
| 采矿用地比例 | 0.197*** (7.26) | 0.151*** (3.04) | 0.360*** (13.39) | 0.400*** (15.46) | 0.310*** (11.50) | 0.163*** (4.84) | |
| 水浇地比例 | 0.088 (1.58) | 0.245** (2.40) | 0.280*** (5.07) | 0.137** (2.57) | -0.0159 (-0.29) | -0.108 (-1.56) | |
| 旱地比例 | -0.125*** (-3.28) | 0.0694 (0.99) | 0.0869** (2.31) | 0.0279 (0.77) | -0.0690* (-1.83) | -0.133*** (-2.81) | |
| 果园比例 | 0.108*** (4.08) | 0.138*** (2.83) | 0.128*** (4.89) | 0.111*** (4.38) | 0.0740*** (2.82) | 0.0409 (1.24) | |
| 生态用地 | 河流水面比例 | 0.014 (0.49) | -0.137** (-2.57) | 0.0465 (1.62) | 0.0710** (2.57) | 0.0457 (1.59) | 0.0260 (0.72) |
| 天然草地比例 | -0.481*** (-13.58) | -0.188*** (-2.89) | -0.201*** (-5.72) | -0.242*** (-7.15) | -0.364*** (-10.34) | -0.459*** (-10.43) | |
| 有林地比例 | -0.255*** (-8.23) | -0.0760 (-1.22) | -0.0858*** (-2.79) | -0.121*** (-4.10) | -0.192*** (-8.07) | -0.254*** (-12.16) | |
注:*、**、***分别表示10%、5%、1%的显著性水平,括号内为t检验结果,下同。 |
表4 黄河流域各区域生态系统服务供需均衡度与各类用地比例回归结果Table 4 Regression results of the coordination degree of supply-demand, and the proportion of various types of land space in different regions of the Yellow River Basin |
| 解释变量 | 沿河县域 | 自然保护区所在县域 | 存在自然保护区的沿河县域 | 其他县域 | |
|---|---|---|---|---|---|
| R2 | 0.4556 | 0.7763 | 0.8550 | 0.5787 | |
| 生活 用地 | 城镇用地比例 | -0.286*** | 0.289*** | 0.528* | -0.022 |
| 农村居民点比例 | 0.060 | 0.365*** | 1.121*** | 0.142** | |
| 生产 用地 | 铁路比例 | -0.315*** | -0.213*** | 0.157 | 0 |
| 公路比例 | 0.345*** | -0.136 | 0.110 | -0.298*** | |
| 采矿用地比例 | 0.145* | -0.068 | -0.526 | 0.019 | |
| 水浇地比例 | 0.3500 | -0.021 | -0.525 | 0.246** | |
| 旱地比例 | -0.321* | -0.115 | -0.609** | -0.097 | |
| 果园比例 | 0.182 | 0.138 | 0.276 | 0.178** | |
| 生态 用地 | 河流水面比例 | 0.192*** | 0.154*** | -0.206 | -0.170*** |
| 天然草地比例 | -0.515*** | -0.478*** | -0.462*** | -0.176 | |
| 有林地比例 | 0 | -0.014 | -0.770 | -0.183* | |
| [1] |
|
| [2] |
马琳, 刘浩, 彭建, 等. 生态系统服务供给和需求研究进展. 地理学报, 2017,72(7):1277-1289.
[
|
| [3] |
李文华, 张彪, 谢高地. 中国生态系统服务研究的回顾与展望. 自然资源学报, 2009,24(1):1-10.
[
|
| [4] |
欧维新, 王宏宁, 陶宇. 基于土地利用与土地覆被的长三角生态系统服务供需空间格局及热点区变化. 生态学报, 2018,38(17):359-369.
[
|
| [5] |
张宇硕, 吴殿廷, 吕晓. 土地利用/覆盖变化对生态系统服务的影响: 空间尺度视角的研究综述. 自然资源学报, 2020,35(5):1172-1189.
[
|
| [6] |
翟天林, 王静, 金志丰, 等. 长江经济带生态系统服务供需格局变化与关联性分析. 生态学报, 2019,39(15):5414-5424.
[
|
| [7] |
谢余初, 张素欣, 林冰, 等. 基于生态系统服务供需关系的广西县域国土生态修复空间分区. 自然资源学报, 2020,35(1):217-229.
[
|
| [8] |
|
| [9] |
赵文武, 刘月, 冯强, 等. 人地系统耦合框架下的生态系统服务. 地理科学进展, 2018,37(1):139-151.
[
|
| [10] |
杨莉, 甄霖, 潘影, 等. 生态系统服务供给—消费研究: 黄河流域案例. 干旱区资源与环境, 2012,26(3):131-138.
[
|
| [11] |
|
| [12] |
|
| [13] |
|
| [14] |
|
| [15] |
彭建, 杨旸, 谢盼, 等. 基于生态系统服务供需的广东省绿地生态网络建设分区. 生态学报, 2017,37(13):4562-4572.
[
|
| [16] |
|
| [17] |
李雪铭, 夏春光, 张英佳. 近10年来我国地理学视角的人居环境研究. 城市发展研究, 2014,21(2):6-13.
[
|
| [18] |
吴良镛. 人居环境导论. 北京: 中国建筑工业出版社, 2001.
[
|
| [19] |
|
| [20] |
|
| [21] |
|
| [22] |
|
| [23] |
|
| [24] |
管青春, 郝晋珉, 许月卿, 等. 基于生态系统服务供需关系的农业生态管理分区. 资源科学, 2019,41(7):1359-1373.
[
|
| [25] |
罗辉. 自然保护区周边社区经济可持续发展路径研究: 以云南省为例. 昆明: 云南大学, 2015.
[
|
| [26] |
|
| [27] |
|
| [28] |
鲁含情, 朱丽霞, 王宏志, 等. 仙桃市农村居民点分布与人居环境研究. 湖北大学学报: 自然科学版, 2014,36(5):406-413.
[
|
| [29] |
王深法, 沈兵明. 从德清县易地建城得失谈人居环境与土地资源配置优化. 经济地理, 2002,22(2):204-207.
[
|
| [30] |
王勇. 土地利用结构变化及其对人居环境的影响研究: 以大连市为例. 大连: 辽宁师范大学, 2015.
[
|
| [31] |
|
| [32] |
张鹏岩, 李颜颜, 康国华, 等. 黄河流域县域经济密度测算及空间分异研究. 中国人口·资源与环境, 2017,27(8):128-135.
[
|
| [33] |
|
| [34] |
王静. 土地生态管护研究范式及其应用. 北京: 地质出版社, 2015.
[
|
| [35] |
覃成林, 周二黑. 黄河流域经济空间分异格局研究. 河南大学学报: 自然科学版, 2010,40(1):40-44.
[
|
| [36] |
李征. 黄河流域主体功能区划研究. 开封: 河南大学, 2009.
[
|
| [37] |
黄麟, 翟俊, 宁佳. 不同气候带退耕还林对区域气温的影响差异分析. 自然资源学报, 2017,32(11):1832-1843.
[
|
/
| 〈 |
|
〉 |