
JOURNAL OF NATURAL RESOURCES >
Characteristics of extreme precipitation over the Qinghai-Tibet Plateau from 1961 to 2017
Received date: 2019-06-05
Request revised date: 2019-11-05
Online published: 2020-12-18
Copyright
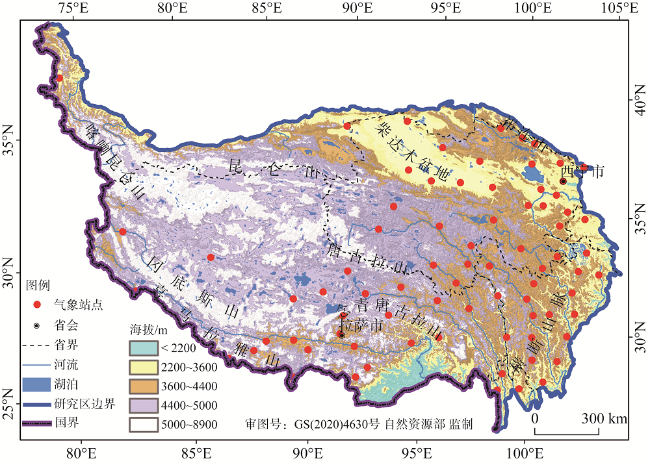
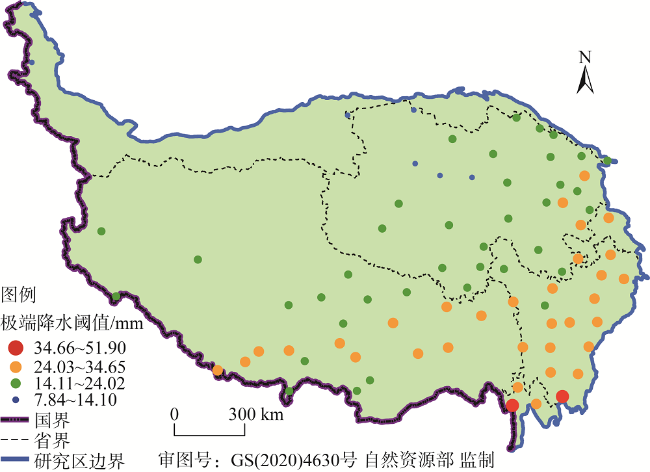
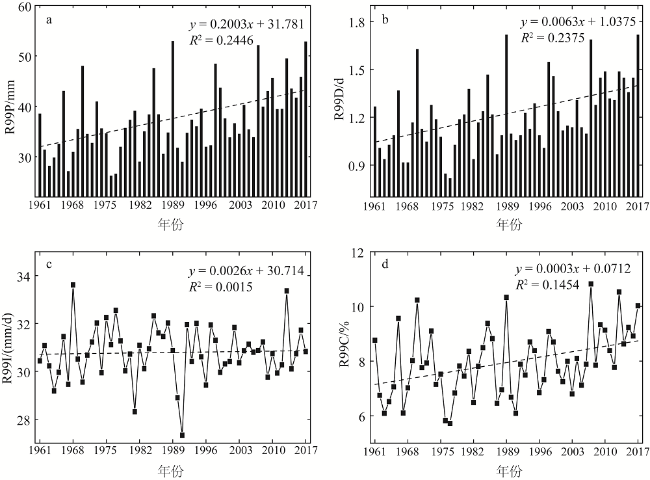
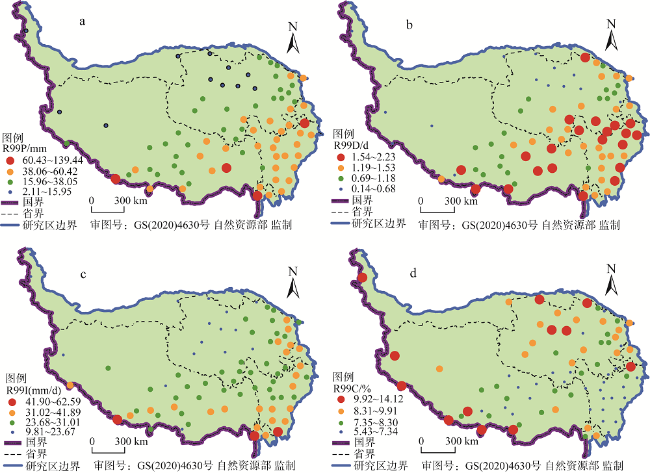
Using the daily precipitation data of the long-term series of meteorological stations on the Qinghai-Tibet Plateau, the percentile threshold method is used to determine the extreme precipitation threshold, calculate the extreme precipitation index and analyze its spatial and temporal distribution characteristics, in order to provide reference for regional climate change prediction and disaster prevention and mitigation countermeasures. The results show that: (1) From 1961 to 2017, the annual precipitation of Qinghai-Tibet Plateau showed an upward trend, with a rate of 8.06 mm/10 a, and the average annual precipitation reached 472.36 mm. The minimum precipitation tendency rate of 78 stations is -25.46 mm/10 a, and the maximum value is 43.02 mm/10 a. The precipitation of 15.38% of the stations is decreasing, which is mainly distributed in the east and south of the plateau, and the precipitation of the remaining 84.62% of the stations is increasing. (2) The average threshold value of extreme precipitation in the Qinghai-Tibet Plateau is 23.11 mm, with error values ranging from 7.84 mm to 51.90 mm. The high value centers are located in Gongshan and Muli of Hengduan Mountains, while the low value centers are located in the northern flank of Qaidam Basin and Kunlun Mountains. (3) The extreme precipitation, the number of days of extreme precipitation and the contribution rate of extreme precipitation at all the stations in the Qinghai-Tibet Plateau show an obvious upward trend. Although the intensity of extreme precipitation is also rising, the trend is not obvious, which shows that the increase of extreme precipitation in the plateau is not caused by the intensity of extreme precipitation, but by the increase of the frequency of extreme precipitation. Although the extreme precipitation and days of extreme precipitation in the Qaidam Basin do not show a high value level, the contribution rate of extreme precipitation is larger, which suggests that although there is less precipitation, extreme precipitation events frequently occur in this area.
Key words: Qinghai-Tibet Plateau; climate change; extreme precipitation; threshold
MA Wei-dong , LIU Feng-gui , ZHOU Qiang , CHEN Qiong , LIU Fei , CHEN Yong-ping . Characteristics of extreme precipitation over the Qinghai-Tibet Plateau from 1961 to 2017[J]. JOURNAL OF NATURAL RESOURCES, 2020 , 35(12) : 3039 -3050 . DOI: 10.31497/zrzyxb.20201218
表1 极端降水指数及其缩写和定义Table 1 Extreme precipitation index and its abbreviation and definition |
| 指数 | 缩写 | 定义 | 单位 |
|---|---|---|---|
| 极端降水量 | R99P | 全年日降水量大于第99个百分位值的降水总和 | mm |
| 极端降水频次 | R99D | 全年日降水量大于第99个百分位值的频次的总和 | d |
| 极端降水强度 | R99I | 站点R99P与R99D的比值 | mm/d |
| 极端降水贡献率 | R99C | R99P占全年降水总量的百分比 | % |
| [1] |
方建, 杜鹃, 徐伟, 等. 气候变化对洪水灾害影响研究进展. 地球科学进展, 2014,29(9):1085-1093.
[
|
| [2] |
IPCC. Climate Change 2013: The Physical Science Basis. http://www.ipcc.ch.
|
| [3] |
史培军, 应卓蓉. 中国气象灾害对宏观经济增长的影响分析. 北京师范大学学报: 自然科学版, 2016,52(6):747-753.
[
|
| [4] |
联合国教科文组织. 国际水文计划第七阶段规划. 2007.
[ United Nations Education Scientific and Cultural Organization. Phase VII Planning of the International Hydrological Plan . 2007.]
|
| [5] |
联合国教科文组织. 国际水文计划第八阶段规划. 2013.
[ United Nations Education Scientific and Cultural Organization. Phase VII Planning of the International Hydrological Plan 2013.]
|
| [6] |
史培军, 孔锋. 1951—2010年中国年代际累积暴雨时空格局变化的相关因素研究. 地理科学, 2016,36(10):1457-1465.
[
|
| [7] |
中华人民共和国水利部. 中国水旱灾害公报2011. 北京: 中国水利水电出版社, 2012.
[ Ministry of Water Resources of the People's Republic of China. China Flood and Drought Disaster Bulletin 2011. Beijing: China Water Conservancy and Hydropower Press, 2012.]
|
| [8] |
|
| [9] |
|
| [10] |
|
| [11] |
|
| [12] |
|
| [13] |
|
| [14] |
|
| [15] |
杨金虎, 江志红, 王鹏祥, 等. 中国年极端降水事件的时空分布特征. 气候与环境研究, 2008,13(1):75-83.
[
|
| [16] |
武文博, 游庆龙, 王岱. 基于均一化降水资料的中国极端降水特征分析. 自然资源学报, 2016,31(6):1015-1026.
[
|
| [17] |
景丞, 陶辉, 王艳君, 等. 基于区域气候模式CCLM的中国极端降水事件预估. 自然资源学报, 2017,32(2):266-277.
[
|
| [18] |
江志红, 陈威霖, 宋洁, 等. 7个IPCC AR4模式对中国地区极端降水指数模拟能力的评估及其未来情景预估. 大气科学, 2009,33(1):109-120.
[
|
| [19] |
宁亮, 钱永甫. 中国年和季各等级日降水量的变化趋势分析. 高原气象, 2008,27(5):1010-1020.
[
|
| [20] |
袁文德, 郑江坤. 1962—2012年西南地区极端温度事件时空变化特征. 长江流域资源与环境, 2015,24(7):1246-1254.
[
|
| [21] |
任朝霞, 杨达源. 近40 a西北干旱区极端气候变化趋势研究. 干旱区资源与环境, 2007,21(4):10-13.
[
|
| [22] |
任正果, 张明军, 王圣杰, 等. 1961—2011年中国南方地区极端降水事件变化(英文). Journal of Geographical Sciences, 2015,25(1):58-68.
[
|
| [23] |
赵安周, 朱秀芳, 潘耀忠. 1965—2013年黄土高原地区极端降水事件时空变化特征. 北京师范大学学报: 自然科学版, 2017,53(1):43-50.
[
|
| [24] |
游庆龙, 康世昌, 闫宇平, 等. 近45年雅鲁藏布江流域极端气候事件趋势分析. 地理学报, 2009,64(5):592-600.
[
|
| [25] |
杜军, 路红亚, 建军. 1961—2012年西藏极端降水事件的变化. 自然资源学报, 2014,29(6):990-1002.
[
|
| [26] |
赵雪雁, 王亚茹, 张钦, 等. 近50 a青藏高原东部夏半年强降水事件的气候特征. 干旱区地理, 2015,38(4):675-683.
[
|
| [27] |
曹瑜, 游庆龙, 马茜蓉. 青藏高原中东部夏季极端降水年代际变化特征. 气象科学, 2019,39(4):437-445.
[
|
| [28] |
崔鹏, 苏凤环, 邹强, 等. 青藏高原山地灾害和气象灾害风险评估与减灾对策. 科学通报, 2015,60(32):3067-3077.
[
|
| [29] |
高懋芳, 邱建军. 青藏高原主要自然灾害特点及分布规律研究. 干旱区资源与环境, 2011,25(8):101-106.
[
|
| [30] |
张镱锂, 李炳元, 郑度. 论青藏高原范围与面积. 地理研究, 2002,21(1):1-8.
[
|
| [31] |
王莘, 温克刚. 中国气象灾害大典(青海卷). 北京: 气象出版社, 2007: 32-121.
[
|
| [32] |
刘光轩, 温克刚. 中国气象灾害大典(西藏卷). 北京: 气象出版社, 2008: 108-150.
[
|
| [33] |
史玉光, 温克刚. 中国气象灾害大典(新疆卷). 北京: 气象出版社, 2006: 88-124.
[
|
| [34] |
董安祥, 温克刚. 中国气象灾害大典(甘肃卷). 北京: 气象出版社, 2005: 220-234.
[
|
| [35] |
詹兆渝, 温克刚. 中国气象灾害大典(四川卷). 北京: 气象出版社, 2006: 64-207.
[
|
| [36] |
刘建华, 温克刚. 中国气象灾害大典(云南卷). 北京: 气象出版社, 2006: 172-316.
|
| [37] |
《青海自然灾害》编委会. 青海自然灾害. 青海: 青海人民出版社, 2003: 26-29.
[ Editorial Board of Qinghai Natural Disasters. Qinghai Natural Disasters. Qinghai: Qinghai People's Publishing House, 2003: 26-29.]
|
| [38] |
魏凤英. 现代气候统计诊断与预测技术. 北京: 气象出版社, 2007: 37-39.
[
|
| [39] |
翟盘茂, 潘晓华. 中国北方近50年温度和降水极端事件变化. 地理学报, 2003,58(s1):1-10.
[
|
| [40] |
翟盘茂, 王萃萃, 李威. 极端降水事件变化的观测研究. 气候变化研究进展, 2007,3(3):144-148.
[
|
| [41] |
杨志刚, 杜军, 刘玲, 等. 西藏自治区(1961—2008年)气象灾害气候图集. 北京: 气象出版社, 2011: 1-2.
[
|
| [42] |
马伟东. 青藏高原极端降水特征及洪涝灾害临界雨量估算. 西宁: 青海师范大学, 2019.
[
|
/
| 〈 |
|
〉 |


