
JOURNAL OF NATURAL RESOURCES >
The influence mechanism of poverty spatial differentiation in Western Anhui province
Received date: 2019-05-14
Request revised date: 2019-11-02
Online published: 2021-02-28
Copyright
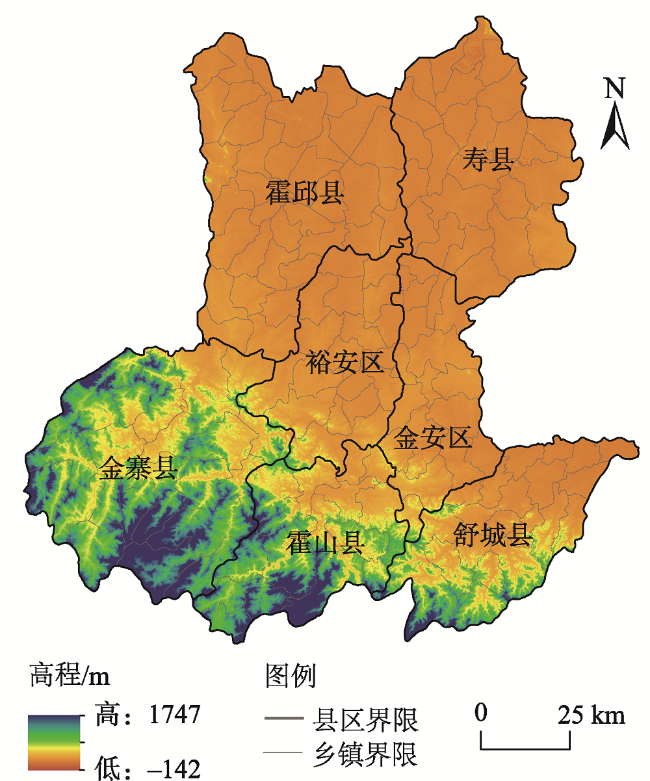
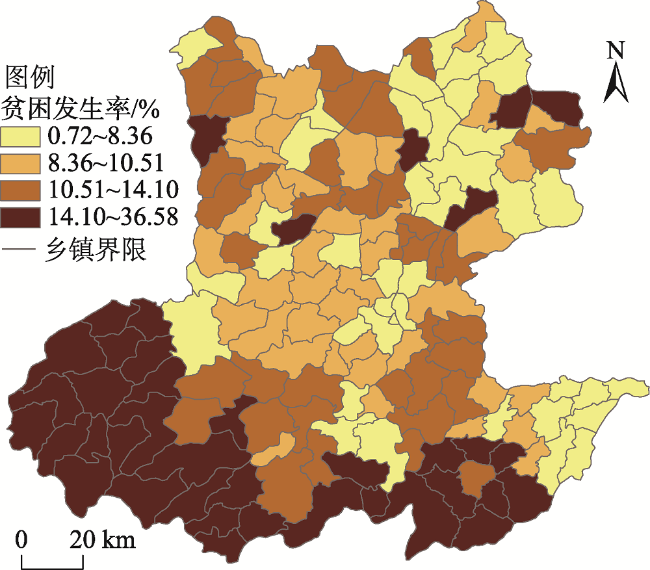
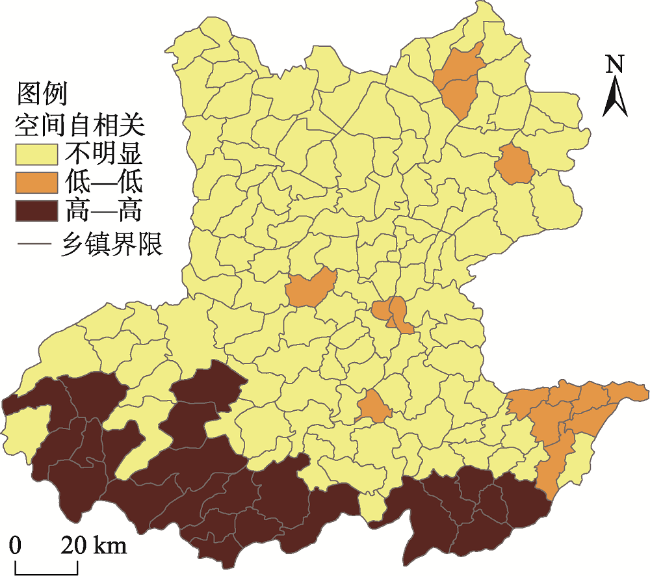
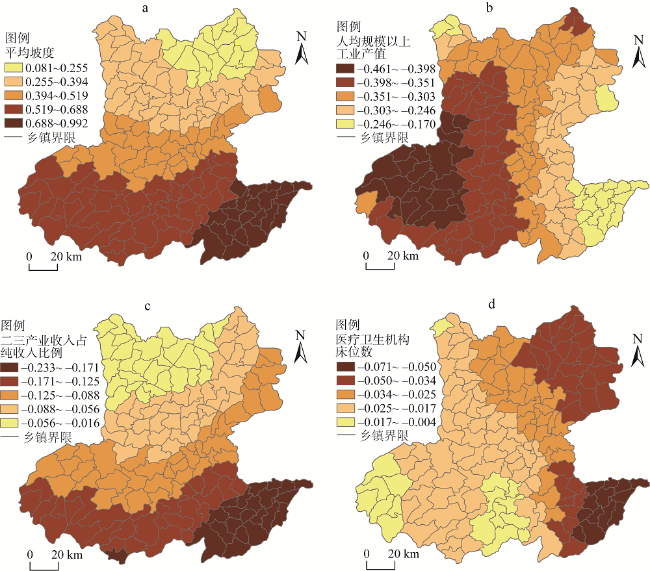
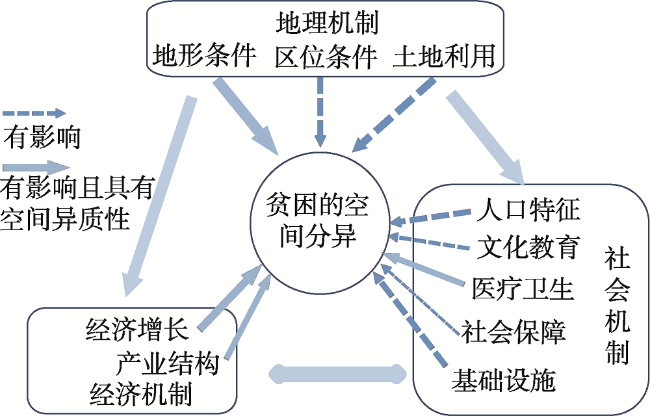
Regional poverty has become the core problem of urban-rural development and income distribution imbalance in China. Taking the Western Anhui area of Dabie Mountains as a case study, based on the spatial heterogeneity pattern and dependence pattern of poverty on the township scale, selecting 20 factors from three dimensions of geographical environment, economic environment and social environment, this paper explores the influence of various factors on poverty spatial differentiation through analysis of correlation, multivariate linear regression, spatial regression and geographical weighted regression. The results show that: First, the basic pattern of spatial differentiation of poverty in Western Anhui shows that the poverty rate in the southwest and south parts of the study area is high, while that in the central and northeast regions is relatively low. The spatial dependence of poverty in Western Anhui is strong. Secondly, the results of Pearson correlation analysis show that the geographical environment, economic environment and social environment are the important factors that affect the spatial differentiation of poverty. Spatial regression and GWR regression analyses show that the average slope, the gross national product per capita of above-scale industries, the proportion of income derived from the secondary and tertiary industries to the net income, the number of beds in medical and health institutions are the core factors leading to the spatial differentiation of poverty, and their influence has strong spatial heterogeneity. Finally, geographical mechanism, economic mechanism and social mechanism are the three mechanisms of poverty spatial differentiation. The geographical environment plays a fundamental role in the formation of spatial differentiation of poverty, whose impact is profound and extensive. The economic environment and social environment, controlled by the geographical environment, affect each other. These two factors are not only an important manifestation of poverty, but also related with poverty. The results of this study can be used for reference to the geographical aim of poverty intervention.
ZHAO Chun-yu , WEN Rui-xia , YANG Na . The influence mechanism of poverty spatial differentiation in Western Anhui province[J]. JOURNAL OF NATURAL RESOURCES, 2020 , 35(12) : 2916 -2928 . DOI: 10.31497/zrzyxb.20201208
表1 皖西地区贫困空间分异的影响因素指标体系Table 1 The index system of the factors influencing poverty spatial differentiation in Western Anhui province |
| 维度 | 指标分类 | 指标名称及编号 | 数据来源 |
|---|---|---|---|
| 地理 环境 | 地形条件 | 平均海拔(X1)、平均坡度(X2) | 地理空间数据云网站下载并提取 |
| 区位条件 | 路网密度(X3) | 路网(包括高速、国道、省道、县道、乡镇村道)长度与面积的比值 | |
| 干线路网衔接性(X4) | 各乡镇政府所在地到相应干线(包括国道、省道、高速公路)的距离 | ||
| 土地利用 | 耕地面积比例(X5)、建设用地面积比例(X6) | 根据六安市国土资源局和寿县国土资源局提供数据计算 | |
| 经济 环境 | 经济增长 | 人均农业总产值(X7) | 根据各县(区)统计局提供数据计算 |
| 人均规模以上工业总产值(X8) | |||
| 产业结构 | 二三产业从业人员比例(X9) | 根据《中国县域统计年鉴(乡镇卷)》(2016年)数据计算 | |
| 二三产业收入占纯收入比例(X10) | 根据各县(区)统计局提供数据计算 | ||
| 社会 环境 | 人口特征 | 乡村人口比例(X11)、人口迁入率(X12) | 根据各县(区)公安局提供数据计算 |
| 文化教育 | 普通中学在校学生比例(X13) | 根据各县(区)教育局提供数据计算 | |
| 自然村到中心中学的平均距离(X14) | ArcGIS软件中的临近度分析工具计算 | ||
| 医疗卫生 | 医疗卫生机构床位数(X15) | 各县(区)卫计委提供 | |
| 自然村到中心医院的平均距离(X16) | ArcGIS软件中的临近度分析工具计算 | ||
| 社会保障 | 城乡居民养老保险覆盖率(X17) | 根据各县(区)人社局提供数据计算 | |
| 城乡居民医疗保险参保率(X18) | |||
| 基础设施 | 通宽带村数(X19) | 各县(区)统计局提供 | |
| 商业设施的核密度(X20) | ArcGIS软件中核密度估计法计算 |
表2 Pearson相关分析结果Table 2 Results of Pearson correlation analysis |
| X | 相关系数r | 显著性水平t | X | 相关系数r | 显著性水平t | ||
|---|---|---|---|---|---|---|---|
| 地理 环境 维度 | X1 | 0.631** | 0.000 | 社会 环境 维度 | X11 | 0.348** | 0.000 |
| X2 | 0.648** | 0.000 | X12 | -0.257** | 0.001 | ||
| X3 | -0.392** | 0.000 | X13 | -0.254** | 0.001 | ||
| X4 | 0.104 | 0.192 | X14 | 0.287** | 0.001 | ||
| X5 | -0.427** | 0.000 | X15 | -0.358** | 0.000 | ||
| X6 | -0.470** | 0.000 | X16 | 0.259** | 0.001 | ||
| 经济 环境 维度 | X7 | -0.140 | 0.079 | X17 | 0.007 | 0.932 | |
| X8 | -0.311** | 0.000 | X18 | 0.281** | 0.000 | ||
| X9 | -0.172* | 0.030 | X19 | -0.227** | 0.004 | ||
| X10 | -0.307** | 0.000 | X20 | -0.355** | 0.000 |
注:*、**分别表示相关系数的显著性水平为0.05、0.01。 |
表3 OLS回归分析结果Table 3 Results of OLS regression analysis |
| 解释变量 | 非标准化 系数 | 标准 误差 | 标准化 系数 | T | 显著性 | VIF | |
|---|---|---|---|---|---|---|---|
| 常数 | 15.917 | 1.710 | — | 9.310 | 0.000 | — | R2 (0.550) 调整后R2 (0.538) Durbin-Watson (1.993) F统计量 (46.772) 显著性 (0.000) |
| 平均坡度(X2) | 0.553 | 0.057 | 0.549 | 9.627 | 0.000 | 1.108 | |
| 人均规模以上工业总产值(X8) | -0.408 | 0.100 | -0.225 | -4.086 | 0.000 | 1.028 | |
| 二三产业收入占纯收入比例(X10) | -0.084 | 0.025 | -0.187 | -3.385 | 0.001 | 1.042 | |
| 医疗卫生机构床位数(X15) | -0.033 | 0.010 | -0.187 | -3.304 | 0.001 | 1.084 |
表4 空间误差模型拟合结果Table 4 Fitting results of spatial error model |
| 解释变量 | 系数 | 标准误差 | z值 | P值 | |
|---|---|---|---|---|---|
| 常数 | 15.893 | 1.719 | 9.243 | 0.000 | 判定系数 (0.622) 对数似然值 (-427.103) 赤池信息准则 (864.205) 施瓦兹准则 (879.518) |
| 平均坡度(X2) | 0.567 | 0.080 | 7.113 | 0.000 | |
| 人均规模以上工业总产值(X8) | -0.314 | 0.094 | -3.334 | 0.001 | |
| 二三产业收入占纯收入比例(X10) | -0.095 | 0.025 | -3.750 | 0.000 | |
| 医疗卫生机构床位数(X15) | -0.026 | 0.009 | -2.993 | 0.003 | |
| LAMBDA | 0.461 | 0.091 | 5.089 | 0.000 |
| [1] |
国家统计局. 扶贫开发成就举世瞩目, 脱贫攻坚取得决定性进展: 改革开放40年经济社会发展成就系列报告之五. http://www.stats.gov.cn/ztjc/ztfx/ggkf40n/201809/t20180903_1620407.html, 2018-09-03.
[ National Bureau of Statistics. The achievements in poverty alleviation and development have attracted worldwide attention, and decisive progress has been made in poverty alleviation. Report No. 5 of the Series on Achievements of Economic and Social Development in the Past 40 Years of Reform and Opening. http://www.stats.gov.cn/ztjc/ztfx/ggkf40n/201809/t20180903_1620407.html, 2018-09-03.]
|
| [2] |
王丽华. 基于地缘性贫困的农村扶贫政策分析: 以湘西八个贫困县为例. 农业经济问题, 2011, (6):47-53.
[
|
| [3] |
|
| [4] |
沈扬扬. 经济增长与不平等对农村贫困的影响. 数量经济技术经济研究, 2012, (8):19-34.
[
|
| [5] |
何仁伟, 刘邵权, 陈国阶, 等. 中国农户可持续生计研究进展及趋向. 地理科学进展, 2013,32(4):657-670.
[
|
| [6] |
|
| [7] |
|
| [8] |
|
| [9] |
刘七军, 李昭楠. 地理资本视阈下西北民族地区贫困问题实证研究: 以宁夏为例. 兰州学刊, 2015, (1):167-172.
[
|
| [10] |
刘小鹏, 苏晓芳, 王亚娟, 等. 空间贫困研究及其对我国贫困地理研究的启示. 干旱区地理, 2014,37(1):144-152.
[
|
| [11] |
|
| [12] |
|
| [13] |
|
| [14] |
|
| [15] |
刘艳华, 徐勇. 中国农村多维贫困地理识别及类型划分. 地理学报, 2015,70(6):993-1007.
[
|
| [16] |
刘小鹏, 李永红, 王亚娟, 等. 县域空间贫困的地理识别研究: 以宁夏泾源县为例. 地理学报, 2017,72(3):545-557.
[
|
| [17] |
|
| [18] |
|
| [19] |
|
| [20] |
|
| [21] |
沈红. 中国贫困研究的社会学评述. 社会学研究, 2000, (2):91-103.
[
|
| [22] |
何仁伟. 中国农村贫困形成机理研究进展及贫困问题研究框架构建. 广西社会科学, 2018, (7):166-176.
[
|
| [23] |
张蕴萍. 中国农村贫困形成机理的内外因素探析. 山东社会科学, 2011, (8):33-37.
[
|
| [24] |
郭鹏, 余小方, 程飞. 中国农村贫困的特征以及反贫困对策. 西北农林科技大学学报: 社会科学版, 2006,6(1):9-13.
[
|
| [25] |
丁建军, 冷志明. 区域贫困的地理学分析. 地理学报, 2018,73(2):232-247.
[
|
| [26] |
|
| [27] |
|
| [28] |
|
| [29] |
|
| [30] |
|
| [31] |
刘彦随, 李进涛. 中国县域农村贫困化分异机制的地理探测与优化决策. 地理学报, 2017,72(1):161-173.
[
|
| [32] |
王永明, 王美霞, 吴殿廷, 等. 贵州省乡村贫困空间格局与形成机制分析. 地理科学, 2017,37(2):217-227.
[
|
| [33] |
马振邦, 陈兴鹏, 贾卓, 等. 人穷还是地穷? 空间贫困陷阱的地统计学检验. 地理研究, 2018,37(10):1997-2010.
[
|
| [34] |
孙才志, 陈琳, 赵良仕. 中国农村水贫困和经济贫困的时空耦合关系研究. 资源科学, 2013,35(10):1991-2002.
[
|
| [35] |
武鹏, 李同昇, 李卫民. 县域农村贫困化空间分异及其影响因素: 以陕西山阳县为例. 地理研究, 2018,37(3):593-606.
[
|
| [36] |
何仁伟, 丁琳琳. 精准扶贫背景下我国农村贫困机制研究综述. 江苏农业科学, 2018,46(17):1-8.
[
|
| [37] |
刘一明, 胡卓玮, 赵文吉, 等. 基于BP神经网络的区域贫困空间特征研究: 以武陵山连片特困区为例. 地球信息科学学报, 2015,17(1):69-77.
[
|
| [38] |
曹诗颂, 赵文吉, 段福洲. 秦巴特困连片区生态资产与经济贫困的耦合关系. 地理研究, 2015,34(7):1295-1309.
[
|
| [39] |
曲玮, 涂勤, 牛叔文. 贫困与地理环境关系的相关研究述评. 甘肃社会科学, 2010, (1):103-106.
[
|
| [40] |
刘春腊, 徐美, 周克杨, 等. 精准扶贫与生态补偿的对接机制及典型途径: 基于林业的案例分析. 自然资源学报, 2019,34(5):989-1002.
[
|
| [41] |
牛亚琼, 王生林. 甘肃省脆弱生态环境与贫困的耦合关系. 生态学报, 2017,37(19):6431-6439.
[
|
| [42] |
汪三贵. 在发展中战胜贫困: 对中国30年大规模减贫经验的总结与评价. 管理世界, 2008, (11):78-88.
[
|
| [43] |
|
| [44] |
张等文, 陈佳. 城乡二元结构下农民的权利贫困及其救济策略. 东北师大学报: 哲学社会科学版, 2014, (3):47-51.
[
|
| [45] |
黄万庭. 新疆农村社会保障反贫困效应分析. 新疆大学学报: 哲学人文社会科学版, 2015, (3):42-47.
[
|
| [46] |
朱姝, 冯艳芬, 王芳, 等. 粤北山区相对贫困村的脱贫潜力评价及类型划分: 以连州市为例. 自然资源学报, 2018,33(8):1304-1316.
[
|
| [47] |
温瑞霞. 皖西地区贫困的空间格局与影响机理研究. 芜湖: 安徽师范大学, 2019.
[
|
/
| 〈 |
|
〉 |