
JOURNAL OF NATURAL RESOURCES >
Spatiotemporal evolution and its influencing factors of semi-consumptive wildlife tourist attractions in China
Received date: 2019-11-06
Request revised date: 2019-12-18
Online published: 2021-02-28
Copyright
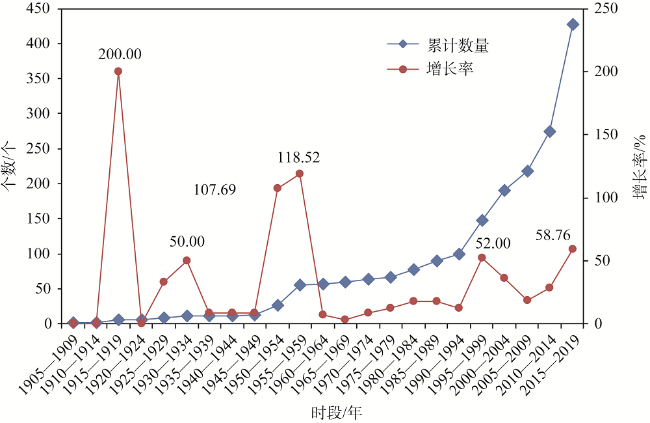
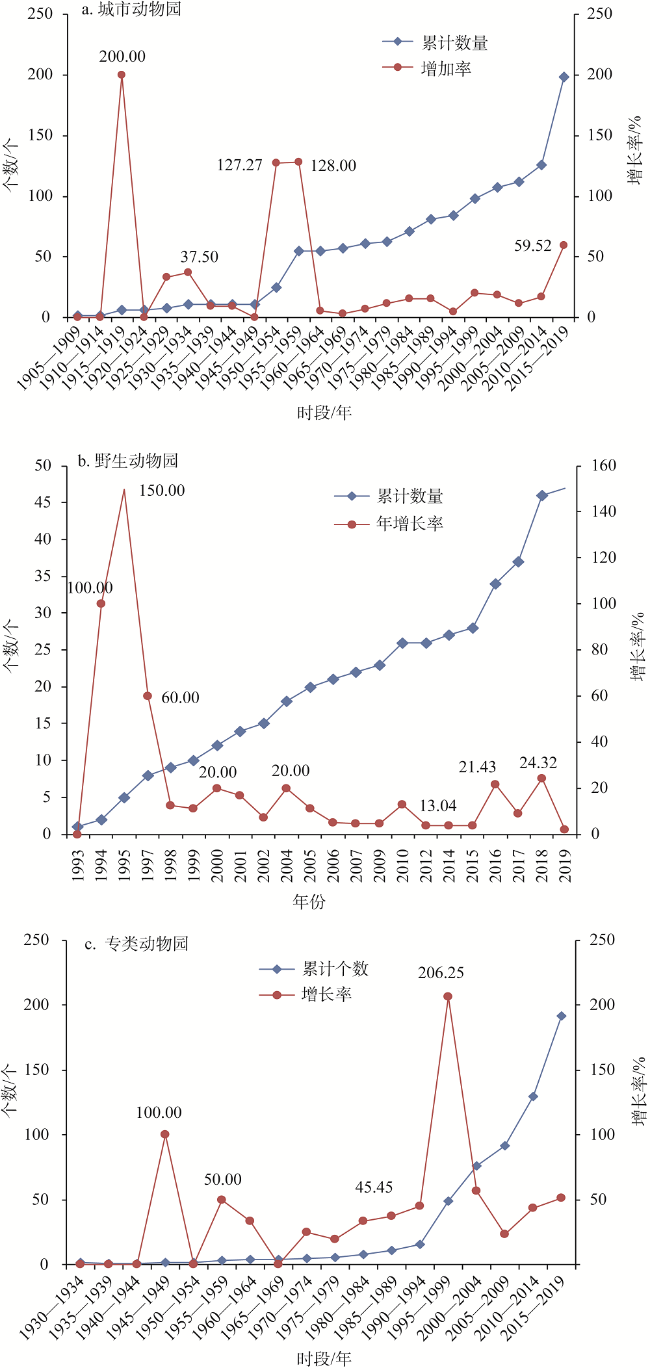
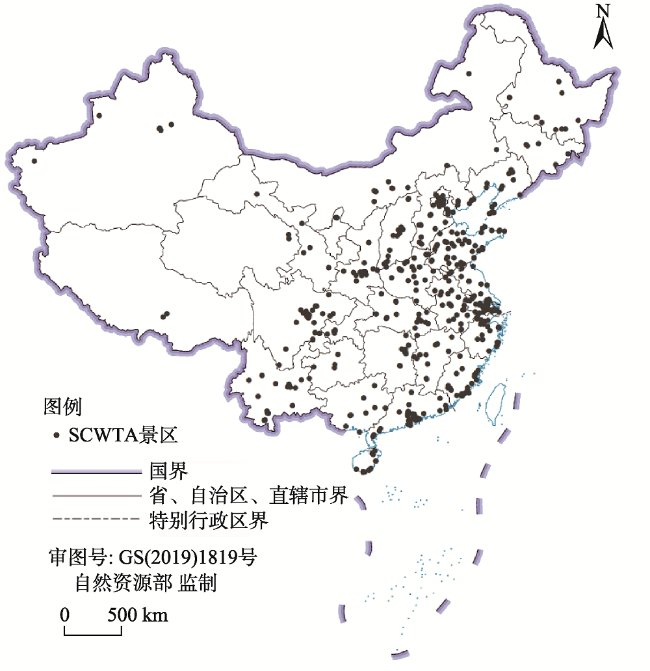
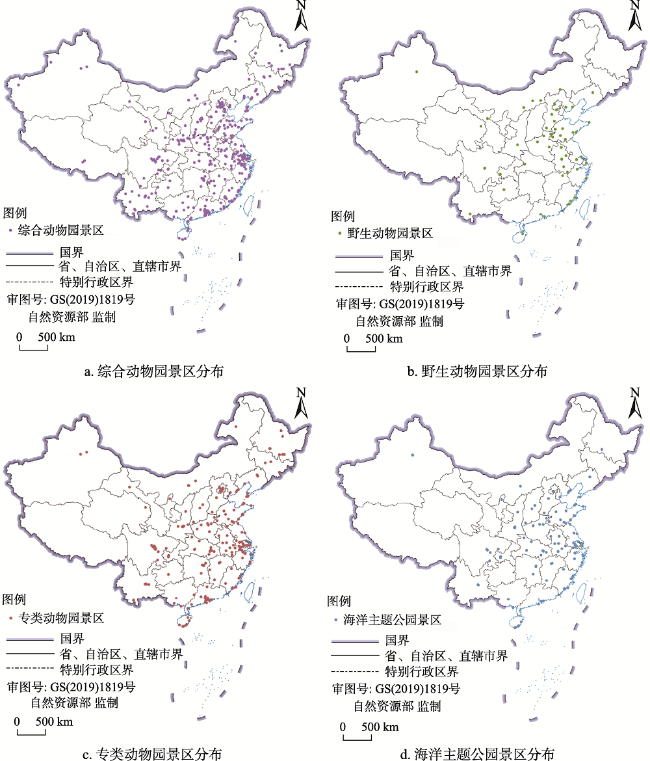
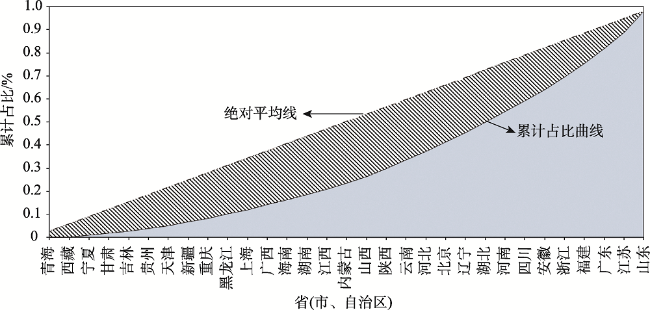
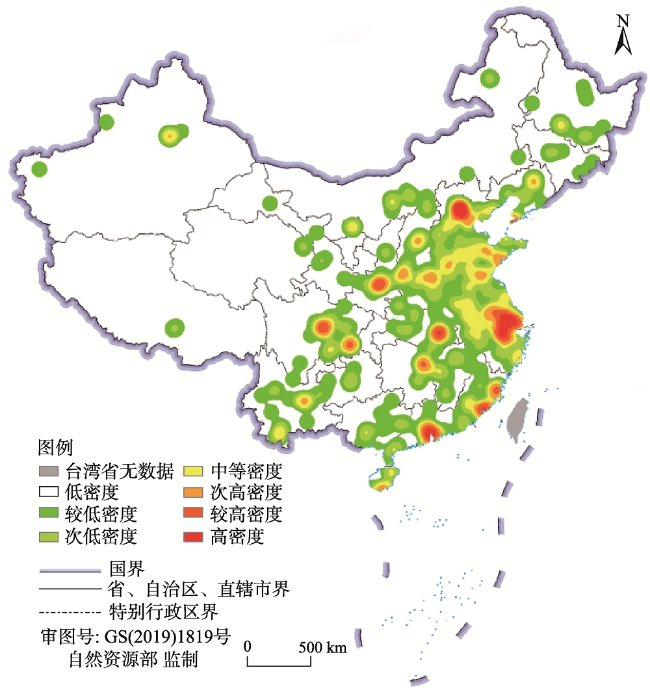
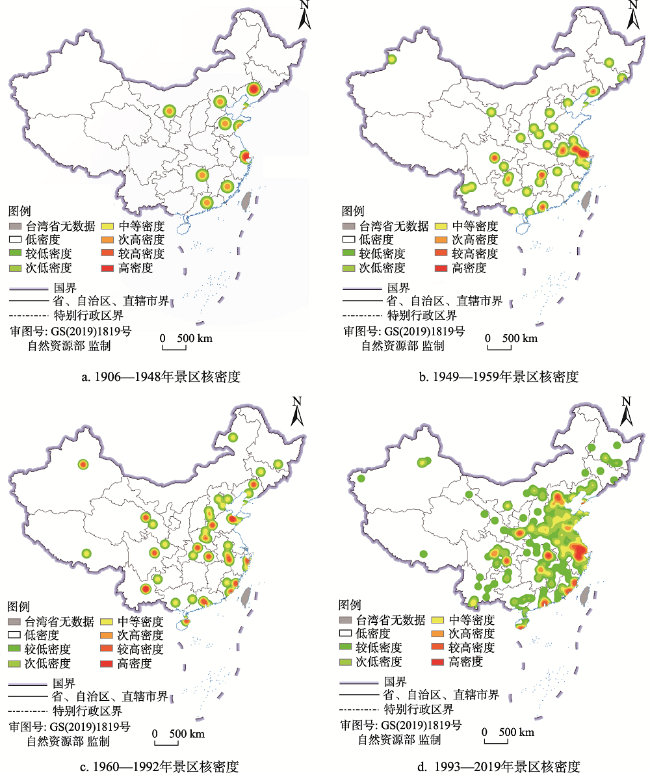
The interaction between human beings and wild animals has a profound and complex history. Wildlife tourism has gradually been seen as a compatible medium for people to interact with nature and wild animals. Along with the increasing demand in China, the supply of wildlife-themed tourist attractions, to some extent, has disordered competition, resulting in a waste of resources. Therefore, it is necessary to sort and analyze the resource base of semi-consumptive wildlife tourist attractions in China. Selecting 574 semi-consumptive wildlife tourism attractions in China from 1906 to 2019 as objects of study, this paper analyzed the spatial and temporal distribution, evolution characteristics as well as the related influencing factors of semi-consumptive wildlife tourist attractions in China, using models such as inter-annual variability index, nearest neighbor index, geographic concentration index, the Gini coefficient and the nuclear density analysis. The results show that: (1) In terms of time, the opening time of semi-consumptive wildlife tourist attractions in China is scattered, and can be roughly divided into four stages, namely the exploration stage (1906-1948), rapid development stage (1949-1959), slow development stage (1960-1992) and high-speed development stage (1993-2019). (2) In terms of space, the attractions present a cohesive distribution, and are geographically concentrated. The development between regions is highly unbalanced. Three high-density areas have formed with Beijing, Jiangsu-Zhejiang-Shanghai and Guangzhou as cores. Overall, there are more attractions in the eastern and southern coastal areas and less in the western part of China, with a transition in central China. Over time, the cohesion form continues and geographic concentration index gradually decreases approaching the assumed average level. However, the growth between regions is increasingly unbalanced. (3) The distribution of wildlife tourist attractions is influenced by development of history and national policies concerning the protection of wildlife animals, and has a certain positive correlation with the local factors such as population, the degree of economic development and the scale of tourism development. The attractions tend to be located in areas with great regional advantages, high population density, developed economy and leading tourism development. The research conclusion provides an overall cognition of spatial and temporal distribution of semi-consumptive wildlife attractions in China and will be the scientific basis and reference for investors and relevant managers to promote the further development and planning of wildlife tourism in the future.
CONG Li , YU Jia-ping , WANG Ling-en . Spatiotemporal evolution and its influencing factors of semi-consumptive wildlife tourist attractions in China[J]. JOURNAL OF NATURAL RESOURCES, 2020 , 35(12) : 2831 -2847 . DOI: 10.31497/zrzyxb.20201202
表1 半资源消费型野生动物旅游景区分类Table 1 The classifications of semi-consumptive wildlife tourist attractions |
| 分类 | 特征 | 类型 |
|---|---|---|
| 城市动物园 | 多物种和圈养生境 | 动物园、园中园、动物角、商场内小型主题动物园、动植物园等 |
| 野生动物园 | 多物种和半圈养生境 | 野生动物园、野生动物世界、野生动物繁育和研究中心、森林动物园等 |
| 专类动物园 | 特定物种和其生境 | 鸟语林、狮虎园、鳄鱼园、鹿苑、熊猫园、蝴蝶谷、昆虫馆等 |
| 海洋主题公园(海洋世界、海洋公园、水族馆、海洋王国等) |
表2 SCWTA景区的地理集中指数表Table 2 The index of concentration of semi-consumptive wildlife tourist attractions |
| 指标 | 所有景区 | 城市动物园 | 野生动物园 | 专类动物园 | 海洋主题公园 |
|---|---|---|---|---|---|
| 实际的地理集中指数 | 21.527 | 21.832 | 26.813 | 21.813 | 23.671 |
| 假设的平均地理集中指数 | 17.961 | 18.257 | 20.851 | 17.669 | 19.612 |
表3 各时间阶段最邻近指数Table 3 The nearest neighbor index of each time phase |
| 指标 | 第一阶段 1906—1948年 | 第二阶段 1949—1959年 | 第三阶段 1960—1992年 | 第四阶段1993—2019年 |
|---|---|---|---|---|
| 实际最邻近距离/km | 273.813 | 190.291 | 112.943 | 43.378 |
| 理论最邻近距离/km | 414.039 | 223.607 | 200.000 | 81.088 |
| 最邻近指数 | 0.661 | 0.851 | 0.565 | 0.535 |
| [1] |
|
| [2] |
|
| [3] |
丛丽. 人口学特征分异的半圈养生境野生动物旅游者环境态度分析: 深层生态学理论视角. 北京大学学报: 自然科学版, 2019,55(2):351-359.
[
|
| [4] |
尹铎, 高权, 朱竑. 广州鳄鱼公园野生动物旅游中的生命权力运作. 地理学报, 2017,72(10):1872-1885.
[
|
| [5] |
|
| [6] |
|
| [7] |
|
| [8] |
|
| [9] |
|
| [10] |
|
| [11] |
丛丽, 吴必虎, 李炯华. 国外野生动物旅游研究综述. 旅游学刊, 2012,27(5):57-65.
[
|
| [12] |
|
| [13] |
|
| [14] |
徐红罡. 中国非消费型野生动物旅游若干问题研究. 地理与地理信息科学, 2004,20(2):83-86.
[
|
| [15] |
|
| [16] |
|
| [17] |
|
| [18] |
|
| [19] |
|
| [20] |
|
| [21] |
|
| [22] |
马建章, 程鲲. 自然保护区生态旅游对野生动物的影响. 生态学报, 2008,28(6):2818-2827.
[
|
| [23] |
朱竑, 陈晓亮. 中国A级旅游景区空间分布结构研究. 地理科学, 2008,28(5):607-615.
[
|
| [24] |
潘竟虎, 李俊峰. 中国A级旅游景点空间分布特征与可达性. 自然资源学报, 2014,29(1):55-66.
[
|
| [25] |
王洪桥, 袁家冬, 孟祥君. 东北地区A级旅游景区空间分布特征及影响因素. 地理科学, 2017,37(6):895-903.
[
|
| [26] |
唐承财, 孙孟瑶, 万紫微. 京津冀城市群高等级景区分布特征及影响因素. 经济地理, 2019,39(10):204-213.
[
|
| [27] |
毛小岗, 宋金平, 于伟. 北京市A级旅游景区空间结构及其演化. 经济地理, 2011,31(8):1381-1386.
[
|
| [28] |
刘丽梅, 吕君. 内蒙古A级旅游景区空间结构研究. 干旱区资源与环境, 2016,30(11):203-208.
[
|
| [29] |
程海峰, 胡文海. 池州市A级旅游景区空间结构. 地理科学, 2014,34(10):1275-1280.
[
|
| [30] |
麻学锋, 杨雪. 大湘西高级别景区时空分布特征及影响因素的空间异质性. 自然资源学报, 2019,34(9):1902-1916.
[
|
| [31] |
李鹏, 虞虎, 王英杰. 中国3A级以上旅游景区空间集聚特征研究. 地理科学, 2018,38(11):1883-1891.
[
|
| [32] |
李东瑾, 毕华. 中国国家森林公园旅游景区空间结构研究. 中国人口·资源与环境, 2016,26(s1):274-277.
[
|
| [33] |
陈国磊, 张春燕, 罗静, 等. 中国红色旅游经典景区空间分布格局. 干旱区资源与环境, 2018,32(9):196-20.
[
|
| [34] |
肖妮, 黄悦, 刘继生. 中国主题公园旅游体验质量评价及空间分异特征研究. 地理科学, 2019,39(6):978-986.
[
|
| [35] |
|
| [36] |
罗小红. 我国野生动物园时空分布研究. 重庆: 西南大学, 2011.
[
|
| [37] |
魏钰, 雷光春. 从生物群落到生态系统综合保护: 国家公园生态系统完整性保护的理论演变. 自然资源学报, 2019,34(9):1820-1832.
[
|
/
| 〈 |
|
〉 |