
JOURNAL OF NATURAL RESOURCES >
Study on the spatial characteristics and intensity factors of "three-line conflict" in Jiangxi province
Received date: 2019-04-25
Request revised date: 2019-08-08
Online published: 2020-12-28
Copyright
Delimiting three lines (permanent basic farmland protection zones, urban growth boundaries and ecological protection redlines) scientifically is conducive to rational arrangement of land space resources and identifying the "three-line conflict" intensity factors can deepen the understanding of the national space planning. This study took the provincial spatial planning pilot area-Jiangxi province as an example, recognized the regional difference of "three-line conflict" by defining the "three-line conflict intensity", revealed its spatial characteristics by using spatial autocorrelation analysis, and analyzed the influencing factors of different types of conflict intensity by applying geographically weighted regression model (GWR). The results showed that the conflict areas of town-ecology, town-agriculture, ecology-agriculture and town-ecology-agriculture were 4305.791 km2, 2892.894 km2, 1845.341 km2 and 159.444 km2, respectively. There is obvious spatial clustering in the conflicts of town-ecology, town-agriculture, ecology-agriculture and town-ecology-agriculture. The main influencing factor of town-ecology conflict is the intensity of fixed assets investment, and the leading factor of town-agriculture conflict is the proportion of suitable area of construction land. The ecology-agriculture conflict is most affected by the topographic index, and the town-ecology-agriculture conflict is mainly affected by urbanization rate and the distance from river. The research results can provide reference for the rational layout of the "three lines" and the optimization of land structure.
YI Dan , ZHAO Xiao-min , GUO Xi , HAN Yi , JIANG Ye-feng , LAI Xia-hua , HUANG Xin-yi . Study on the spatial characteristics and intensity factors of "three-line conflict" in Jiangxi province[J]. JOURNAL OF NATURAL RESOURCES, 2020 , 35(10) : 2428 -2443 . DOI: 10.31497/zrzyxb.20201010
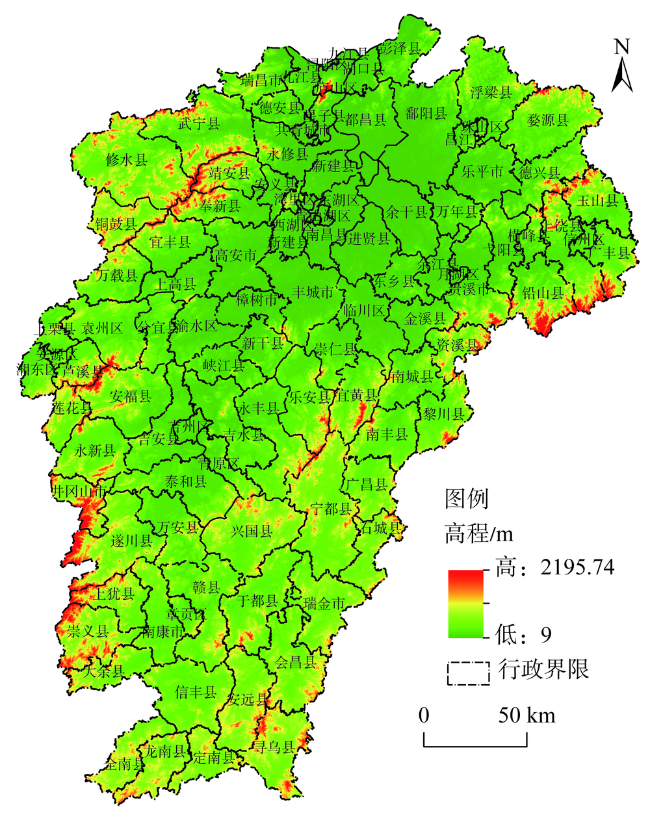
Fig. 1 Schematic diagram of terrain and extent of the study area图1 研究区地形和范围 |
Table 1 Impact factor variables and description表1 影响因素变量和说明 |
| 一级指标 | 二级指标 | 单位 | 数据来源 |
|---|---|---|---|
| 自然环境条件 | 地形位指数(x1) | — | 30 m×30 m DEM(http://www.gscloud.cn/) |
| 植被覆盖度(x2) | — | 遥感影像波段(http://www.gscloud.cn/) | |
| 居民点密度(x3) | — | 江西省土地利用变更调查成果(2015年) | |
| 社会经济状况 | 人口(x4) | 万人 | 各地级市统计年鉴及统计公报(2017年) |
| 人均GDP(x5) | 元/人 | 各地级市统计年鉴及统计公报(2017年) | |
| 城镇化率(x6) | % | 各地级市统计年鉴及统计公报(2017年) | |
| 固定资产投资强度(x7) | 万元 | 各地级市统计年鉴及统计公报(2017年) | |
| 地理区位特征 | 距河流距离(x8) | km | 电子地图数据集(http://www.tianditu.gov.cn/) |
| 距主要公路距离(x9) | km | 电子地图数据集(http://www.tianditu.gov.cn/) | |
| 土地利用特征 | 土地利用丰富度(x10) | % | 江西省土地利用变更调查成果(2015年) |
| 优质耕地占总耕地面积比(x11) | % | 耕地质量等别年度更新评价分析报告(2017年) | |
| 建设用地适宜区占总面积比(x12) | % | 江西省国土空间开发适宜性评价专题数据(2017年) | |
| 生态功能重要区占总面积比(x13) | % | 江西省国土空间开发适宜性评价专题数据(2017年) | |
| 规划因素 | 新增建设用地指标(x14) | hm2 | 江西省土地利用总体规划(2006—2020年)文本 |
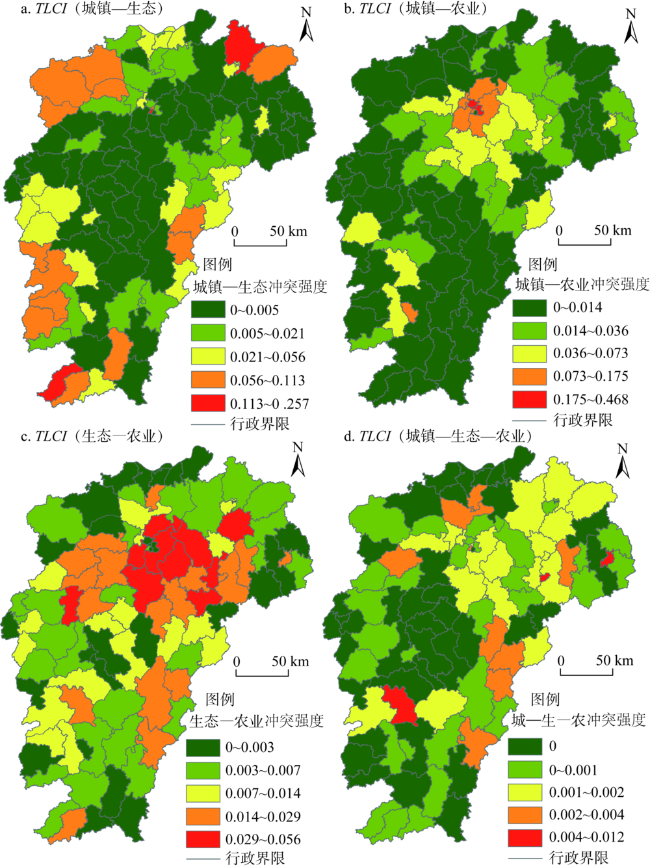
Fig. 2 Distribution of "three lines" conflict index of Jiangxi province图2 江西省各县市区“三线冲突”强度分布 |
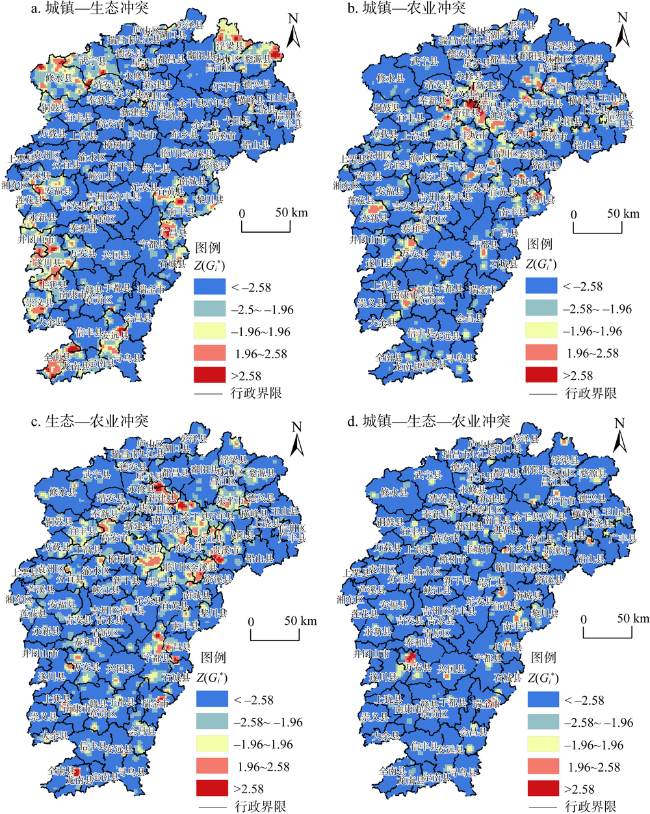
Fig. 3 Distribution of the Z(Gi*) values of "three lines" conflict index of Jiangxi province图3 江西省“三线冲突”强度指数Z(Gi*) 值分布 |
Table 2 Results of the intensity correlation analysis of "three lines" conflict表2 “三线冲突”强度指数与影响因素相关性分析结果 |
| 冲突类型强度指数 | x1 | x2 | x3 | x4 | x5 | x6 | x7 |
|---|---|---|---|---|---|---|---|
| 城镇—生态 | 0.251* | — | 0.211* | -0.288** | — | — | 0.214* |
| 城镇—农业 | -0.346** | -0.378** | 0.521** | — | 0.365** | 0.432** | 0.464** |
| 生态—农业 | -0.404** | — | — | 0.331** | — | — | — |
| 城镇—生态—农业 | — | — | — | — | — | 0.252* | — |
| 冲突类型强度指数 | x8 | x9 | x10 | x11 | x12 | x13 | x14 |
| 城镇—生态 | 0.197* | — | -0.380** | — | — | 0.210* | -0.231* |
| 城镇—农业 | -0.279** | -0.254* | 0.278** | — | 0.706** | -0.220* | 0.249* |
| 生态—农业 | -0.287** | — | 0.260** | — | — | — | 0.243* |
| 城镇—生态—农业 | -0.223* | — | — | — | — | — | — |
注:*表示显著相关(P<0.05),**表示极显著相关(P<0.01)。 |
Table 3 Comparison of GWR and OLS model parameter estimation for different types of conflict strength表3 不同类型冲突强度GWR模型较OLS模型参数估计比较 |
| 冲突类型强度指数 | 城镇—生态 | 城镇—农业 | 生态—农业 | 城镇—生态—农业 | |||||||
|---|---|---|---|---|---|---|---|---|---|---|---|
| AICc | R2adj | AICc | R2adj | AICc | R2adj | AICc | R2adj | ||||
| OLS模型 | -114.228 | 0.333 | -208.830 | 0.530 | -44.713 | 0.174 | -73.362 | 0.123 | |||
| GWR模型 | -118.217 | 0.389 | -212.226 | 0.557 | -49.707 | 0.194 | -101.648 | 0.362 | |||
| GWR模型对模拟精度指标的提高 | -3.989 | 0.056 | -3.396 | 0.027 | -4.994 | 0.020 | -28.827 | 0.239 | |||
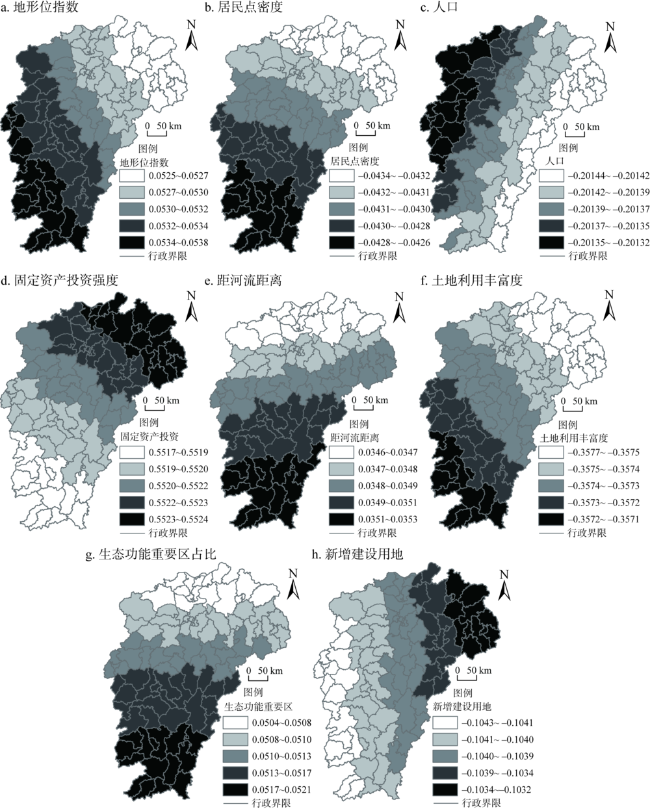
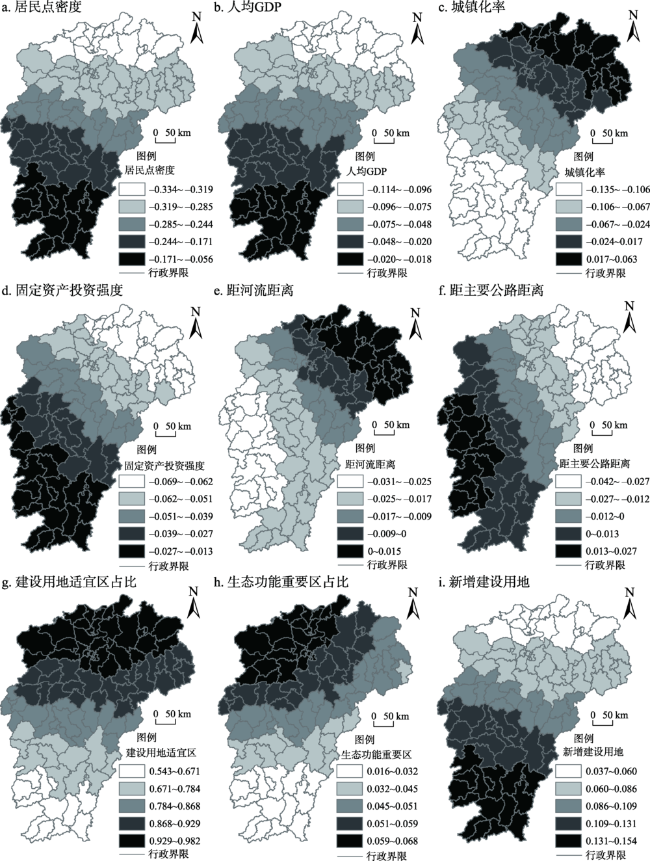
Fig. 4 The spatial differentiation of town-ecology conflict intensity impact factors图4 城镇—生态冲突强度影响因素空间分异 |
Fig. 5 The spatial differentiation of town-agriculture conflict intensity impact factors图5 城镇—农业冲突强度影响因素空间分异 |
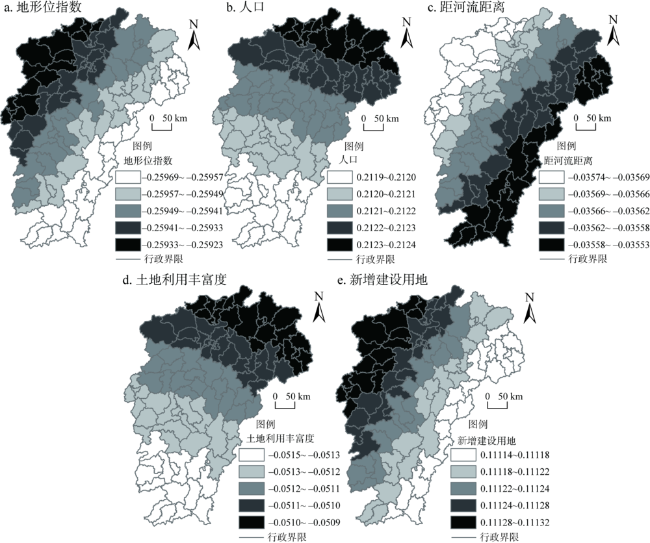
Fig. 6 The spatial differentiation of ecology-agriculture conflict intensity impact factors图6 生态—农业冲突强度影响因素空间分异 |
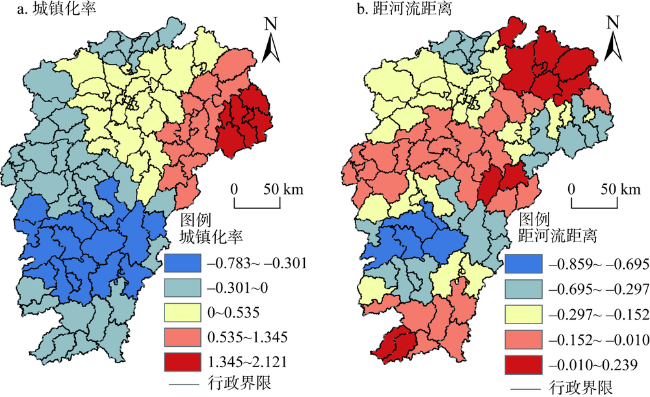
Fig. 7 The spatial differentiation of town-ecology-agriculture conflict intensity impact factors图7 城镇—生态—农业冲突强度影响因素空间分异 |
| [1] |
[
|
| [2] |
|
| [3] |
[
|
| [4] |
[
|
| [5] |
[
|
| [6] |
|
| [7] |
[
|
| [8] |
[
|
| [9] |
[
|
| [10] |
[
|
| [11] |
[
|
| [12] |
[
|
| [13] |
[
|
| [14] |
[
|
| [15] |
|
| [16] |
|
| [17] |
[
|
| [18] |
江西省统计局. 江西省2018年国民经济和社会发展公报. , 2019-03-20.
[Statistic bureau of Jiangxi. Bulletin of the national economic and social development of Jiangxi province in 2018. , 2019-04-23.]
|
| [19] |
[
|
| [20] |
[
|
| [21] |
|
| [22] |
[
|
| [23] |
[
|
| [24] |
[
|
| [25] |
[
|
| [26] |
[
|
| [27] |
[
|
| [28] |
[
|
| [29] |
[
|
| [30] |
[
|
| [31] |
[
|
| [32] |
[
|
| [33] |
江西省国土勘测规划院. 江西省建设用地适宜性评价相关技术规范: 各县(市、区)的分类标准. 2018-01-01.
[Jiangxi Provincial Land Survey and Planning Institute. Technical specifications for the evaluation of suitability of construction land in Jiangxi province: Classification standards of counties (cities, districts). 2018-01-01.]
|
| [34] |
[
|
| [35] |
[
|
| [36] |
[
|
| [37] |
[
|
| [38] |
[
|
| [39] |
[
|
| [40] |
[
|
| [41] |
[
|
| [42] |
[
|
| [43] |
[
|
| [44] |
[
|
| [45] |
[
|
| [46] |
[
|
| [47] |
[
|
/
| 〈 |
|
〉 |