
JOURNAL OF NATURAL RESOURCES >
Inversion of soil moisture content in the farmland in middle and lower reaches of Syr Darya River Basin based on multi-source remotely sensed data
Received date: 2019-05-25
Request revised date: 2019-09-09
Online published: 2019-12-28
Copyright
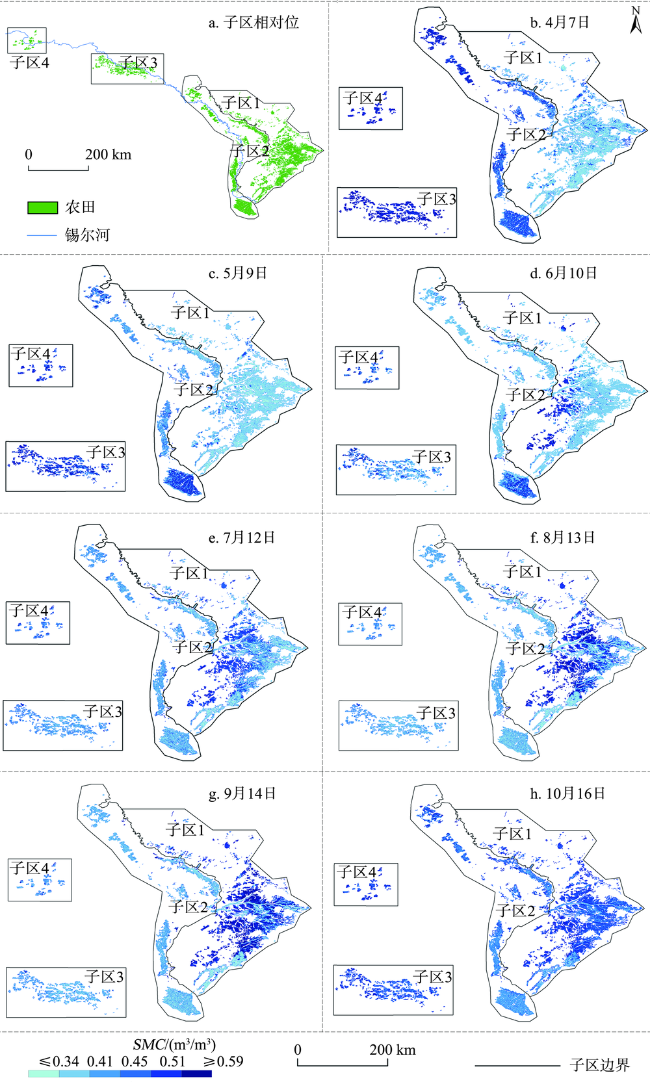
The use of machine learning method to estimate Soil Moisture Content (SMC) from multi-source remotely sensed data is a hot topic in the SMC inversion research. However, taking no account of the important variables of SMC in the ML method makes the SMC results uncertain. The Sentinel-1 and MODIS image products and the STRM data were obtained and used for extracting 32 SMC variables, such as backscattering coefficient, vegetation index, surface temperature and evapotranspiration. A total of 27 significant (P<0.05) SMC variables were selected as input parameters referring to the correlation analysis result, and the input parameters were assigned to 3 groups. Random forest, Support vector regression and Back Propagation Neural Network were tested with 3 groups parameters. The Random forest with the group with all input parameters showed the best estimation accuracy, with the RMSE being 0.039 m³/m³, and it was used for the inversion of SMC in the farmland in the middle and lower reaches of Syr Darya River Basin during the growing season of 2017. The retrieved SMC gradually increased in the middle to the lower reaches during the growing season, but there were significant temporal and spatial differences: SMC in spring and autumn was higher than that in summer. These differences were mainly caused by seasonal or spatial differences in soil texture, heat conditions (temperature) and vegetation cover. In spring, SMC in the lower part of the plain is higher than that in the upper part, and the main SMC controlling factors were soil texture and vegetation cover. In summer, the main SMC controlling factors were heat condition. Irrigation compensated for the influence of heat condition difference, resulting in no significant spatial difference of SMC between upper and lower parts of the plain. The main SMC controlling factors in autumn were soil texture and heat conditions, the influence of surface temperature compensated for the influence of soil texture on SMC, as a result, there was no significant spatial difference of SMC in autumn. With regard to overcoming the limitation of taking no account of the important variables in estimating SMC, the research method adopted in this study improves the retrieved SMC accuracy to a large extent.
WANG Hao , LUO Ge-ping , WANG Wei-sheng , PACHIKIN Konstantin , LI Yao-ming , ZHENG Hong-wei , HU Wei-jie . Inversion of soil moisture content in the farmland in middle and lower reaches of Syr Darya River Basin based on multi-source remotely sensed data[J]. JOURNAL OF NATURAL RESOURCES, 2019 , 34(12) : 2717 -2731 . DOI: 10.31497/zrzyxb.20191218
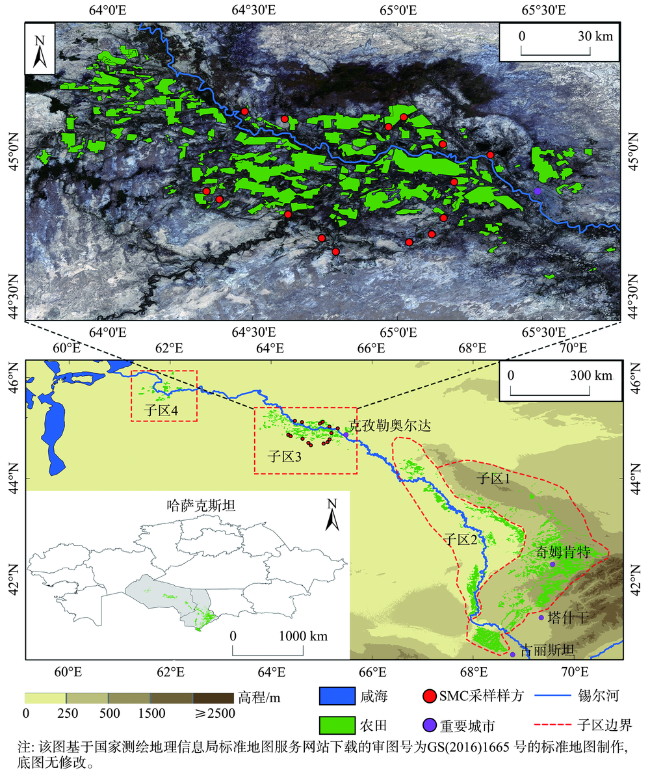
Fig. 1 Location of the sampling points in the middle and lower reaches of Syr Darya River Basin图1 研究区与采样点分布示意 |
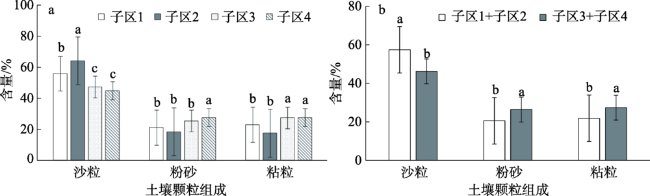
Fig. 2 The spatial characteristics of means and standard deviations of soil texture in the middle and lower reaches of Syr Darya River Basin (0-10 cm)图2 锡尔河流域中下游土壤质地(0~10 cm)均值与标准差空间特征 |
Table 1 Data of SMC inversion and analysis of farmland in the middle and lower reaches of Syr Darya River Basinduring the growing season in 2017表1 锡尔河中下游农田2017年生长季SMC研究所需数据 |
| 数据 | 空间分辨率/m | 时间分辨率/d | 来源 | 用途 | 时间 |
|---|---|---|---|---|---|
| Sentinel-1 SAR | 5×20 | 12 | ESA(https://scihub.co pernicus.eu) | SMC影响因子的时空数据 | 2017年4-10月 |
| MOD09GQ地表反射率 MOD11A2 v4地表温度 MOD13Q1v6植被指数 MYD13Q1.v6植被指数 MCD15A3H叶面积指数 MOD16A2 v6蒸散发 MCD43A3地表反照率 | 250 1000 250 250 500 500 500 | 1 8 16 16 4 8 1 | NASA(https://lpdaac.usgs.gov) | 2017年4-10月 | |
| SRTM v4高程数据 | 90 | CRIAR(http://srtmcsi.cgiar.org) | |||
| SMC实测数据 | 中国科学院新疆生地所 | 模型训练与反演结果验证 | 2017年9月18-20日 |
Table 2 SMC factors in the middle and lower reaches of Syr Darya River Basin表2 锡尔河流域中下游SMC影响因子 |
| SMC影响因子类型 | 名称 | 影响因子 |
|---|---|---|
| 微波物理量 | 后向散射系数(backscattering coefficient,BC) | BC均值/最大值/最小值 |
| 植被变量 | 归一化植被指数(Normalized differential vegetation index,NDVI) | NDVI均值/最大值/最小值 |
| 增强型植被指数(Enhanced Vegetation Index,EVI) | EVI均值/最大值/最小值 | |
| 土壤调整植被指(Soil Adjusted Vegetation Index,SAVI) | SAVI均值/最大值/最小值 | |
| 叶面积指数(leaf Area Index,LAI) | LAI均值/最大值/最小值 | |
| 温度变量 | 地表温度(Surface temperature,LST) | LST均值/最大值/最小值 |
| 蒸散发变量 | 蒸散发(Evapotranspiration,ET) | ET均值/最大值/最小值/累积值 |
| 下垫面反射特性变量 | 可见光范围地表反照率(Albedo in VIS,AIV) | AIV均值/最大值/最小值 |
| 近红外范围地表反照率(Albedo in NIR,AIN) | AIN均值/最大值/最小值 | |
| 地形变量 | 高程(Elevation) 坡度(Slope) 坡向(Aspect) 地面粗糙度(Roughness) | 高程/坡度/坡向/地面粗糙度 |
Table 3 Correlation analysis of SMC and SMC factors in the middle and lower reaches of Syr Darya River Basin表3 锡尔河流域中下游SMC与影响因子相关性分析 |
| 植被变量 | 温度或水分变量和微波物理量 | 地形变量和下垫面反射特性变量 | ||||||||
|---|---|---|---|---|---|---|---|---|---|---|
| r² | P | r² | P | r² | P | |||||
| NDVI平均值 | 0.615 | 0.006 | LST平均值 | -0.385 | 0.034 | AIV平均值 | 0.673 | 0.002 | ||
| NDVI最大值 | 0.584 | 0.009 | LST最大值 | -0.757 | 0.000 | AIV最大值 | 0.723 | 0.001 | ||
| NDVI最小值 | 0.584 | 0.009 | LST最小值 | -0.492 | 0.026 | AIV最小值 | 0.701 | 0.001 | ||
| SAVI平均值 | 0.358 | 0.042 | ET平均值 | 0.100 | 0.356 | AIN平均值 | 0.698 | 0.001 | ||
| SAVI最大值 | 0.354 | 0.047 | ET累积值 | -0.328 | 0.050 | AIN最大值 | 0.726 | 0.001 | ||
| SAVI最小值 | 0.373 | 0.039 | ET最小值 | -0.334 | 0.048 | AIN最小值 | 0.752 | 0.000 | ||
| LAI平均值 | 0.183 | 0.197 | ET最大值 | 0.394 | 0.031 | Elevation高程 | -0.682 | 0.002 | ||
| LAI最大值 | 0.165 | 0.270 | BS平均值 | 0.437 | 0.031 | Aspect坡向 | 0.556 | 0.013 | ||
| LAI最小值 | 0.737 | 0.001 | BS最大值 | 0.379 | 0.037 | Slope坡度 | -0.238 | 0.188 | ||
| EVI平均值 | 0.380 | 0.032 | BS最小值 | 0.366 | 0.040 | Rough地面粗糙度 | -0.242 | 0.184 | ||
| EVI最大值 | 0.526 | 0.018 | ||||||||
| EVI最小值 | 0.526 | 0.018 | ||||||||
Table 4 Quantitative statistics of the SMC retrieval with different combinations of parameters and models表4 不同反演组合的SMC反演精度统计 |
| 机器学习模型 | 试验组合方案 | 基于训练样本的精度统计 | 基于验证样本的精度统计 | |||||
|---|---|---|---|---|---|---|---|---|
| R² | RMSE/(m³/m³) | MAPE/% | R² | RMSE/(m³/m³) | MAPE/% | |||
| RF | VV | 0.69 | 0.041 | 11.2 | 0.52 | 0.065 | 17.5 | |
| NDVI+VV | 0.78 | 0.038 | 10.6 | 0.59 | 0.054 | 13.5 | ||
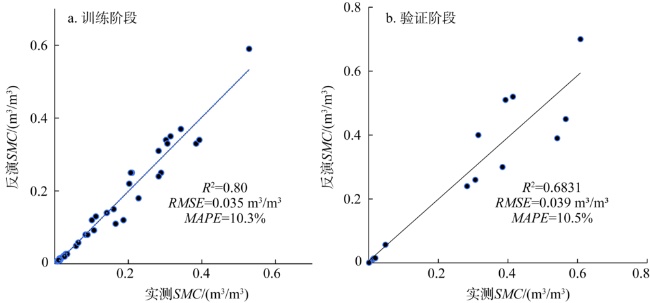
| 所有因子 | 0.80 | 0.035 | 10.3 | 0.68 | 0.039 | 10.5 | ||
| SVR | VV | 0.71 | 0.042 | 11.5 | 0.53 | 0.056 | 13.8 | |
| NDVI+VV | 0.75 | 0.037 | 11.3 | 0.55 | 0.059 | 13.7 | ||
| 所有因子 | 0.78 | 0.037 | 10.7 | 0.64 | 0.043 | 10.9 | ||
| BPNN | VV | 0.69 | 0.042 | 11.4 | 0.49 | 0.086 | 18.4 | |
| NDVI+VV | 0.73 | 0.039 | 10.9 | 0.54 | 0.059 | 14.1 | ||
| 所有因子 | 0.74 | 0.038 | 11.0 | 0.59 | 0.052 | 11.9 | ||
Fig. 3 Scatter plots of observed SMC and retrieved SMC based on The Random forest with the group with all input parameters图3 实测SMC和随机森林RF结合多因子的反演SMC散点图 |
Fig. 4 The retrieved SMC in the farmland in the middle and lower reaches of Syr Darya River Basin during the growing season in 2017 (In order to highlight the SMC spatial distribution, the positions of region 3 and region 4 were moved)图4 锡尔河流域中下游农田区域2017年生长季SMC时空分布(通过移动研究子区3和子区4的空间位置,改善SMC空间显示) |
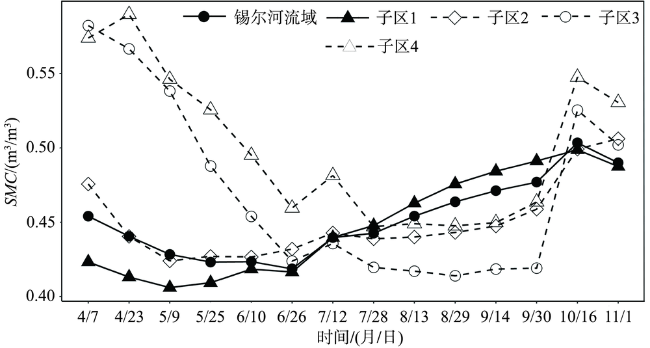
Fig. 5 Change of the mean SMC during the growing season in the middle and lower catchments of the farmland in the middle and lower reaches of Syr Darya River Basin in 2017图5 2017年生长季锡尔河流域中下游农田SMC均值变化 |
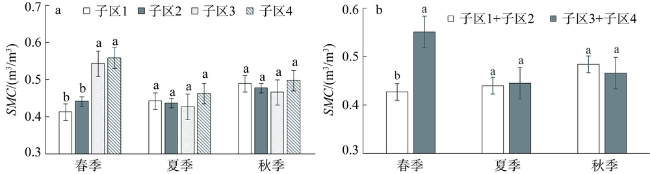
Fig. 6 The spatiotemporal difference of means and standard deviations of SMC at different time图6 表锡尔河流域中下游SMC均值与标准差时空差异 |
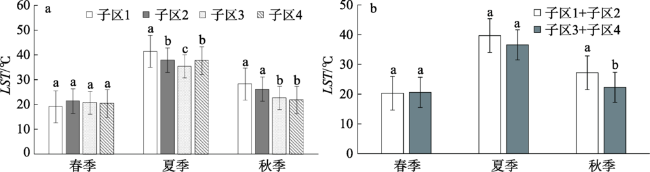
Fig. 7 The spatiotemporal difference of means and standard deviations of LST at different time图7 锡尔河流域中下游地表温度均值与标准差时空差异 |
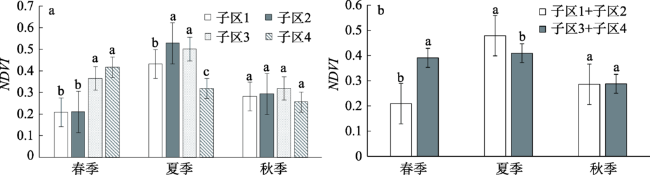
Fig. 8 The spatiotemporal difference of means and standard deviations of NDVI at different time图8 锡尔河流域中下游NDVI均值与标准差时空差异 |
Table 5 The comparison of different machine learning methods for estimating SMC by remotely sensed data表5 机器学习结合遥感数据的SMC反演对比 |
| 研究 | 数据源 | 建模因子 | 方法 | RMSE | 研究区 |
|---|---|---|---|---|---|
| Pasolli等[36] | RADARSAT-2 | HH或VV单个因子 | SVR | 0.0485 m3/m3 | 意大利 |
| Pasolli等[17] | RADARSAT-2 | HH或VV单个因子 | SVR | 5.38%~6.85% | 意大利 |
| Santi等[24] | AMSR2、Envisat等 | VV+NDVI或HH+NDVI双因子 | ANN | 0.023~0.052 m3/m3 | 巴西 |
| Paloscia等[14] | Sentinel-1、MODIS等 | VV+NDVI或者HH+NDVI双因子 | ANN | 2.32%~5.47% | 意大利等 (部分农田) |
| Alexakis等[15] | Sentinel-1、Landsat8 | NDVI、HV等4个因子 | ANN | 0.022~0.058 m3/m3 | 希腊 |
| Zeng等[37] | 土样光谱信息 | 热红外波段相关的3~4个因子 | ANN | 0.017~0.032 m3/m3 | 中国内蒙(农田) |
| Hassan等[21] | AggieAir 无人机高光谱影像 | NDVI等10个因子 | ANN | 2% | 美国犹他州 (农田) |
| ÖZerdem等[16] | RADARSAT-2 | VV等10个因子 | ANN | 2.84%~9.76% | 土耳其(农田) |
| 本文 | Sentinel-1、MODIS等 | NDVI均值等27个因子 | RF | 0.039 m3/m3 | 锡尔河中下游绿洲农田 |
注:RADARSAT-2、Envisat、Sentinel-1为主动雷达SAR数据。HH、VV、HV分别为雷达的水平极化、垂直极化、交叉极化后向散射系数。 |
| [1] |
|
| [2] |
|
| [3] |
|
| [4] |
|
| [5] |
|
| [6] |
|
| [7] |
|
| [8] |
|
| [9] |
|
| [10] |
|
| [11] |
|
| [12] |
|
| [13] |
|
| [14] |
|
| [15] |
|
| [16] |
|
| [17] |
|
| [18] |
|
| [19] |
|
| [20] |
|
| [21] |
|
| [22] |
|
| [23] |
|
| [24] |
|
| [25] |
|
| [26] |
|
| [27] |
|
| [28] |
|
| [29] |
|
| [30] |
|
| [31] |
|
| [32] |
|
| [33] |
[
|
| [34] |
|
| [35] |
[
|
| [36] |
|
| [37] |
|
/
| 〈 |
|
〉 |