
JOURNAL OF NATURAL RESOURCES >
Influence of hydrological connectivity of coastal wetland on the biological connectivity of macrobenthos in the Yellow River Estuary
Received date: 2019-03-10
Request revised date: 2019-06-13
Online published: 2019-12-28
Copyright
Coastal wetland is the transitional area between land and sea, with high habitat complexity, species biodiversity and ecological service functions. However, due to the influence of human activity and climate change, the areas of the wetlands are gradually reduced, and the structure and functions of wetlands such as hydrological connectivity are greatly influenced. In the present work, we selected three typical tidal channels with obvious differences in hydrological connectivity, investigated the macrobenthos community between different tidal channels and analyzed the influence of longitudinal hydrological connectivity on the distribution and diversity (density, biomass and biodiversity) of macrobenthos. A total of 52 species were documented, and the numerically abundant taxonomic groups were Polychaeta and Mollusca; Overall, with the increase of hydrological connectivity, the total density of macrobenthos showed an upward trend; the areas with moderate hydrological connectivity tended to have a higher biodiversity; different groups of macrobenthos showed different density and distribution responding to environmental factors caused by hydrological connectivity; Polychaeta and Oligochaeta were dominant in areas with low hydrological connectivity and Mollusca were dominant in areas with high hydrological connectivity and abundant nutrients; Crustacea were dominant in areas close to the channel source with the highest hydrological connectivity. This study is helpful to understand the mechanism of wetlands hydrological connectivity on biological connectivity, and provide an important reference for the protection and restoration of coastal wetlands.
WANG Xin-yan , YAN Jia-guo , BAI Jun-hong , CUI Bao-shan . Influence of hydrological connectivity of coastal wetland on the biological connectivity of macrobenthos in the Yellow River Estuary[J]. JOURNAL OF NATURAL RESOURCES, 2019 , 34(12) : 2544 -2553 . DOI: 10.31497/zrzyxb.20191205
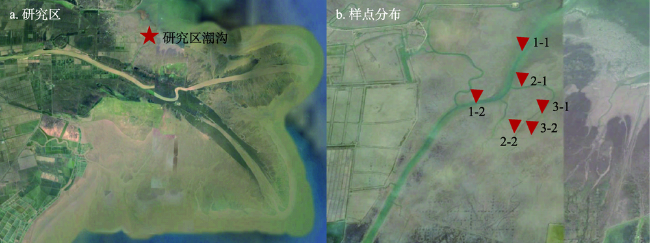
Fig. 1 Location of the study site and distribution of sampling points图1 研究区与样点分布 |
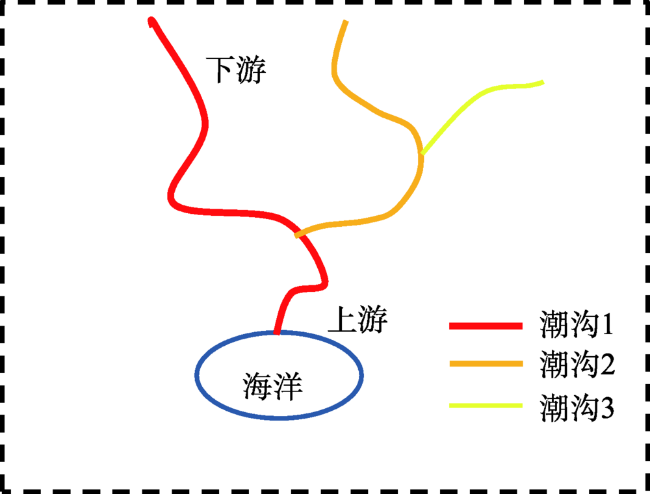
Fig. 2 The pattern diagram of tidal channels图2 潮沟模式 |
Table 1 Physical characteristics of tidal channels表1 潮沟理化性质指标 |
| 理化性质 | 潮沟1 | 潮沟2 | 潮沟3 |
|---|---|---|---|
| 高程/m | 0.87 | 1.14 | 1.36 |
| 断面面积/m2 | 79.75 | 32.50 | 25.53 |
| 流量/(m3/s) | 1.51±0.14 | 0.97±0.33 | 0.25±0.21 |
| 盐度/ppt | 19~23 | 19~23 | 19~23 |
| 可溶性无机氮/(μmol/L) | 1.47±0.13 | 1.41±0.22 | 1.42±0.19 |
| 总磷/(μmol/L) | 0.22±0.03 | 0.24±0.13 | 0.21±0.21 |
Table 2 Species composition of macrobenthos communities in different tidal channels (种) |
| 潮沟 | 上下游 | 纽形动物 | 寡毛类 | 多毛类 | 软体动物 | 昆虫纲 | 甲壳类 | 合计 |
|---|---|---|---|---|---|---|---|---|
| 潮沟1 | 上游 | 0 | 1 | 9 | 4 | 1 | 1 | 16 |
| 下游 | 0 | 1 | 12 | 11 | 0 | 3 | 27 | |
| 总和 | 0 | 1 | 13 | 12 | 1 | 4 | 31 | |
| 潮沟2 | 上游 | 1 | 1 | 14 | 15 | 0 | 4 | 35 |
| 下游 | 0 | 1 | 9 | 10 | 0 | 4 | 24 | |
| 总和 | 1 | 1 | 17 | 17 | 0 | 6 | 42 | |
| 潮沟3 | 上游 | 1 | 1 | 10 | 11 | 0 | 4 | 27 |
| 下游 | 1 | 1 | 8 | 8 | 0 | 4 | 22 | |
| 总和 | 1 | 1 | 12 | 11 | 0 | 6 | 31 | |
| 总种数 | 1 | 1 | 21 | 19 | 1 | 9 | 52 | |
Table 3 Dominant species of macrobenthos communities in different tidal channels表3 不同潮沟中大型底栖动物群落的优势种 |
| 潮沟 | 优势种 |
|---|---|
| 潮沟1上游 | 霍甫水丝蚓、中蚓虫、日本刺沙蚕、海稚虫科一种 |
| 潮沟1下游 | 寡节甘吻沙蚕、中蚓虫、日本刺沙蚕、海稚虫科一种 |
| 潮沟2上游 | 寡节甘吻沙蚕、中蚓虫、日本刺沙蚕、海稚虫科一种、江户明樱蛤 |
| 潮沟2下游 | 寡节甘吻沙蚕、中蚓虫、日本刺沙蚕、海稚虫科一种 |
| 潮沟3上游 | 寡节甘吻沙蚕、中蚓虫、日本刺沙蚕、海稚虫科一种、江户明樱蛤 |
| 潮沟3下游 | 寡节甘吻沙蚕、日本刺沙蚕 |
| 潮沟总和 | 霍甫水丝蚓、寡节甘吻沙蚕、中蚓虫、日本刺沙蚕、沙蚕科一种、海稚虫科一种、江户明樱蛤 |
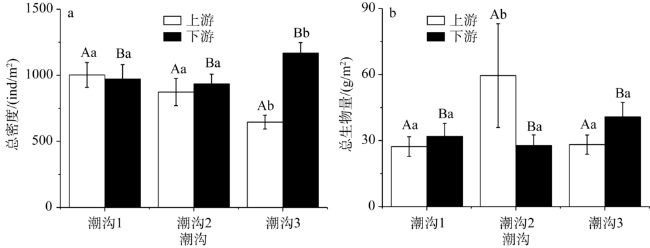
Fig. 3 Total density and biomass of macrobenthos in three tidal channels图3 三条潮沟大型底栖动物的总密度和总生物量 |
Fig. 4 Total density and biomass of macrobenthos in the up and down stream of tidal channel图4 潮沟上下游大型底栖动物密度和生物量 |
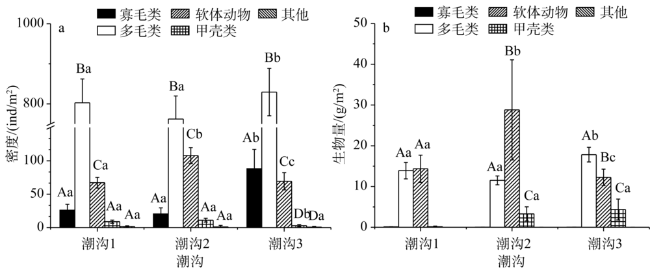
Fig. 5 Density and biomass of macrobenthos in different groups图5 不同类群的大型底栖动物密度和生物量 |
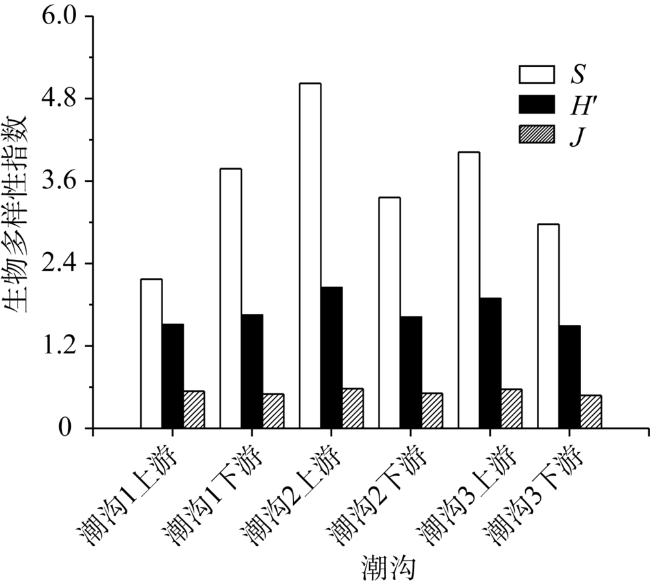
Fig. 6 Biodiversity index of macrobenthos in different tidal channels图6 不同潮沟大型底栖动物生物多样性指数 |
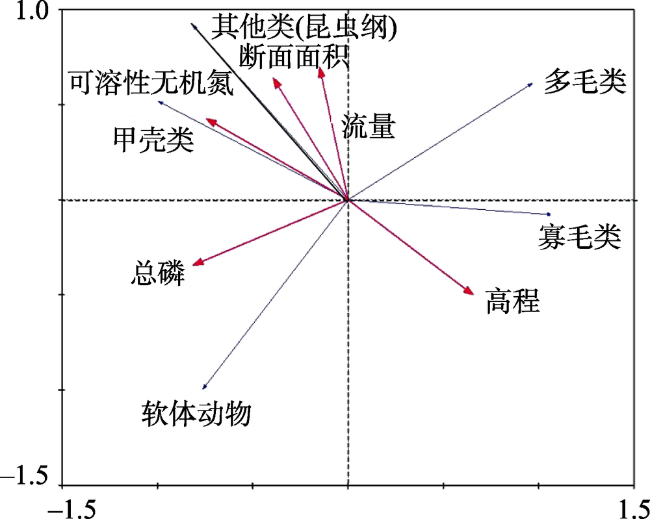
Fig. 7 RDA triplot of total density of macrobenthos groups and environment parameters图7 大型底栖动物类群的总密度和环境因子的冗余分析 |
| [1] |
[
|
| [2] |
[
|
| [3] |
|
| [4] |
|
| [5] |
|
| [6] |
[
|
| [7] |
[
|
| [8] |
[
|
| [9] |
|
| [10] |
[
|
| [11] |
[
|
| [12] |
|
| [13] |
|
| [14] |
[
|
| [15] |
[
|
| [16] |
[
|
| [17] |
[
|
| [18] |
[
|
| [19] |
[
|
| [20] |
|
| [21] |
|
| [22] |
[
|
| [23] |
[
|
| [24] |
[
|
| [25] |
[
|
| [26] |
[
|
| [27] |
[
|
| [28] |
[
|
| [29] |
[
|
| [30] |
[
|
| [31] |
[
|
| [32] |
[
|
| [33] |
[
|
/
| 〈 |
|
〉 |
