
JOURNAL OF NATURAL RESOURCES >
Impacts of tidal channels on typical landscapes of wetland in the Yellow River Delta
Received date: 2019-06-10
Request revised date: 2019-10-08
Online published: 2019-12-28
Copyright
Tidal channels play important roles in governing landscape succession in the estuary areas. In the present work, tidal channels and landscapes types of the Yellow River Delta (YRD) were extracted by visual interpretation based on remote sensing images combined with field investigation during 1989-2016, aiming to decipher effects of tidal channel development on Phragmites australis, Suaeda salsa and mudflats in the last 20 years through Redundancy Analysis (RDA). Results indicated that area ratio of mudflats was in the fluctuation of increase and decrease during the past 20 years, and the change trend is opposite to that of Phragmites australis and Suaeda salsa. Patch density was larger in the Northern YRD than that in the Southern YRD, and fragmentation is relatively high. RDA analysis showed that the first two sequence axes could explain about 85.7% variations of landscape indexes, which better reflected the correlation between the two. Length, number, network connectivity and curvature had greater effects on landscape features; the effect of fractal dimension was the smallest. Length, number, and fractal dimension were negatively correlated with the area ratio and patch density of Phragmites australis and Suaeda salsa while they were positively correlated with the area ratio of mudflats.
Key words: tidal channels; landscapes; RDA; Yellow River Delta
YU Xiao-juan , XUE Zhen-shan , ZHANG Zhong-sheng , SONG Xiao-lin , ZHANG Hong-ri . Impacts of tidal channels on typical landscapes of wetland in the Yellow River Delta[J]. JOURNAL OF NATURAL RESOURCES, 2019 , 34(12) : 2504 -2515 . DOI: 10.31497/zrzyxb.20191202
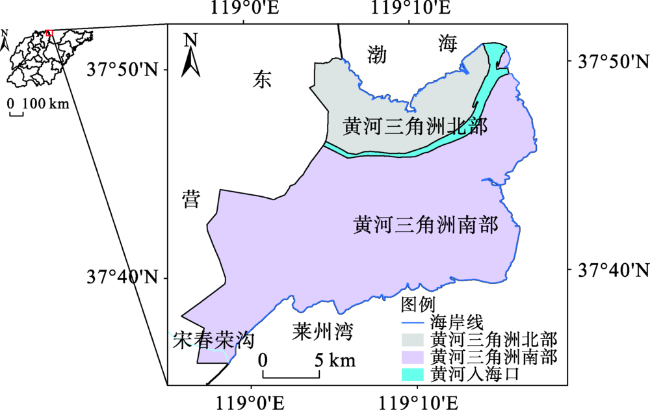
Fig. 1 Study area图1 研究区域 |
Table 1 Remote sensing images used in the present work表1 主要遥感影像的成像时间及类型 |
| 1989年 | 1992年 | 1998年 | 2003年 | 2009年 | 2012年 | 2016年 | ||
|---|---|---|---|---|---|---|---|---|
| 潮沟 | 类型 | SPOT1 | SPOT2 | SPOT4 | SPOT4 | SPOT4 | SPOT4 | OLI |
| 时间 | 08-08 | 02-05 | 04-25 | 10-18 | 12-07 | 05-01 | 08-26 | |
| 景观类型 | 类型 | TM | TM | TM | ETM | ETM | ETM | OLI |
| 时间 | 10-03 | 08-24 | 09-10 | 08-31 | 09-31 | 08-23 | 08-26 |
Table 2 Landscape indexes used in the present work表2 景观格局指数及其描述 |
| 景观格局指数 | 缩写 | 应用尺度 | 描述 | 单位 |
|---|---|---|---|---|
| 斑块面积比 | PLAND | 斑块 | 反映某一斑块类型面积占整个景观面积的百分比,其值越大,则表明该斑块类型越多,为优势斑块类型 | % |
| 斑块密度 | PD | 斑块/景观 | 反映景观破碎化程度,斑块密度越大,则斑块越小,斑块数量越多,景观破碎化程度越高 | 个/km2 |
| 周长—面积分维数 | PAFRAC | 景观 | 反映景观形状的复杂度(1~2),值越接近于1,则表明该景观斑块形状越简单,而越接近于2,则表明景观的斑块形状越不规则,斑块周边越复杂 | — |
Fig. 2 Landscape distribution in the Yellow River Delta during 1989-2016图2 1989-2016年黄河三角洲湿地景观分类 |
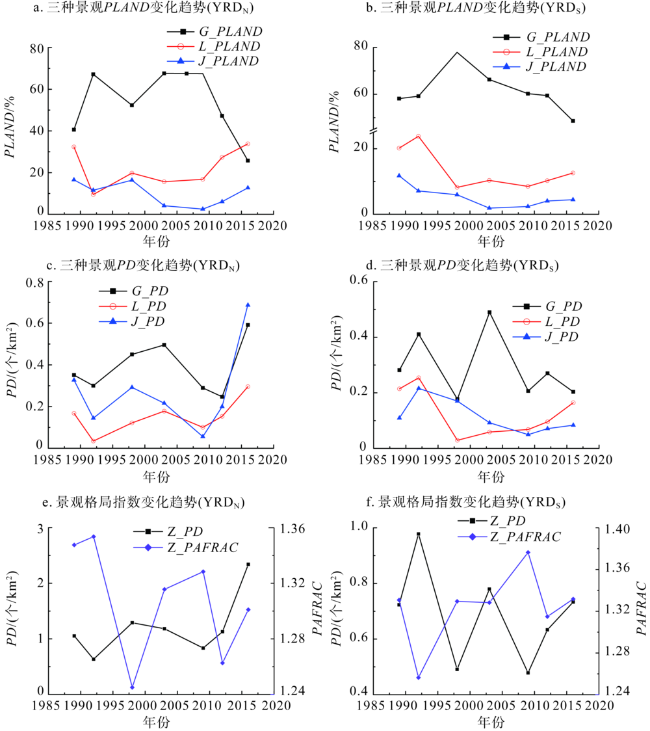
Fig. 3 Changes of landscape indexes of typical types in the Yellow River Delta during 1989-2016图3 1989-2016年黄河三角洲典型景观类型的格局指数变化趋势 |
Table 3 Indexes of tidal channels in the YRDN and YRDS during 1989-2016表3 1989-2016年YRDN和YRDS潮沟发育指标计算结果 |
| 年份 | L | N | d | f | c | D | α | β | γ | |
|---|---|---|---|---|---|---|---|---|---|---|
| YRDN | 1989 | 172.216 | 90 | 1.373 | 0.718 | 1.173 | 1.041 | 0.137 | 1.250 | 0.429 |
| 1992 | 199.961 | 83 | 1.154 | 0.479 | 1.121 | 1.038 | 0.113 | 1.203 | 0.413 | |
| 1998 | 66.237 | 33 | 0.806 | 0.402 | 1.199 | 1.028 | 0.308 | 1.500 | 0.550 | |
| 2003 | 75.055 | 46 | 0.954 | 0.585 | 1.165 | 1.034 | 0.230 | 1.394 | 0.495 | |
| 2009 | 73.671 | 45 | 0.820 | 0.501 | 1.226 | 1.023 | 0.321 | 1.552 | 0.556 | |
| 2012 | 52.070 | 34 | 0.612 | 0.400 | 1.178 | 1.008 | 0.485 | 1.789 | 0.667 | |
| 2016 | 81.071 | 61 | 0.998 | 0.751 | 1.185 | 1.049 | 0.293 | 1.525 | 0.535 | |
| YRDS | 1989 | 328.365 | 186 | 1.381 | 0.782 | 1.126 | 1.053 | 0.044 | 1.081 | 0.365 |
| 1992 | 332.911 | 166 | 1.409 | 0.703 | 1.179 | 1.044 | 0.032 | 1.057 | 0.357 | |
| 1998 | 361.911 | 200 | 0.880 | 0.486 | 1.119 | 1.040 | 0.107 | 1.205 | 0.407 | |
| 2003 | 549.334 | 381 | 1.408 | 0.977 | 1.124 | 1.085 | 0.009 | 1.016 | 0.340 | |
| 2009 | 337.553 | 2267 | 0.883 | 0.594 | 1.131 | 1.049 | 0.121 | 1.234 | 0.416 | |
| 2012 | 348.682 | 240 | 0.856 | 0.589 | 1.130 | 1.051 | 0.119 | 1.231 | 0.415 | |
| 2016 | 339.779 | 260 | 0.947 | 0.725 | 1.129 | 1.060 | 0.111 | 1.215 | 0.409 |
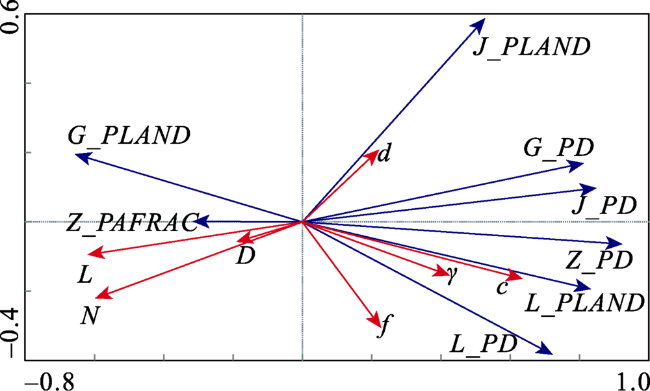
Table 4 Summary of RDA for the first two axes表4 RDA前两轴的统计结果 |
| SPX1 | SPX2 | |
|---|---|---|
| 特征值 | 0.527 | 0.097 |
| 物种—环境相关性 | 0.894 | 0.917 |
| 物种—环境变异累计百分比/% | 72.3 | 85.7 |
| 前两轴相关性 | 0.0214 | |
Fig. 4 RDA results between tidal development index and landscape index of typical vegetation图4 潮沟发育指标与景观格局RDA排序结果 |
| [1] |
|
| [2] |
[
|
| [3] |
|
| [4] |
[
|
| [5] |
[
|
| [6] |
|
| [7] |
[
|
| [8] |
[
|
| [9] |
[
|
| [10] |
[
|
| [11] |
[
|
| [12] |
[
|
| [13] |
[
|
| [14] |
[
|
| [15] |
[
|
| [16] |
[
|
| [17] |
|
| [18] |
[
|
| [19] |
|
| [20] |
[
|
| [21] |
[
|
| [22] |
|
| [23] |
[
|
| [24] |
[
|
| [25] |
|
| [26] |
[
|
| [27] |
[
|
| [28] |
[
|
| [29] |
[
|
| [30] |
[
|
| [31] |
[
|
| [32] |
[
|
/
| 〈 |
|
〉 |
