
JOURNAL OF NATURAL RESOURCES >
Vegetation cover change and ecological effect assessment in the Loess Plateau of Southwest Shanxi province based on remote sensing image
Received date: 2019-02-27
Request revised date: 2019-06-10
Online published: 2019-08-28
Copyright
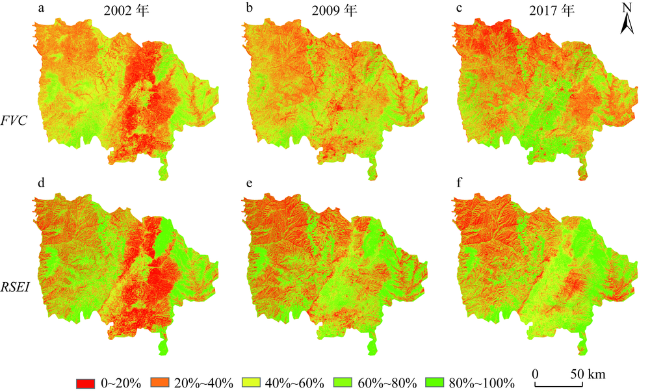
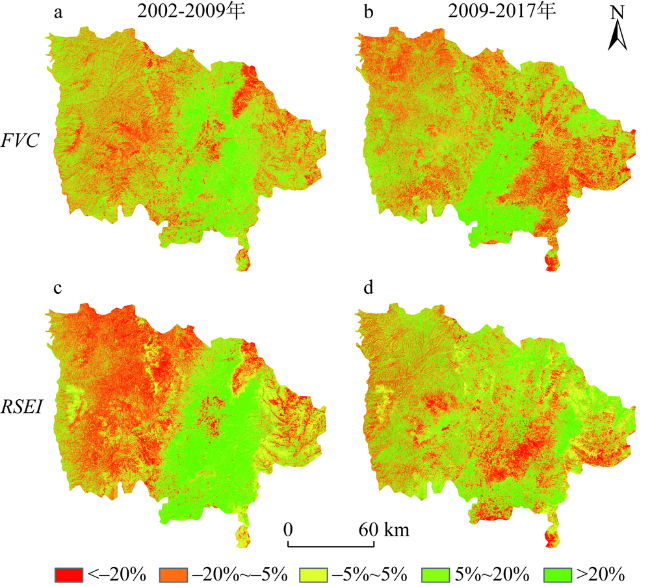
Soil erosion and ecological degradation are serious problems for the Loess Plateau, which have seriously restricted economic development. Based on TM and OLI data, the FVC and RSEI in the Loess Plateau of Southwest Shanxi were estimated in this paper, and the effects of vegetation and ecological restoration were quantitatively analyzed. The results show that: (1) The index of FVC increased from 42.69% in 2002 to 47.67% in 2017, and the index of RSEI increased from 45% in 2002 to 52.5% in 2017, indicating a significant improvement of the ecological quality in the study area. (2) The ecological environment in most parts of the study area has been improved. Ecological degradation occurred in the Zhihe River Basin, Fenhe River Valley and Qinhe River Basin. (3) Due to the large-scale planting of winter wheat in the Fenhe River Valley, the index of FVC has been improved to some extent, but the index of RSEI has not been significantly improved. The variation trend of FVC and RSEI in other areas is basically consistent.
ZHANG Wen-qiang , SUN Cong-jian , LI Xin-gong . Vegetation cover change and ecological effect assessment in the Loess Plateau of Southwest Shanxi province based on remote sensing image[J]. JOURNAL OF NATURAL RESOURCES, 2019 , 34(8) : 1748 -1758 . DOI: 10.31497/zrzyxb.20190814
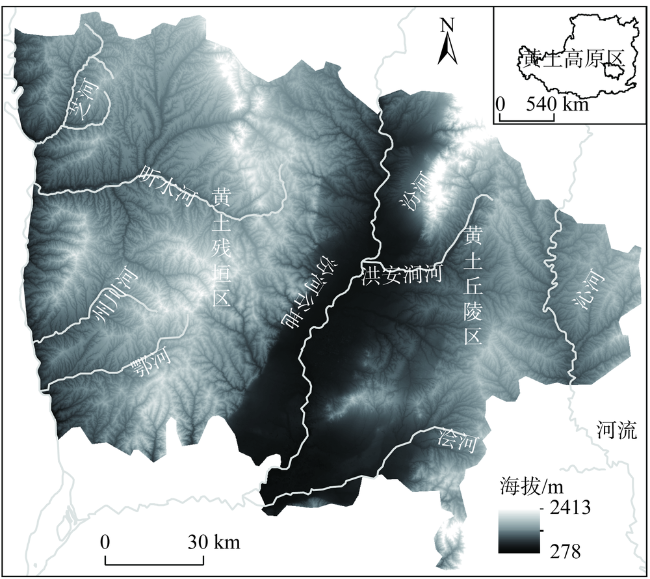
Fig. 1 Topography and river distribution in the study area图1 研究区地形及河流分布 |
Table 1 Proportion of vegetation coverage at all levels表1 各级植被覆盖度所占比例表 |
| 植被覆盖度等级 | 分级标准/% | 各级别所占比例/% | 相邻年份变化幅度/% | ||||
|---|---|---|---|---|---|---|---|
| 2002年 | 2009年 | 2017年 | 2002-2009年 | 2009-2017年 | |||
| 低覆盖度 | 0~20 | 10.86 | 7.89 | 12.07 | -2.97 | 4.18 | |
| 较低覆盖度 | 20~40 | 33.94 | 33.68 | 34.57 | -0.26 | 0.89 | |
| 中覆盖度 | 40~60 | 38.97 | 37.77 | 26.26 | -1.2 | -11.51 | |
| 较高覆盖度 | 60~80 | 12.77 | 14.51 | 11.39 | 1.74 | -3.12 | |
| 高覆盖度 | 80~100 | 3.45 | 6.14 | 15.71 | 2.69 | 9.57 | |
| 植被覆盖度均值 | 42.69 | 45.61 | 47.67 | 2.92 | 2.06 | ||
| 森林植被覆盖度 | 57.28 | 53.28 | 51.59 | -4 | -1.69 | ||
Fig. 2 FVC and RSEI classification map of each year in the study area图2 研究区各年份植被覆盖度(FVC)和遥感生态指数(RSEI)分级 |
Table 2 Principal component analysis of remote sensing ecological index表2 遥感生态指数主成分分析 |
| 年份 | 第一主成分PC1 | 第二主成分PC2 | 第三主成分PC3 | 第四主成分PC4 | |
|---|---|---|---|---|---|
| 2002 | LST | 0.421 | 0.886 | -0.037 | 0.192 |
| NDSI | 0.556 | -0.388 | 0.36 | 0.641 | |
| WET | -0.468 | 0.045 | -0.51 | 0.72 | |
| NDVI | -0.543 | 0.251 | 0.78 | 0.184 | |
| 特征值 | 0.2377 | 0.0042 | 0.0028 | 0.0006 | |
| 特征值贡献率/% | 96.9 | 1.71 | 1.14 | 0.25 | |
| 2009 | LST | -0.426 | -0.287 | 0.783 | -0.352 |
| NDSI | -0.543 | 0.099 | -0.544 | -0.633 | |
| WET | 0.674 | -0.434 | -0.059 | -0.595 | |
| NDVI | 0.264 | 0.849 | 0.297 | -0.349 | |
| 特征值 | 0.1973 | 0.0046 | 0.004 | 0.0026 | |
| 特征值贡献率/% | 94.63 | 2.21 | 1.92 | 1.24 | |
| 2017 | LST | 0.582 | 0.793 | 0.08 | 0.162 |
| NDSI | 0.674 | -0.594 | 0.135 | 0.418 | |
| WET | -0.379 | 0.126 | -0.268 | 0.877 | |
| NDVI | -0.251 | 0.053 | 0.951 | 0.174 | |
| 特征值 | 0.133 | 0.0063 | 0.0044 | 0.0009 | |
| 特征值贡献率/% | 91.98 | 4.36 | 3.04 | 0.62 |
Table 3 Mean changes of four indicators and RSEI in each year of the study area表3 研究区各年份四个指标和遥感生态指数RSEI的均值变化 |
| 年份 | 热度LST | 干度NDSI | 湿度WET | 绿度NDVI | 遥感生态指数RSEI |
|---|---|---|---|---|---|
| 2002 | 0.515 | 0.605 | 0.583 | 0.502 | 0.487 |
| 2009 | 0.589 | 0.624 | 0.711 | 0.513 | 0.502 |
| 2017 | 0.535 | 0.632 | 0.842 | 0.53 | 0.525 |
Table 4 Changes in ecological grades in the study area (%)表4 研究区生态等级变化 |
| 遥感生态指数等级 | 分级标准 | 各级别所占比例 | 相邻年份变化幅度 | ||||
|---|---|---|---|---|---|---|---|
| 2002年 | 2009年 | 2017年 | 2002-2009年 | 2009-2017年 | |||
| 差 | 0~20 | 23.08 | 20.1 | 12.55 | -2.98 | -7.55 | |
| 较差 | 20~40 | 26.18 | 17.34 | 22.51 | -8.84 | 5.17 | |
| 中等 | 40~60 | 19.82 | 21 | 27.15 | 1.18 | 6.15 | |
| 良好 | 60~80 | 14.04 | 23.57 | 19.46 | 9.53 | -4.11 | |
| 优秀 | 80~100 | 16.87 | 17.99 | 18.33 | 1.12 | 0.34 | |
Fig. 3 Spatial variation of FVC and RSEI in the study area图3 研究区FVC和RSEI空间变化特征 |
Table 5 Spatial variation statistics of FVC and RSEI in the study area (%)表5 研究区FVC和RSEI空间变化统计 |
| 分级标准 | 植被覆盖度各级所占比例 | 遥感生态指数各级所占比例 | ||||
|---|---|---|---|---|---|---|
| 2002-2009年 | 2009-2017年 | 2002-2009年 | 2009-2017年 | |||
| 严重退化区 | <-20 | 11.09 | 15.17 | 11.26 | 12.26 | |
| 轻微退化区 | -20~-5 | 25.06 | 25.07 | 23.22 | 21.74 | |
| 稳定区 | -5~5 | 21.89 | 20.75 | 20.14 | 25.22 | |
| 轻微改善区 | 5~20 | 24.71 | 19.78 | 21.08 | 23.94 | |
| 显著改善区 | >20 | 17.25 | 19.23 | 24.30 | 16.84 | |
Table 6 Correlation coefficients between FVC and RSEI表6 FVC与RSEI的相关系数 |
| 2002年 | 2009年 | 2017年 | |
|---|---|---|---|
| 植被覆盖度 | |||
| 遥感生态指数 | 0.684 | 0.66 | 0.64 |
| 三年平均相关度 | 0.66 | ||
| [1] |
[
|
| [2] |
[
|
| [3] |
[
|
| [4] |
[
|
| [5] |
[
|
| [6] |
[
|
| [7] |
[
|
| [8] |
[
|
| [9] |
[
|
| [10] |
[
|
| [11] |
[
|
| [12] |
[
|
| [13] |
中华人民共和国中央人民政府. 国务院关于全国水土保持规划(2015-2030年)的批复. [2015-10-17].
[The Central People's Government of the People's Republic of China. Approval of State Council about Plan for National Water and Soil Conservation of 2015 to 2030. [2015-10-17].
|
| [14] |
[
|
| [15] |
[
|
| [16] |
[
|
| [17] |
[
|
| [18] |
[
|
| [19] |
[
|
| [20] |
[
|
| [21] |
[
|
| [22] |
[
|
| [23] |
[
|
| [24] |
古丽·加帕尔,
[
|
| [25] |
[
|
| [26] |
|
| [27] |
[
|
| [28] |
[
|
| [29] |
[
|
| [30] |
[
|
| [31] |
|
| [32] |
[
|
| [33] |
[
|
| [34] |
[
|
/
| 〈 |
|
〉 |