
JOURNAL OF NATURAL RESOURCES >
The vulnerability assessment and driving mechanism analysis of China's food security system
Received date: 2019-01-30
Request revised date: 2019-05-11
Online published: 2019-08-28
Copyright
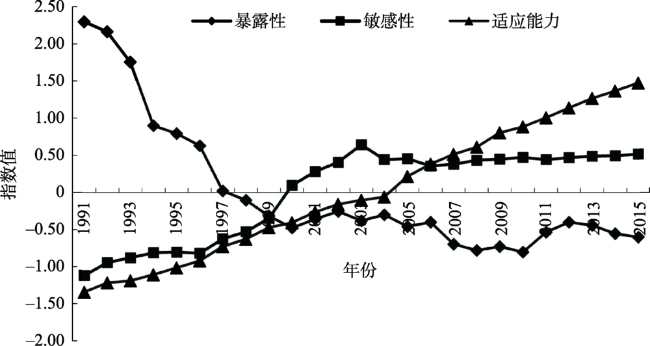
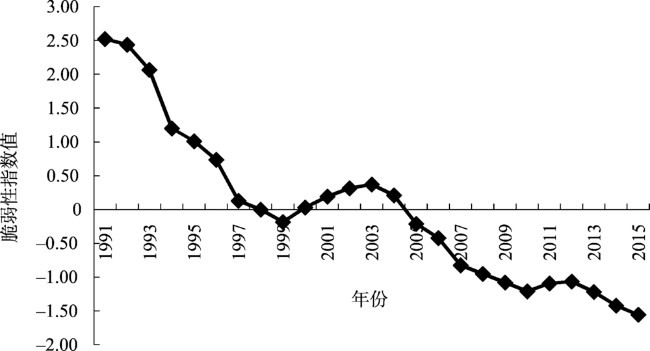
China has attained lots of achievements in maintaining its food security in the past two decades. However, the food security system of China is still faced with great challenges and has its typical vulnerability characteristics. From the perspective of food security system, using the VSD (vulnerability acoping siagram) analysis framework, the evaluation index system of food security vulnerability in China was constructed in three dimensions of exposure, sensitivity and adaptive capacity. Based on the statistical data in China from 1991 to 2015, we used the method of principal component analysis to examine the changing characteristics of exposure index, sensitivity index and adaptive capacity index, and revealed the overall trend of food security system vulnerability and its driving factors. The results showed that: (1) The development of exposure index can be divided into rapid decrease stage (1991-2000) and slow decrease stage (2001-2015), and its annual average decline value is 0.121; the development of sensitivity index can be divided into rapid increase stage (1991-2003) and relatively steady stage (2004-2015), while the adaptive capacity index shows a continuous increasing trend during the period of 1991 to 2015, and its annual average increase value is 0.117. (2) The index of food security system vulnerability in China is overall on the decrease, which means that the state of food security in China has been greatly improved. And the changing process of the food security system vulnerability can be divided into three stages of 1991-1999, 2000-2003 and 2003-2015, the first and second stages happened in the age of lower food security level of merely eradicating hunger, and the second decrease stage was in the age of higher food security level of eating more diversified food. (3) The four factors which induced to the change of food security vulnerability in China are per capita GDP, urbanization rate, annual per capita disposable income of urban households (ACDIUH), and annual per capita disposable income of rural households (ACDIRH). In the second stage (2000-2015), the driving effect of the four factors was much smaller than that of the first stage (1991-1999), and the leading driving factor in the first stage was ACDIRH, while in the second stage, the leading driving factors were per capita GDP and ACDIUH. At last, some suggestions are proposed to lower China's food security vulnerability, such as to promote economic growth, increase urban and rural residents' income to eradicate poverty and propel new urbanization.
Key words: food security; vulnerability; driving mechanism; VSD analysis framework; China
YAO Cheng-sheng , YIN Wei , LI Zheng-tong . The vulnerability assessment and driving mechanism analysis of China's food security system[J]. JOURNAL OF NATURAL RESOURCES, 2019 , 34(8) : 1720 -1734 . DOI: 10.31497/zrzyxb.20190812
Table 1 Evaluation index system of food security vulnerability in China表1 中国粮食安全脆弱性评价指标体系 |
| 要素层 | 一级指标 | 单项指标 | 相关性 | 单位 | 指标计算/解释 |
|---|---|---|---|---|---|
| 暴露性 | 粮食生产条件 | 单位粮食播种面积劳动力(E1) | + | 人/hm2 | 粮食生产劳动力总量/粮食播种面积 |
| 单位粮食播种面积用水量(E2) | – | m3/hm2 | 粮食生产用水总量/粮食作物播种面积 | ||
| 农作物成灾率(E3) | + | % | 反映粮食生产受灾害的影响程度 | ||
| 粮食供给量与稳定性 | 表征粮食自给率(E4) | – | % | 粮食产量/(粮食产量+进口量–出口量) | |
| 粮食获取能力和利用水平 | 粮食短缺程度(E5) | + | kcal/人/天 | 达到规定标准所缺乏的能量数量 | |
| 粮食不足发生率(E6) | + | % | 未能满足健康生活的膳食需要的人口所占比例 | ||
| 动物性蛋白质平均供应量(E7) | – | g/人/天 | 每天人均摄入的动物性蛋白重量 | ||
| 农村贫困发生率(E8) | + | % | 农村贫困人口/农村总人口 | ||
| 敏感性 | 粮食生产条件 | 农业生产资料价格指数(S1) | + | % | 反映一定时期内农业生产资料成本变动趋势和程度 |
| 粮食作物播种面积所占比例(S2) | – | % | 粮食作物播种面积/农作物总播种面积 | ||
| 非农产业产值比例(S3) | – | % | 二、三产业产值/国民经济总产值 | ||
| 粮食供给量与稳定性 | 粮食净进口量(S4) | + | 万t | 粮食进口量–粮食出口量 | |
| 人均粮食占有量(S5) | – | kg | 粮食产量/人口总量 | ||
| 粮食获取能力和利用水平 | 粮食类居民消费价格指数(S6) | + | % | 反映粮食消费品价格变动趋势和程度 | |
| 恩格尔系数(S7) | + | % | 食品支出总额占个人消费支出总额的比例 | ||
| 营养不良发生率(S8) | + | % | 营养不良人口/总人口 | ||
| 适应 能力 | 粮食生产条件 | 财政支农支出(AC1) | + | 亿元 | 用于支持农业发展的财政支出 |
| 单位粮食播种面积农业机械动力(AC2) | + | kW/hm2 | 粮食生产农业机械总动力/粮食作物播种面积 | ||
| 单位粮食播种面积化肥施用量(AC3) | + | kg/hm2 | 粮食生产化肥施用量/粮食作物播种面积 | ||
| 单位粮食播种面积农药施用量(AC4) | + | kg/hm2 | 粮食生产农药施用量/粮食作物播种面积 | ||
| 有效灌溉率(AC5) | + | % | 有效灌溉面积/耕地总面积 | ||
| 粮食供给量与稳定性 | 粮食总产量波动率(AC6) | – | % | (当年粮食产量-上年粮食产量)/上年粮食产量 | |
| 粮食获取能力和利用水平 | 农民非农业生产收入所占比例(AC7) | + | % | 农民非农业收入/农民总收入 | |
| 改良水源获取水平(AC8) | + | % | 获取改良水源人口/总人口 | ||
| 改良卫生设施获取水平(AC9) | + | % | 获取改良卫生设施人口/总人口 | ||
| 道路密集度(AC10) | + | km/km2 | 每平方千米土地面积道路长度 |
Table 2 Rotated factor loading Matrix in the three subsystems of exposure, sensitivity and adaptive capacity表2 暴露性、敏感性和适应能力子系统旋转后的因子载荷矩阵 |
| 暴露性 | 敏感性 | 适应能力 | ||||||||
|---|---|---|---|---|---|---|---|---|---|---|
| 单项指标 | 单项指标 | 单项指标 | ||||||||
| E1 | 0.006 | 0.211 | S1 | 0.034 | 0.194 | AC1 | 0.093 | 0.116 | ||
| E2 | -0.438 | 0.306 | S2 | 0.391 | -0.252 | AC2 | 0.116 | 0.005 | ||
| E3 | -0.325 | 0.548 | S3 | -0.253 | 0.054 | AC3 | 0.123 | -0.071 | ||
| E4 | 0.273 | -0.503 | S4 | 0.285 | -0.456 | AC4 | 0.125 | -0.103 | ||
| E5 | 0.235 | -0.054 | S5 | -0.043 | 0.258 | AC5 | 0.117 | 0.002 | ||
| E6 | 0.415 | -0.271 | S6 | 0.001 | 0.225 | AC6 | -0.084 | 0.966 | ||
| E7 | 0.178 | 0.017 | S7 | -0.283 | 0.092 | AC7 | 0.109 | 0.047 | ||
| E8 | 0.071 | 0.136 | S8 | -0.137 | -0.082 | AC8 | 0.122 | -0.057 | ||
| — | — | — | — | — | — | AC9 | 0.124 | -0.082 | ||
| — | — | — | — | — | — | AC10 | 0.104 | 0.084 | ||
| 特征值 | 6.842 | 0.783 | — | 6.240 | 1.462 | — | 8.584 | 1.009 | ||
| 贡献率 | 84.529 | 10.791 | — | 77.997 | 18.278 | — | 85.837 | 10.089 | ||
| 累计贡献率 | 84.529 | 95.320 | — | 77.997 | 96.275 | — | 85.837 | 95.926 | ||
Fig. 1 Changes in the three subsystems of food security vulnerability in China from 1991 to 2015图1 1991-2015年中国粮食安全脆弱性三要素得分变化 |
Fig. 2 Changes in food security vulnerability index in China from 1991 to 2015图2 1991-2015年我国粮食安全脆弱性得分变化 |
Table 3 Regression of factors inducing to food security vulnerability in China表3 中国粮食安全脆弱性驱动因子回归分析 |
| 时段/年 | 主成分因子 | 非标准化系数 | 标准化系数 | T统计量 | Sig. |
|---|---|---|---|---|---|
| 1991-1999 | 常数 | 1.102 | 15.727 | 0.000 | |
| F1 | -0.996 | -0.982 | -13.781 | 0.000 | |
| 2000-2015 | 常数 | -0.620 | -9.501 | 0.000 | |
| F2 | -0.620 | -0.928 | -9.293 | 0.000 | |
| 时段/年 | R2 | 调整后R2 | F | Sig. | |
| 1991-1999 | 0.964 | 0.959 | 189.920 | 0.000 | |
| 2000-2015 | 0.861 | 0.851 | 86.364 | 0.000 |
| [1] |
[
|
| [2] |
[
|
| [3] |
|
| [4] |
[
|
| [5] |
[
|
| [6] |
[
|
| [7] |
[
|
| [8] |
[
|
| [9] |
[
|
| [10] |
[
|
| [11] |
[
|
| [12] |
[
|
| [13] |
[
|
| [14] |
[
|
| [15] |
FAO. The state of food insecurity in the world 2013: The multiple dimensions of food security. Rome, 2013.
|
| [16] |
|
| [17] |
|
| [18] |
|
| [19] |
[
|
| [20] |
[
|
| [21] |
[
|
| [22] |
|
| [23] |
[
|
| [24] |
[
|
| [25] |
[
|
| [26] |
[
|
| [27] |
[
|
| [28] |
[
|
| [29] |
[
|
| [30] |
[
|
| [31] |
|
| [32] |
|
| [33] |
|
| [34] |
|
| [35] |
[
|
/
| 〈 |
|
〉 |