
JOURNAL OF NATURAL RESOURCES >
The spatio-temporal evolution characteristics of landscape fragmentation in Fenhe River Basin
Received date: 2018-10-10
Request revised date: 2019-05-20
Online published: 2019-08-28
Copyright
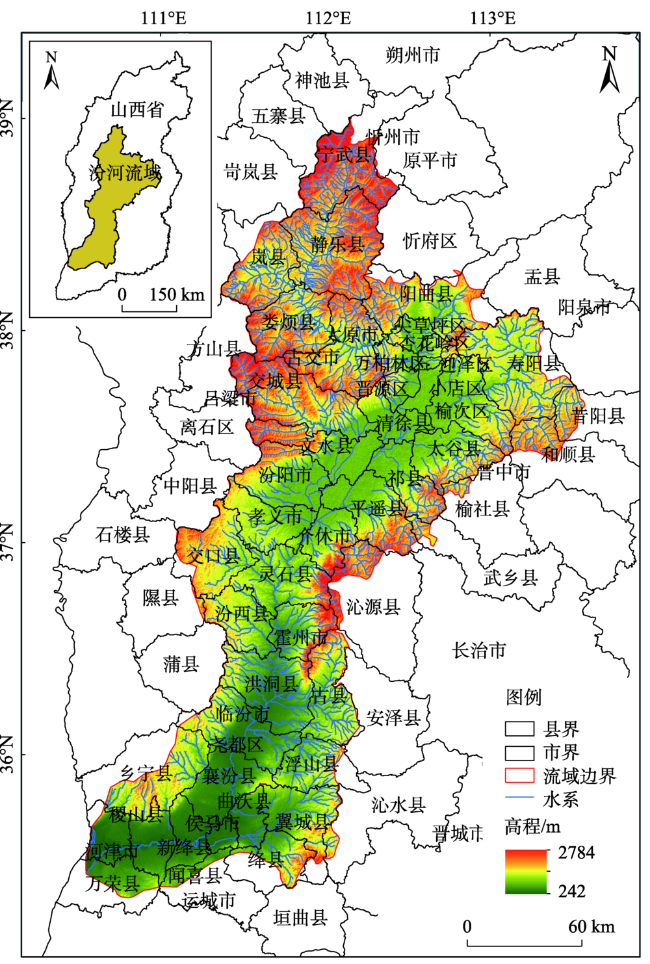
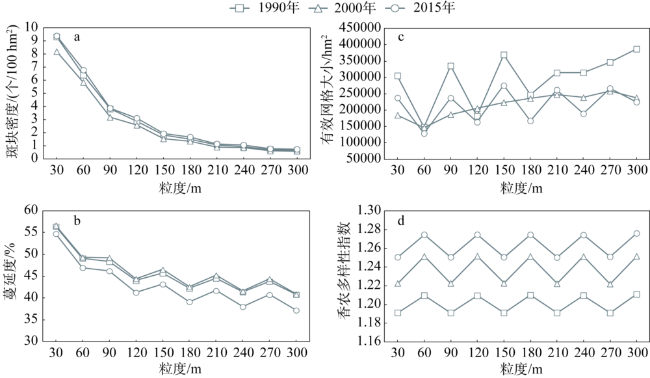
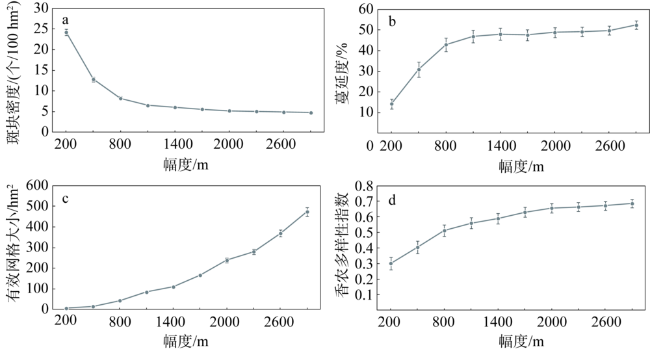
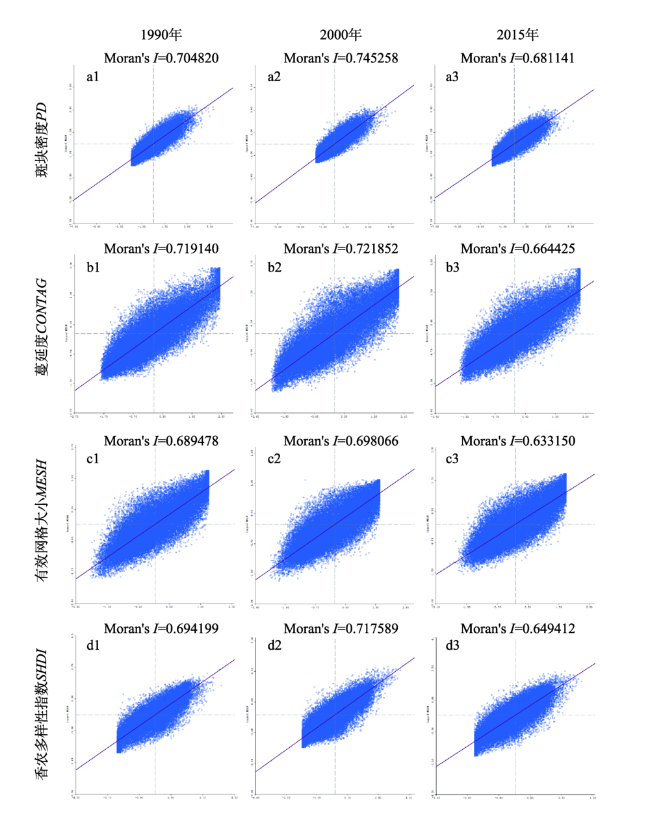
There is fragmented land and fragile ecological environment in the loess hilly and gully region. With the rapid population growth and socio-economic development in recent years, the degree of fragmentation has been further aggravated. Therefore, based on the interpretation data of remote sensing images in 1990, 2000 and 2015, this paper uses Fragstats 4.2 to obtain the best analysis scale combined with the standard method and moving window method. On this basis, the spatial differentiation characteristics of each landscape index are explored; The spatial and temporal evolution process of watershed landscape fragmentation is revealed; The spatial autoregressive model is used to analyze the impact factors contributing to landscape fragmentation. The results show that with the change of grain size and extent, some landscape indices show a regularity to certain degree. The 90 m grid size and 900 m square window size are the best analysis scales in the Fenhe River Basin; patch density, contagion, effective grid size, and Shannon's diversity index have a spatial agglomeration effect in the three periods, and the spatial agglomeration type distribution has strong similarity. From 1990 to 2015, the spatial pattern of landscape fragmentation in the study area has obviously changed; the slope, elevation and distance from the construction land are the main factors affecting landscape fragmentation of river basin during the three periods. The research results can provide reference for landscape fragmentation analysis in Northwest China, and provide basis for future regional landscape pattern optimization and effective land management.
Key words: analysis scale; landscape fragmentation; driving force; Fenhe River Basin
FU Yang-jun , SHI Xue-yi , HE Juan . The spatio-temporal evolution characteristics of landscape fragmentation in Fenhe River Basin[J]. JOURNAL OF NATURAL RESOURCES, 2019 , 34(8) : 1606 -1619 . DOI: 10.31497/zrzyxb.20190804
Fig. 1 The location of the Fenhe River Basin图1 研究区地理位置 |
Fig. 2 Change curve of landscape index with spatial grain size图2 景观指数随空间粒度变化曲线 |
Fig. 3 Change curve of landscape index with spatial extent图3 景观指数随空间幅度变化曲线 |
Fig. 4 Moran scatter plot of landscape index图4 景观指数Moran散点分布 |
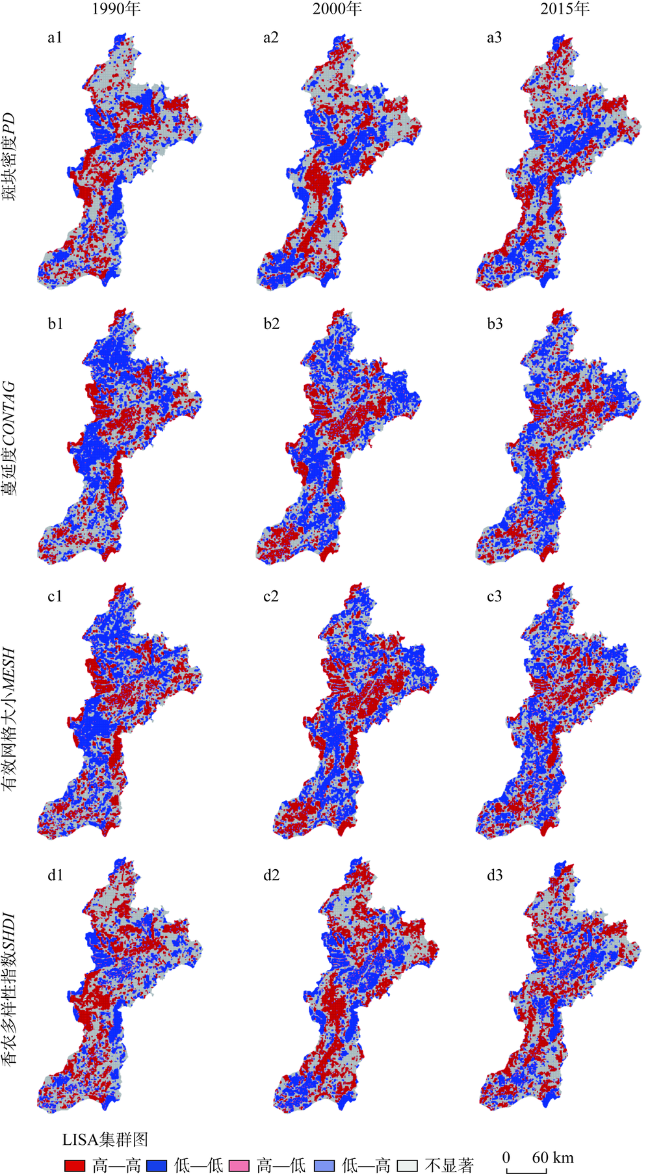
Fig. 5 LISA cluster graph of local spatial autocorrelation of landscape index图5 景观指数局部空间自相关LISA集群 |
Table 1 Principal component analysis results of landscape indices in three periods表1 3个时期景观指数主成分分析结果 |
| 年份 | KMO | 景观指数 | 公因子方差 | 成分 | 初始特征值 | 主成分 | |||
|---|---|---|---|---|---|---|---|---|---|
| 初始 | 提取 | 特征值 | 方差贡献率/% | 累计方差贡献率/% | 1 | ||||
| 1990 | 0.770 | CONTAG | 1.00 | 0.819 | 1 | 3.380 | 84.505 | 84.505 | 0.905 |
| MESH | 1.00 | 0.937 | 2 | 0.445 | 11.133 | 95.637 | 0.968 | ||
| PD | 1.00 | 0.682 | 3 | 0.134 | 3.342 | 98.980 | -0.826 | ||
| SHDI | 1.00 | 0.942 | 4 | 0.041 | 1.020 | 100.000 | -0.971 | ||
| 2000 | 0.778 | CONTAG | 1.00 | 0.835 | 1 | 3.416 | 85.399 | 85.399 | 0.914 |
| MESH | 1.00 | 0.938 | 2 | 0.411 | 10.286 | 95.685 | 0.969 | ||
| PD | 1.00 | 0.699 | 3 | 0.135 | 3.370 | 99.055 | -0.836 | ||
| SHDI | 1.00 | 0.943 | 4 | 0.038 | 0.945 | 100.000 | -0.971 | ||
| 2015 | 0.758 | CONTAG | 1.00 | 0.794 | 1 | 3.317 | 82.937 | 82.937 | 0.891 |
| MESH | 1.00 | 0.935 | 2 | 0.483 | 12.082 | 95.019 | 0.967 | ||
| PD | 1.00 | 0.655 | 3 | 0.156 | 3.912 | 98.931 | -0.809 | ||
| SHDI | 1.00 | 0.934 | 4 | 0.043 | 1.069 | 100.000 | -0.966 | ||
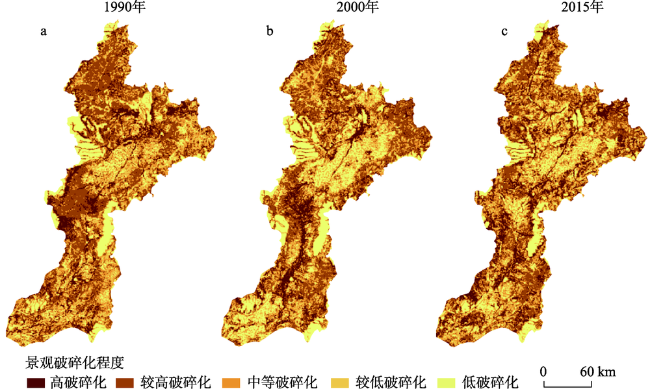
Fig. 6 Spatial distribution pattern of landscape fragmentation in three periods图6 景观破碎化程度空间分布格局 |
Table 2 Comparison of fitting results of spatial lag model and spatial error model of different impact factors表2 不同影响因子空间滞后模型和空间误差模型拟合结果对比 |
| 自回归模型 | R2 | LIK | AIC | SC | 驱动因子 | 回归系数 | Z值 | P值 |
|---|---|---|---|---|---|---|---|---|
| 空间滞后模型 | 0.763 | -69708 | 139429 | 139491 | 高程 | -0.000095 | -6.003210 | 0.000 |
| 坡度 | 0.017500 | 16.859500 | 0.000 | |||||
| 坡向 | -0.000163 | -1.473480 | 0.141 | |||||
| 距建设用地距离 | 0.000013 | 7.766020 | 0.000 | |||||
| 距水域距离 | -0.000003 | -3.569110 | 0.000 | |||||
| 空间误差模型 | 0.784 | -68458 | 136928 | 136980 | 高程 | 0.002065 | 18.539400 | 0.000 |
| 坡度 | 0.058957 | 27.233100 | 0.000 | |||||
| 坡向 | -0.000140 | -1.060340 | 0.289 | |||||
| 距建设用地距离 | 0.004669 | 40.491100 | 0.000 | |||||
| 距水域距离 | -0.000087 | -6.252210 | 0.000 |
注:LIK:最大似然对数值;AIC:Akaike信息指标;SC:Schwartz指标。 |
| [1] |
[
|
| [2] |
[
|
| [3] |
[
|
| [4] |
|
| [5] |
|
| [6] |
[
|
| [7] |
[
|
| [8] |
[
|
| [9] |
[
|
| [10] |
[
|
| [11] |
[
|
| [12] |
[
|
| [13] |
[
|
| [14] |
[
|
| [15] |
[
|
| [16] |
[
|
| [17] |
中国科学院. 地理空间数据云. (2016-12-01) [2017-08-09].
[Chinese Academy of Sciences. Geospacial Data Cloud. (2016-12-01) [2017-08-09].
|
| [18] |
[
|
| [19] |
|
| [20] |
|
| [21] |
|
| [22] |
[
|
| [23] |
[
|
| [24] |
[
|
| [25] |
[
|
/
| 〈 |
|
〉 |