
JOURNAL OF NATURAL RESOURCES >
The dynamic evolution and its driving mechanism of coordination of rural rejuvenation and new urbanization
Received date: 2019-12-30
Request revised date: 2020-05-12
Online published: 2020-11-27
Copyright
The research reconstructed the index system for rural revitalization and new urbanization, and used the coupling coordination model, spatial Markov chain, and geographic weighted regression model to analyze the coupling between rural revitalization and new urbanization in 30 provinces (autonomous regions and municipalities) of China from 2005 to 2017 in the aspects of coordination level, spatio-temporal differentiation pattern, dynamic evolution of space, and driving mechanisms. The results show that: (1) The degree of coupling and coordination between rural revitalization and new urbanization presents a distribution pattern of "high in the east and low in the southwest"; intermediate coordination areas are gradually spreading to the middle, and the number of high-level coordination areas is increasing. Most of the provinces with advanced coordination type are characterised by "lagging in rural development", and most of them with primary coordination and near-imbalance types are featured by "new urbanization and development lagging". (2) The dynamic evolution of the degree of coupling coordination showed the characteristics of maintaining the stability of the original state, and it was difficult to achieve leapfrog transfer. There is a phenomenon of "club convergence" in the provinces in the advanced coordination stage. The provinces that are shifting upward are mainly concentrated in the central region, and most northern provinces are undergoing downward adjustments. Areas with a low degree of coupling and coordination have a negative spillover effect on the surroundings, while areas with a high degree have a positive effect on neighboring provinces, indicating that the spillover effect is asymmetric. (3) The driving force that affects the change in the degree of coupling and coordination of rural revitalization and new urbanization has a significant spatial difference, showing a development trend of hierarchical band distribution. Government-driven, investment-driven and population-driven forces present a north-south-level band-shaped distribution. Consumption-driven, income-driven, and industry-driven forces present a zonal distribution of east and west levels.
XU Wei-xiang , LI Lu , ZHOU Jian-ping , LIU Cheng-jun . The dynamic evolution and its driving mechanism of coordination of rural rejuvenation and new urbanization[J]. JOURNAL OF NATURAL RESOURCES, 2020 , 35(9) : 2044 -2062 . DOI: 10.31497/zrzyxb.20200902
Table 1 Evaluation index system for rural revitalization and new urbanization表1 乡村振兴与新型城镇化的评价指标体系 |
| 目标层 | 结构指标层 | 具体指标 | 指标含义 |
|---|---|---|---|
| 新型城镇化 (U) | 人口城镇化 | 城镇人口占比/% | 城镇人口/年末总人口×100,+ |
| 第三产业从业人员占比/% | 第三产业从业人员/总就业人员×100,+ | ||
| 城市人口密度/(人/km2) | 城镇人口/建成区面积,+ | ||
| 经济城镇化 | 第三产业产值占比/% | 第三产业产值/地区生产总值×100,+ | |
| 城镇固定资产投资/万元 | 城镇固定资产投资,+ | ||
| 城镇人均可支配收入/(元/人) | 地方财政收/总人口,+ | ||
| 社会城镇化 | 互联网普及率/% | 互联网普及率,+ | |
| 医疗卫生服务/(床/万人) | 卫生机构床位数/总人口,+ | ||
| 教育/年 | 平均受教育年限,+ | ||
| 土地城镇化 | 城镇建成区面积/km2 | 建成区面积,+ | |
| 人均城市道路面积/(m2/人) | 人均道路铺设面积,+ | ||
| 建成区经济密度/(亿元/km2) | 二三产业产值/建成区面积,+ | ||
| 绿色城镇化 | 人均公园绿地面积/(m2/人) | 公园绿地面积/城镇年末常住人口,+ | |
| 生活垃圾清运量/万t | 生活垃圾清运量,+ | ||
| 固体废弃物综合利用率/% | 固体废弃物综合利用率,+ | ||
| 乡村振兴 (R) | 产业兴旺 | 农林牧渔业产值占比/% | 农林牧渔业产值/地区生产总值×100,+ |
| 农业机械化水平/(kW/hm2) | 农业机械总动力/耕地面积,+ | ||
| 作物多元化/% | 非粮播种面积/总播种面积×100,+ | ||
| 生态宜居 | 乡镇每万人卫生院床位数/(床/万人) | 卫生院床位数/乡镇人口,+ | |
| 每公顷耕地化肥施用量/(kg/hm2) | 农用化肥施用量/耕地面积,- | ||
| 人均养老服务机构数量/(个/百人) | 养老服务机构数/年末收养人数,+ | ||
| 乡风文明 | 教育文娱支出占消费支出比/% | 教育文化娱乐支出/消费总支出,+ | |
| 每万人拥有乡镇文化站/(个/万人) | 乡镇文化站个数/农村总人口,+ | ||
| 农村居民平均受教育年限/年 | 农村人口抽样调查计算而得,+ | ||
| 生活富裕 | 农民人均纯收入/(元/人) | 农村居民人均纯收入,+ | |
| 农村每百户移动电话用户数/(部/百户) | 移动电话用户数/农村总农户,+ | ||
| 农村恩格尔系数/% | 农村居民食品消费/消费总额×100,- | ||
| 治理有效 | 有效灌溉率/% | 有效灌溉面积/耕地总面积,+ | |
| 农村卫生厕所普及率/% | 农村卫生厕所普及率,+ | ||
| 农村人口老龄化/% | 65岁及以上人口占比,- |
Table 2 The grade classification of coupling and coordinating degree表2 耦合协调度类别划分标准 |
| 类型 | 数值 | 亚类型 | 子类型 | 耦合协调类型 |
|---|---|---|---|---|
| 协调发展 | 0.7≤ D<1 | 高级协调 | R(a)-U(b)>0.1 | 高级协调—新型城镇化滞后 |
| U(b)-R(a)>0.1 | 高级协调—乡村振兴滞后 | |||
| 0≤|R(a)-U(b)|≤0.1 | 高级协调 | |||
| 转型发展 | 0.6≤ D<0.7 | 中级协调 | R(a)-U(b)>0.1 | 中级协调—新型城镇化滞后 |
| U(b)-R(a)>0.1 | 中级协调—乡村振兴滞后 | |||
| 0≤|R(a)-U(b)|≤0.1 | 中级协调 | |||
| 0.5≤ D<0.6 | 初级协调 | R(a)-U(b)>0.1 | 初级协调—新型城镇化滞后 | |
| U(b)-R(a)>0.1 | 初级协调—乡村振兴滞后 | |||
| 0≤|R(a)-U(b)|≤0.1 | 初级协调 | |||
| 失调衰退 | 0≤ D<0.5 | 濒临失调 | R(a)-U(b)>0.1 | 濒临失调—新型城镇化受阻 |
| U(b)-R(a)>0.1 | 濒临失调—乡村振兴受阻 | |||
| 0≤|R(a)-U(b)|≤0.1 | 濒临失调 |
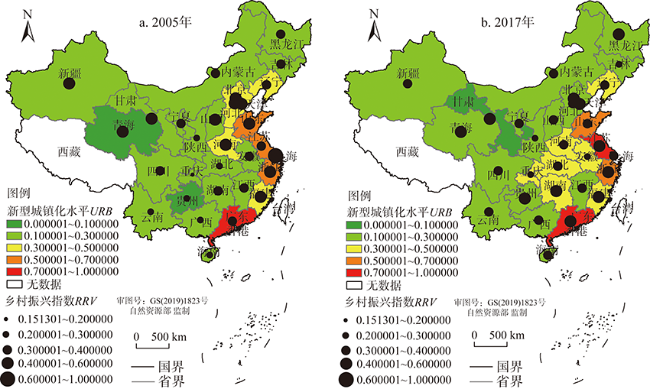
Fig. 1 Spatial evolution pattern of rural revitalization and new urbanization图1 乡村振兴与新型城镇化的空间演进格局 |
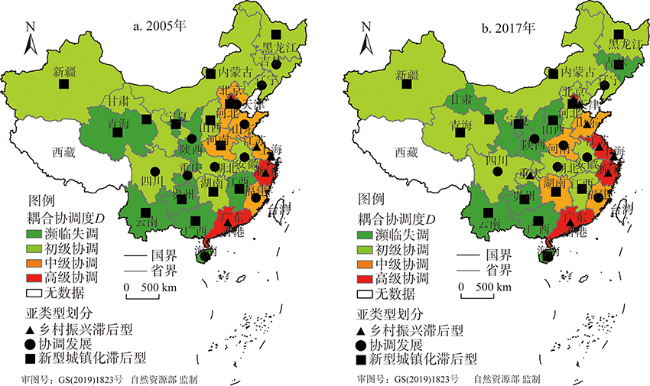
Fig. 2 Spatial differentiation pattern of the degree of coupling and coordination between rural revitalization and new urbanization图2 乡村振兴与新型城镇化耦合协调度的空间分异格局 |
Table 3 Traditional Markov transition probability matrix of coupling coordination degree from 2005 to 2017表3 2005—2017年耦合协调度的传统马尔可夫转移概率矩阵 |
| t/(t+1) | n/个 | 濒临失调 | 初级协调 | 中级协调 | 高级协调 |
|---|---|---|---|---|---|
| 濒临失调 | 82 | 0.8902 | 0.1098 | 0.0000 | 0.0000 |
| 初级协调 | 145 | 0.0621 | 0.8966 | 0.0414 | 0.0000 |
| 中级协调 | 50 | 0.0000 | 0.1200 | 0.7800 | 0.1000 |
| 高级协调 | 83 | 0.0000 | 0.0000 | 0.0602 | 0.9398 |
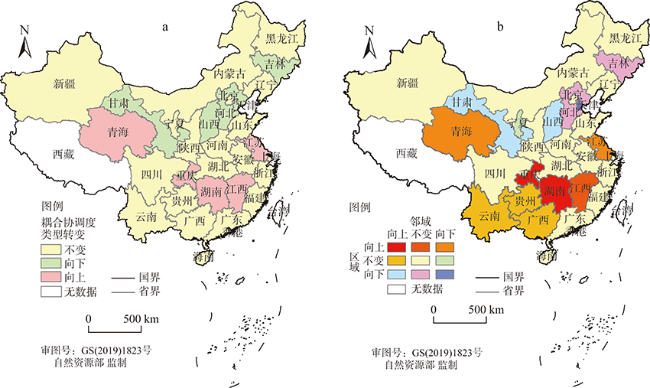
Fig. 3 Spatial distribution pattern of type coordination and neighborhood transfer of the coupling coordination图3 乡村振兴与新型城镇化耦合协调度类型转移及其邻域转移的空间分布格局 |
Table 4 Spatial Markov transition probability matrix of coupling coordination degree from 2005 to 2017表4 2005—2017年耦合协调度的空间马尔可夫转移概率矩阵 |
| 空间滞后 | t/(t+1) | n/个 | 濒临失调 | 初级协调 | 中级协调 | 高级协调 |
|---|---|---|---|---|---|---|
| 濒临失调 | 濒临失调 | 63 | 0.9524 | 0.0476 | 0.0000 | 0.0000 |
| 初级协调 | 28 | 0.1071 | 0.8214 | 0.0714 | 0.0000 | |
| 中级协调 | 5 | 0.0000 | 0.2000 | 0.8000 | 0.0000 | |
| 高级协调 | 0 | 0.0000 | 0.0000 | 0.0000 | 0.0000 | |
| 初级协调 | 濒临失调 | 17 | 0.7647 | 0.2353 | 0.0000 | 0.0000 |
| 初级协调 | 81 | 0.0617 | 0.8889 | 0.0494 | 0.0000 | |
| 中级协调 | 22 | 0.0000 | 0.1818 | 0.8182 | 0.0000 | |
| 高级协调 | 12 | 0.0000 | 0.0000 | 0.0000 | 1.0000 | |
| 中级协调 | 濒临失调 | 1 | 0.0000 | 1.0000 | 0.0000 | 0.0000 |
| 初级协调 | 25 | 0.0000 | 1.0000 | 0.0000 | 0.0000 | |
| 中级协调 | 21 | 0.0000 | 0.0476 | 0.8095 | 0.1429 | |
| 高级协调 | 37 | 0.0000 | 0.0000 | 0.0811 | 0.9189 | |
| 高级协调 | 濒临失调 | 1 | 0.0000 | 1.0000 | 0.0000 | 0.0000 |
| 初级协调 | 11 | 0.0909 | 0.9091 | 0.0000 | 0.0000 | |
| 中级协调 | 2 | 0.0000 | 0.0000 | 0.0000 | 1.0000 | |
| 高级协调 | 34 | 0.0000 | 0.0000 | 0.0588 | 0.9412 |
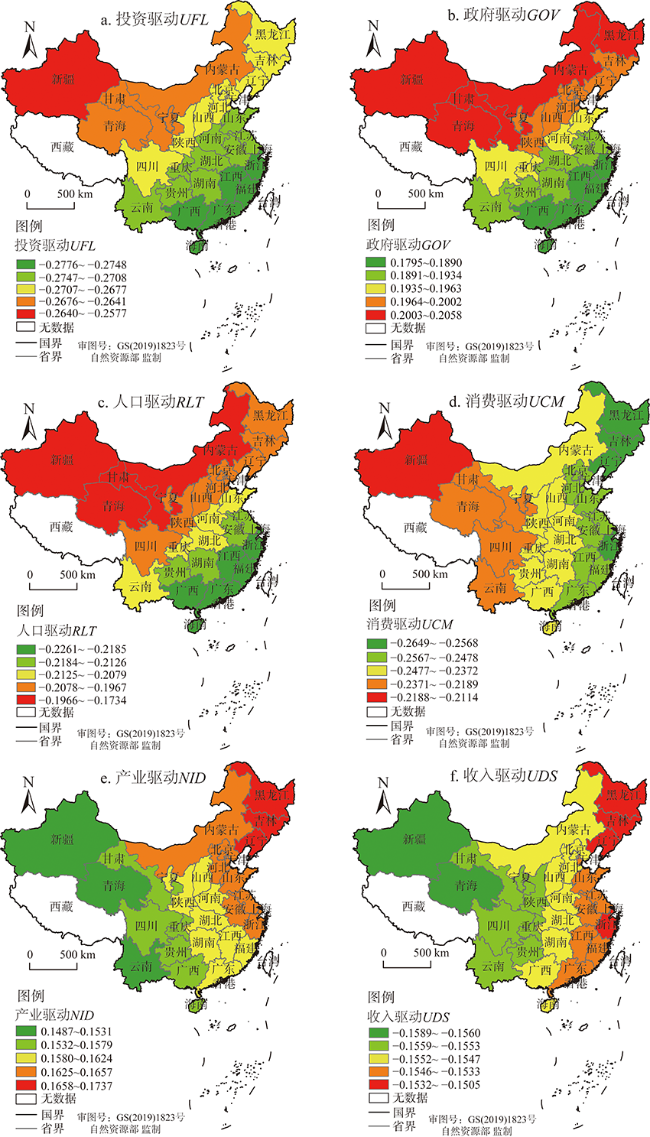
Fig. 4 Estimated distribution of regression coefficients for the coordinated change in the level of coupling between rural development and new urbanization图4 乡村振兴与新型城镇化耦合协调水平变化GWR模型的回归系数估计分布 |
| [1] |
[
|
| [2] |
[
|
| [3] |
[
|
| [4] |
|
| [5] |
|
| [6] |
|
| [7] |
|
| [8] |
|
| [9] |
|
| [10] |
|
| [11] |
|
| [12] |
[
|
| [13] |
[
|
| [14] |
[
|
| [15] |
[
|
| [16] |
[
|
| [17] |
[
|
| [18] |
[
|
| [19] |
[
|
| [20] |
[
|
| [21] |
[
|
| [22] |
[
|
| [23] |
[
|
| [24] |
[
|
| [25] |
[
|
| [26] |
[
|
| [27] |
[
|
| [28] |
[
|
| [29] |
[
|
| [30] |
[
|
| [31] |
[
|
| [32] |
|
| [33] |
[
|
| [34] |
[
|
| [35] |
[
|
/
| 〈 |
|
〉 |