
JOURNAL OF NATURAL RESOURCES >
Using UAV remote sensing for a population census of blue sheep (Pseudois nayaur) in Maduo county, source region of the Yellow River
Received date: 2018-11-06
Request revised date: 2019-01-30
Online published: 2019-05-28
Copyright
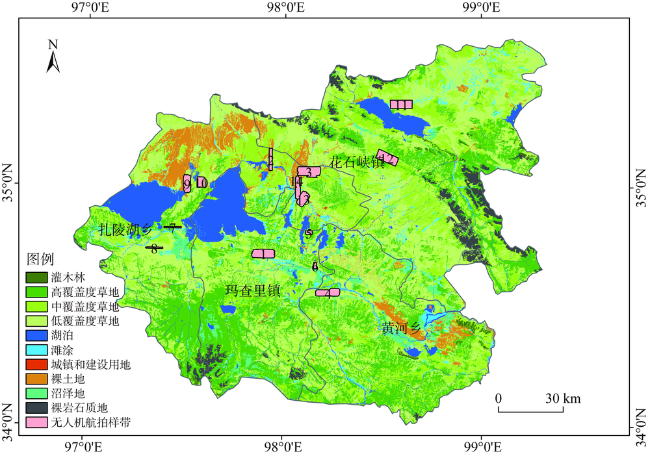
In this study, Maduo county, the source region of the Yellow River, was selected as the research area. In 2017, UAV aerial survey was used to estimate the population of the blue sheep (Pseudois nayaur) and its distribution. The effective area of aerial surveys was 326.6 km2, and 23784 images were acquired. The population in the survey transect was 203, which was identified visually on computer monitors by human observers, and the density was 0.6215/ km2. A total of 12 groups of blue sheep were found in the transects, of which 6 groups had a cluster size of 2-10, accounting for 50% of the total. Estimation of population of blue sheep in Maduo county was 8968, which was based on the relationship of different types of grassland area between transects and the whole county. In this way, the area of non-vegetation types (such as bare stone gravel, water bodies, glaciers, towns, high-speed and national roads) is deducted, and the influence of human disturbance is considered. This avoided overestimation of the blue sheep population. The relationship between the distribution density of blue sheep and ecological factors of habitat was analyzed. Results show that blue sheep preferred an area within 1 km from rural settlements, 3 km away from roads, 1-3 km from water sources, within 200 m from the cliff and with an elevation of 4100-4200 m, vegetation coverage of 0-0.4, slope over 5°, vegetation type of Stipa purpurea + Subordinate grass and Kobresia pygmaea. The environmental factors of the blue sheep habitat may have a correlation with each other, in order to identify the environmental factors that have a major impact on the choice of habitat, and describe the preference more accurately, principal component analysis was carried out. The results showed that altitude, distance from the road and distance from the cliff were the main environmental factors affecting the choice of habitat of blue sheep. In this study, a UAV aerial sampling survey was conducted to estimate the population and density of the blue sheep in the study county. Aided by ArcGIS, the habitat was analyzed. The combination of 3S technology and wildlife surveys provides a new idea for the research on wildlife in the Tibetan Plateau.
GUO Xing-jian , SHAO Quan-qin , YANG Fan , LI Yu-zhe , WANG Yang-chun , WANG Dong-liang . Using UAV remote sensing for a population census of blue sheep (Pseudois nayaur) in Maduo county, source region of the Yellow River[J]. JOURNAL OF NATURAL RESOURCES, 2019 , 34(5) : 1054 -1065 . DOI: 10.31497/zrzyxb.20190512
Fig. 1 UAV flight path over Maduo county图1 玛多县无人机调查飞行样带 |
Table 1 UAV system parameters表1 无人机系统参数 |
| 参数 | 电动固定翼无人机 | 飞马F1000固定翼无人机 |
|---|---|---|
| 翼展 | 1.6 m | 1.6 m |
| 有效载荷 | 0.5 kg | 1.0 kg |
| 最大起飞重量 | 3 kg | 3 kg |
| 发动机 | 电动 | 电动 |
| 续航时间 | 90 min | 60 min |
| 飞行速度 | 72 km/h | 60 km/h |
| 相机型号 | ILCE-5100 | ILCE-5100 |
| 集成相机数量 | 2个(两个相机夹角130°,重叠度50%) | 1个 |
| 焦距 | 30 mm | 30 mm |
| 大小 | 6000×4000像素 | 6000×4000像素 |
Table 2 UAV image parameters表2 无人机影像参数 |
| 参数 | 参数值 |
|---|---|
| 设定航高 | 250 m |
| 拍摄架次 | 14次 |
| 照片数量 | 23784个 |
| 飞行覆盖总面积 | 350 km2 |
| 有效利用面积 | 326.6 km2 |
| 设定分辨率 | 0.05 m |
| 实际分辨率 | 0.04~0.07 m |
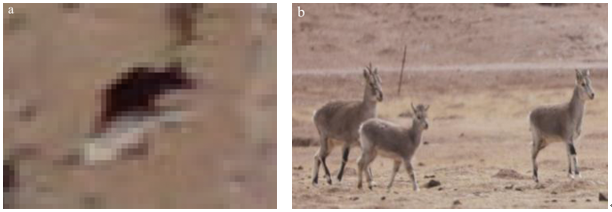
Fig. 2 Blue sheep individual photographed by UAV (left) and on the ground (right)图2 无人机航拍岩羊个体(左)与地面拍摄岩羊外观形态(右) |
Table 3 Population size of blue sheep in transects surveyed by UAV in Maduo county in 2017表3 2017年玛多县无人机调查样带岩羊种群规模统计 |
| 种群规模/只 | 岩羊 | |
|---|---|---|
| 群数/群 | 头只数/只 | |
| 1 | 0 (0) | 0 (0) |
| 2~10 | 6 (50%) | 31 (15.27%) |
| 11~20 | 3 (25%) | 52 (25.62%) |
| 21~50 | 2 (16.67%) | 64 (27.47%) |
| ≥51 | 1 (8.33%) | 56 (31.53%) |
| 共计 | 12 (100%) | 203 (100%) |
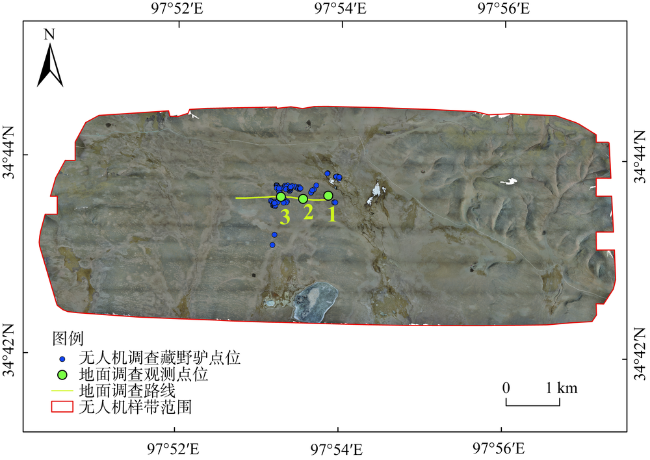
Fig. 3 Ground survey transect and aerial survey transect on April 9th, 2017图3 2017年4月9日无人机调查样带与地面同步调查路线 |
Table 4 Selectivity of blue sheep for environmental factors表4 岩羊对环境因子的选择性 |
| 项目 | 因子 | 调查样方数/个 | 岩羊选择样方数/个 | 选择性 | ||
|---|---|---|---|---|---|---|
| 距农村居民点距离/km | ≤1 | 47191 | 18 | 0.71 | 0.36 | PS |
| 1~2 | 167257 | 23 | 0.25 | -0.13 | NS | |
| >2 | 142020 | 3 | 0.04 | -0.79 | NS | |
| 距公路距离/km | ≤1 | 31711 | 1 | 0.14 | -0.40 | NS |
| 1~3 | 64448 | 2 | 0.14 | -0.41 | NS | |
| >3 | 260309 | 41 | 0.72 | 0.36 | PS | |
| 距水源距离/km | ≤1 | 293799 | 21 | 0.16 | -0.35 | NS |
| 1~3 | 61738 | 23 | 0.84 | 0.43 | PS | |
| >3 | 931 | 0 | 0 | -1.00 | NOS | |
| 植被盖度 | 0≤FC<0.2 | 72385 | 18 | 0.61 | 0.51 | PS |
| 0.2≤FC<0.4 | 187117 | 24 | 0.31 | 0.22 | PS | |
| 0.4≤FC<0.6 | 63090 | 2 | 0.08 | -0.44 | NS | |
| 0.6≤FC<0.8 | 20482 | 0 | 0 | -1.00 | NOS | |
| 0.8≤FC<1 | 13394 | 0 | 0 | -1.00 | NOS | |
| 坡度/° | ≤2(微斜) | 62821 | 1 | 0.05 | -0.72 | NS |
| 2~5(缓斜) | 133274 | 5 | 0.13 | -0.44 | NS | |
| >5(斜坡) | 160373 | 38 | 0.82 | 0.42 | PS | |
| 海拔高度/m | 4000~4100 | 5153 | 0 | 0 | -1.00 | NOS |
| 4100~4200 | 37232 | 18 | 0.77 | 0.59 | PS | |
| 4200~4300 | 216678 | 23 | 0.17 | -0.08 | RS | |
| 4300~4400 | 84660 | 3 | 0.06 | -0.56 | NS | |
| 4400~4500 | 12745 | 0 | 0 | -1.00 | NOS | |
| 距悬崖峭壁 距离/m | ≤100 | 25150 | 19 | 0.52 | 0.22 | PS |
| 100~200 | 24752 | 17 | 0.47 | 0.17 | PS | |
| >200 | 306566 | 4 | 0.02 | -0.86 | NS | |
| 植被类型 | 高山嵩草+杂类草草地型 | 35662 | 0 | 0 | -1.00 | NOS |
| 高山嵩草+紫花针茅草地型 | 13013 | 0 | 0 | -1.00 | NOS | |
| 禾叶风毛菊草地型 | 3949 | 0 | 0 | -1.00 | NOS | |
| 紫花针茅+杂类草草地型 | 140067 | 29 | 0.35 | 0.52 | PS | |
| 藏嵩草+苔草草地型 | 10754 | 0 | 0 | -1.00 | NOS | |
| 藏嵩草草地型 | 2504 | 0 | 0 | -1.00 | NOS | |
| 高山嵩草草地型 | 36975 | 13 | 0.60 | 0.69 | PS | |
| 赖草草地型 | 32279 | 0 | 0 | -1.00 | NOS | |
| 紫花针茅草地型 | 81265 | 2 | 0.04 | -0.45 | NS |
注:PS为正选择(positive selection),NS为负选择(negative selection),RS为随机选择(random selection),NOS为不选择(no selection)。 |
Table 5 Principal component analysis results of environmental factors in blue sheep habitat表5 岩羊栖息地环境因子主成分分析结果 |
| 环境因子 | 主成分 | |||
|---|---|---|---|---|
| 1 | 2 | 3 | ||
| 海拔高度 | 0.943 | 0.144 | -0.152 | |
| 距水源地距离 | 0.841 | -0.398 | -0.032 | |
| 距农村居民点距离 | 0.768 | 0.159 | 0.203 | |
| 植被类型 | -0.629 | 0.541 | 0.336 | |
| 距公路距离 | -0.484 | -0.781 | -0.119 | |
| 植被盖度 | 0.486 | 0.525 | 0.015 | |
| 坡度 | -0.415 | 0.519 | -0.382 | |
| 距悬崖峭壁距离 | 0.003 | -0.118 | 0.915 | |
| 特征值 | 3.224 | 1.666 | 1.176 | |
| 贡献率/% | 40.302 | 20.827 | 14.697 | |
| 贡献率累计值/% | 46.060 | 61.129 | 75.826 | |
| [1] |
Red List of Threatened Species (IUCN), 2011.
|
| [2] |
|
| [3] |
|
| [4] |
|
| [5] |
[
|
| [6] |
[
|
| [7] |
[
|
| [8] |
[
|
| [9] |
[
|
| [10] |
|
| [11] |
|
| [12] |
|
| [13] |
|
| [14] |
|
| [15] |
|
| [16] |
|
| [17] |
|
| [18] |
|
| [19] |
|
| [20] |
[
|
| [21] |
|
/
| 〈 |
|
〉 |