
JOURNAL OF NATURAL RESOURCES >
Spatial variation of land use carbon budget and carbon compensation zoning in functional areas:A case study of Wuhan Urban Agglomeration
Received date: 2018-10-30
Request revised date: 2019-01-23
Online published: 2019-05-28
Copyright
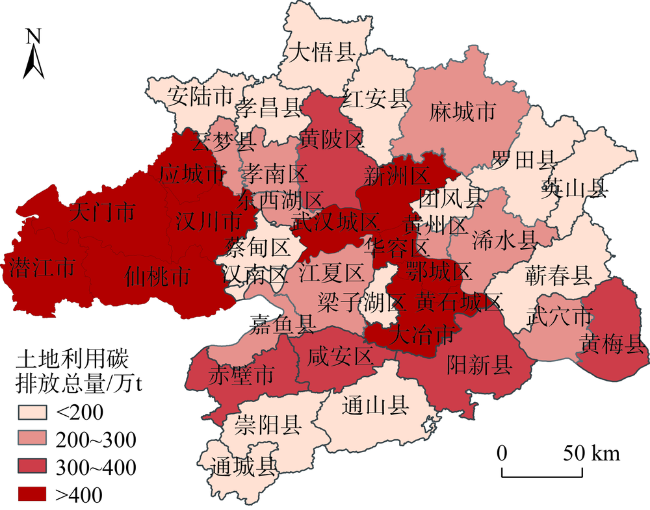
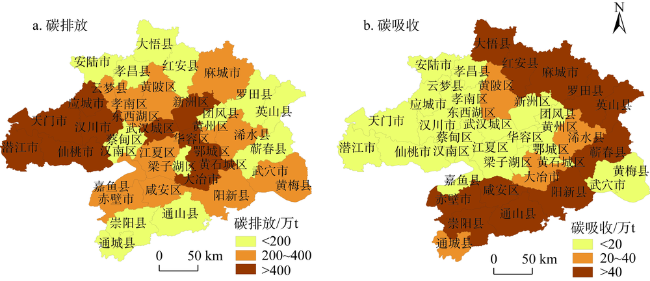
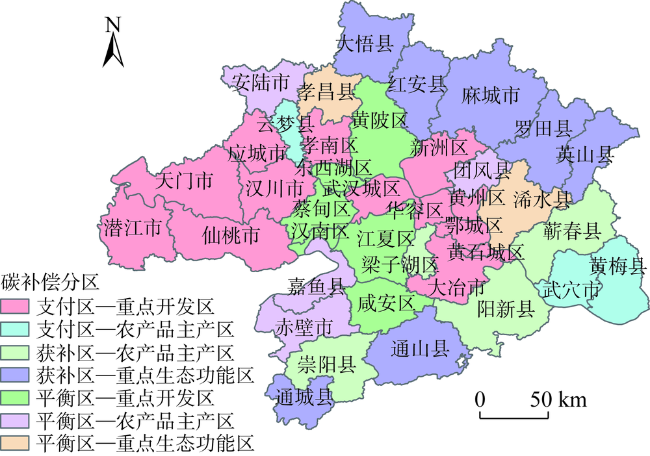
It is of great practical significance to carry out the assessment of land use carbon budget in functional areas and construct a carbon offset zoning optimization framework to formulate low carbon strategies for each functional area, specify compensation flows, and promote coordinated regional development. When taking Wuhan Urban Agglomeration as the basic analysis unit, this paper analyzes the spatial differentiation characteristics of land use carbon budget under the MFOZ, and the classification and conducts optimization of carbon compensation types in Wuhan Urban Agglomeration with the help of some methods, such as the Normalized Revealed Comparative Advantage Index method, the SOM-K-means model, and the two-dimensional correlation matrix. The results show that there are significant regional differences in the total amount of carbon emissions in different counties of Wuhan Urban Agglomeration, and display the spatial distribution characteristics that the total amount of carbon emissions is lower in the west and higher in the east, and the highest in the center. The land use carbon emission and carbon absorption in the MFOZ have obvious spatial differentiation characteristics, which shows a certain degree of relative spatial distribution trend. Wuhan Urban Agglomeration has been divided into 16 carbon compensation payment areas, 11 carbon compensation obtaining areas and 12 carbon compensation balance areas. In combination with the strategic objectives of the MFOZ, 7 types of carbon offset space optimization areas are eventually formed, and corresponding low-carbon development directions and strategies are proposed for each type of area.
LI Lu , DONG Jie , XU Lei , ZHANG Jun-feng . Spatial variation of land use carbon budget and carbon compensation zoning in functional areas:A case study of Wuhan Urban Agglomeration[J]. JOURNAL OF NATURAL RESOURCES, 2019 , 34(5) : 1003 -1015 . DOI: 10.31497/zrzyxb.20190508
Fig. 1 Spatial distribution of land use carbon emission in Wuhan Urban Agglomeration图1 武汉城市圈土地利用碳排放总量空间分布 |
Fig. 2 Spatial distribution of net land use carbon emission and carbon absorption in Wuhan Urban Agglomeration图2 武汉城市圈土地利用碳排放、碳吸收空间分布 |
Table 1 The effect of Major Function Oriented Zones on land use carbon emission and carbon absorption with single factor variance analysis表1 土地利用碳排放、碳吸收受主体功能区划影响的单因素方差分析 |
| 碳排放 | 碳吸收 | ||
|---|---|---|---|
| 方差齐性检验 | Levene统计量 | 2.024 | 9.929 |
| Sig. | 0.147 | 0.000 | |
| ANOVA检验 | F值 | 1.406 | — |
| Sig. | 0.258 | — | |
| Brown-Forsythe检验 | Statistics | — | 12.661 |
| Sig. | — | 0.000 | |
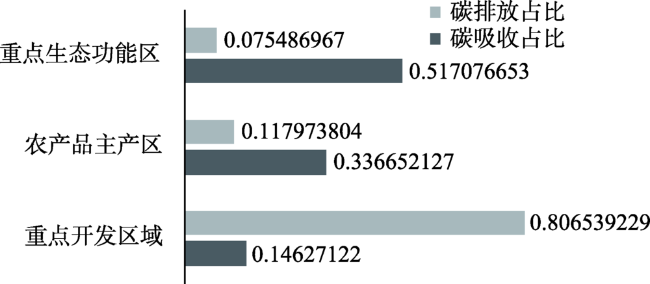
Fig. 3 Land use carbon emission and carbon absorption on ratio of different Major Function Oriented Zones图3 各类主体功能区土地利用碳排放、碳吸收比例 |
Table 2 NRCA index of land use carbon budget factors of Wuhan Urban Agglomeration表2 武汉城市圈土地利用碳收支各属性比较优势指数 |
| 自然本底 | 经济 | 生态环境 | 资源结构 | 自然本底 | 经济 | 生态环境 | 资源结构 | ||||
|---|---|---|---|---|---|---|---|---|---|---|---|
| 武汉城区 | 216.40 | -48.98 | -104.63 | -62.79 | 黄州区 | -9.17 | -10.09 | -47.07 | 66.33 | ||
| 东西湖区 | -11.59 | 44.59 | -56.96 | 23.96 | 团风县 | -11.17 | -5.49 | 22.91 | -6.25 | ||
| 新洲区 | 7.57 | -27.27 | -44.77 | 64.47 | 红安县 | -14.12 | -10.89 | 87.13 | -62.13 | ||
| 汉南区 | -19.30 | 89.37 | -58.77 | -11.30 | 麻城市 | -6.69 | -13.65 | 63.47 | -43.13 | ||
| 江夏区 | -14.03 | 85.30 | -49.03 | -22.24 | 罗田县 | -9.71 | -20.03 | 111.57 | -81.83 | ||
| 蔡甸区 | -18.14 | 89.08 | -54.34 | -16.60 | 英山县 | -7.15 | -18.94 | 93.63 | -67.54 | ||
| 黄陂区 | -7.66 | 23.69 | -20.52 | 4.48 | 浠水县 | -6.83 | -13.12 | 2.49 | 17.46 | ||
| 黄石城区 | 24.52 | -22.75 | -37 .02 | 35.25 | 蕲春县 | -14.23 | -0.01 | 91.29 | -77.05 | ||
| 阳新县 | 0.83 | -17.53 | 42.12 | -25.43 | 武穴市 | -3.99 | -13.16 | -21.52 | 38.67 | ||
| 大冶市 | 14.67 | -24.86 | -25.39 | 35.58 | 黄梅县 | -3.15 | -22.88 | -18.95 | 44.98 | ||
| 梁子湖区 | -30.88 | 179.34 | 12.88 | -161.33 | 咸安区 | 0.75 | -3.34 | 13.50 | -10.91 | ||
| 华容区 | 1.76 | -30.69 | -41.10 | 70.03 | 嘉鱼县 | -3.58 | -4.97 | -27.32 | 35.88 | ||
| 鄂城区 | 7.22 | -11.36 | -37.87 | 42.00 | 赤壁市 | 1.60 | -5.51 | 11.69 | -7.79 | ||
| 孝南区 | -11.18 | -1.89 | -51.64 | 64.72 | 通城县 | -5.17 | -8.87 | 44.65 | -30.61 | ||
| 孝昌县 | -13.76 | -0.16 | -3.81 | 17.73 | 崇阳县 | -9.95 | -17.49 | 122.68 | -95.24 | ||
| 大悟县 | -16.03 | -5.48 | 116.31 | -94.80 | 通山县 | -15.54 | -28.92 | 200.47 | -156.01 | ||
| 云梦县 | -9.40 | -20.14 | -55.61 | 85.15 | 仙桃市 | 5.02 | -16.65 | -49.58 | 61.21 | ||
| 应城市 | 4.07 | -38.84 | -46.99 | 81.76 | 潜江市 | 8.79 | -31.14 | -54.04 | 76.39 | ||
| 安陆市 | -11.97 | 3.59 | -20.77 | 29.15 | 天门市 | -3.86 | -18.79 | -55.40 | 78.05 | ||
| 汉川市 | -4.98 | -1.08 | -53.67 | 59.74 | |||||||
注:由于计算结果分布在-1/4~1/4之间,数值较小为便于分析,将所得到数据扩大10000倍。 |
Fig. 4 Carbon compensation spatial zoning under Major Function Oriented Zones图4 主体功能区划下碳补偿空间分区 |
Table 3 Main Indicators of carbon compensation zoning spatial optimization under Major Function Oriented Zones表3 主体功能区划下碳补偿分区空间优化主要指标数据表 |
| 优化分区 (区域范围/县) | 土地面积 占比/% | GDP 占比/% | 土地利用碳 排放总量占比/% | 碳排放经济 贡献系数均值 | 碳的生态承 载系数均值 | 土地利用程度综合系数均值 | |
|---|---|---|---|---|---|---|---|
| 支付区—重点开发区(13) | 28.56 | 71.06 | 78.09 | 0.85 | 0.15 | 2.88 | |
| 支付区—农产品主产区(3) | 6.12 | 3.55 | 4.34 | 0.82 | 0.83 | 2.83 | |
| 获补区—农产品主产区(4) | 13.26 | 3.07 | 2.53 | 1.95 | 7.07 | 2.41 | |
| 获补区—重点生态功能区(7) | 24.95 | 4.97 | 3.71 | 0.87 | 8.53 | 2.36 | |
| 平衡区—重点开发区(6) | 13.22 | 11.66 | 5.89 | 2.31 | 1.04 | 2.71 | |
| 平衡区—农产品主产区(4) | 8.46 | 3.88 | 3.82 | 1.02 | 2.13 | 2.62 | |
| 平衡区—重点生态功能区(2) | 5.42 | 1.80 | 1.62 | 1.08 | 2.79 | 2.72 | |
| [1] |
[
|
| [2] |
[
|
| [3] |
[
|
| [4] |
[
|
| [5] |
[
|
| [6] |
[
|
| [7] |
[
|
| [8] |
[
|
| [9] |
[
|
| [10] |
[
|
| [11] |
[
|
| [12] |
[
|
| [13] |
[
|
| [14] |
[
|
| [15] |
[
|
| [16] |
[
|
| [17] |
[
|
| [18] |
[
|
| [19] |
|
| [20] |
|
| [21] |
|
| [22] |
[
|
| [23] |
[
|
/
| 〈 |
|
〉 |