
JOURNAL OF NATURAL RESOURCES >
Spatial and temporal variations of rainfall erosivity at each level in Taihang Mountain
Received date: 2018-08-27
Request revised date: 2019-02-19
Online published: 2019-04-20
Copyright
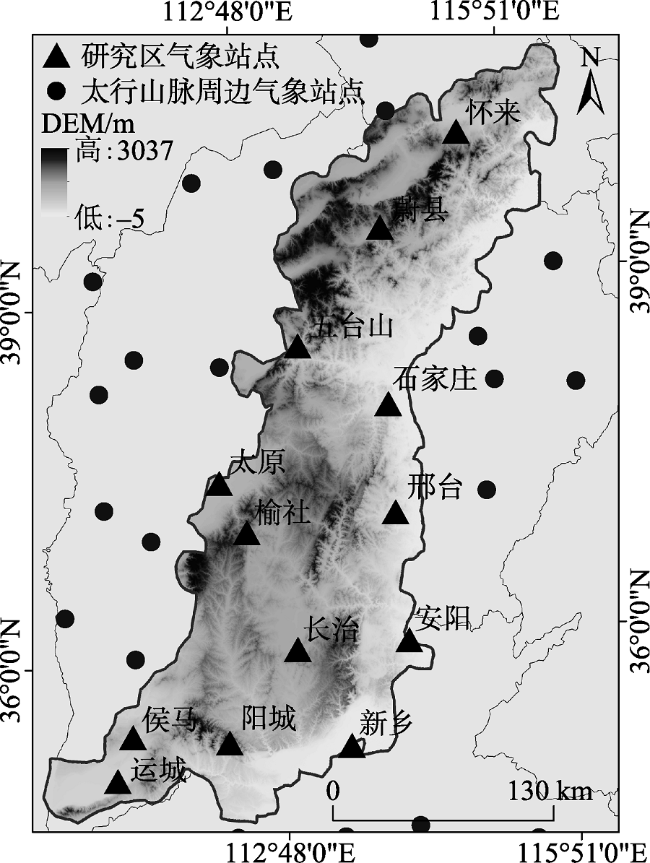
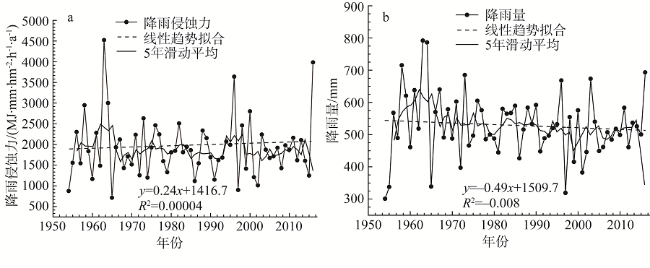
This paper is mainly based on daily rainfall data from 76 meteorological monitoring stations in the Taihang Mountains and its surrounding areas from 1954 to 2016. A simple model is established to simulate the annual rainfall erosivity based on different magnitudes of aggressive annual rainfall. The climatic trend rate, wavelet period analysis, center of gravity model, Co-Kriging interpolation, Mann-Kendall non-parametric trend test and mutation analysis were used to analyze the spatial and temporal variations of rainfall erosivity and their influencing factors. The results show that: (1) The simple model of annual rainfall erosivity in the Taihang Mountains area is y=0.182x11.095+5.463x20.982+9.401x31.017+15.258x4-26.753, and the erosivity of rainfall over years showed a slight upward trend, and it increased by 2.4 MJ·mm·hm-2·h-1·a-1 in 10 years. There is also a major cycle of about 20 a and a small cycle of 6 a, and significant mutations occurred in 1996. The eclipse of moderate rain and heavy rain showed an upward trend in 63 years, while the violent rain and extraordinary rainfall erosivity showed a downward trend. The spring and autumn seasons are mainly affected by moderate and heavy rain erosivity, while summer is mainly affected by excessive rainfall erosivity. (2) The maximum rainfall erosivity of all magnitudes is mainly distributed in the southeastern part of the Taihang Mountains and the Wutai Mountain areas. The minimum is mainly distributed in the northeastern part of the study area. Using the center of gravity model, we found that the gravity center of each magnitude of rainfall migrating migrates to the east and northeast in spring and summer, while that of the autumn and winter seasons migrates to the south and southwest, forming a cycle that is consistent with the control time of the winter and summer monsoons. (3) There was a significant positive correlation between rainfall erosivity and erosive rainfall in different magnitudes in the Taihang Mountains (P<0.01). Heavy rain and extraordinarily heavy rainfall erosivity were significantly negatively correlated with latitude and altitude (P<0.05). This is mainly related to factors such as subtropical high pressure movement, topography, elevation and natural geographical environment.
LI Wei-jie , WANG Jian-li . Spatial and temporal variations of rainfall erosivity at each level in Taihang Mountain[J]. JOURNAL OF NATURAL RESOURCES, 2019 , 34(4) : 785 -801 . DOI: 10.31497/zrzyxb.20190409
Fig. 1 Location and elevation of research sites of Taihang Mountains Area图1 太行山脉研究点位置及高程 |
Table 1 Monitoring site of the Taihang Mountains Area表1 太行山脉地区监测站点 |
| 站点 | 地区 | 监测年限 | 纬度/° | 经度/° | 海拔/m |
|---|---|---|---|---|---|
| 怀来 | 河北 | 1954-2016 | 40.24 | 115.30 | 536.80 |
| 蔚县 | 河北 | 1954-2016 | 39.50 | 114.34 | 909.50 |
| 太原 | 山西 | 1954-2016 | 37.47 | 112.33 | 778.30 |
| 榆社 | 山西 | 1957-2016 | 37.04 | 112.59 | 1041.40 |
| 运城 | 山西 | 1956-2016 | 35.03 | 111.03 | 365.00 |
| 侯马 | 山西 | 1957-2016 | 35.39 | 111.22 | 433.80 |
| 邢台 | 河北 | 1954-2016 | 37.11 | 114.22 | 183.00 |
| 阳城 | 山西 | 1957-2016 | 35.29 | 112.24 | 659.50 |
| 长治 | 山西 | 1973-2016 | 36.03 | 113.04 | 991.80 |
| 新乡 | 河南 | 1954-2016 | 35.19 | 113.53 | 73.20 |
| 安阳 | 河南 | 1954-2016 | 36.03 | 114.24 | 62.90 |
| 石家庄 | 河北 | 1955-2016 | 38.02 | 114.25 | 81.00 |
| 五台山 | 山西 | 1956-2016 | 38.57 | 113.31 | 2208.30 |
Table 2 Rainfall and rainfall erosion force function model regression results表2 降雨量与降雨侵蚀力函数模型回归结果 |
| x | y | 回归方程 | 决定系数R2 |
|---|---|---|---|
| 年中雨量 | 年中雨侵蚀力 | y=0.182x1.095 | 0.81 |
| 年大雨量 | 年大雨侵蚀力 | y=5.463x0.982 | 0.95 |
| 年暴雨量 | 年暴雨侵蚀力 | y=0.941x1.017 | 0.91 |
| 年特大降雨量 | 年特大降雨侵蚀力 | y=15.258x-26.753 | 0.98 |
| 年侵蚀性降雨量 | 年降雨侵蚀力 | y=0.014x2-3.526x+1337.089 | 0.72 |
| 年降雨量 | 年降雨侵蚀力 | y=0.009x2-4.254x+1502.015 | 0.79 |
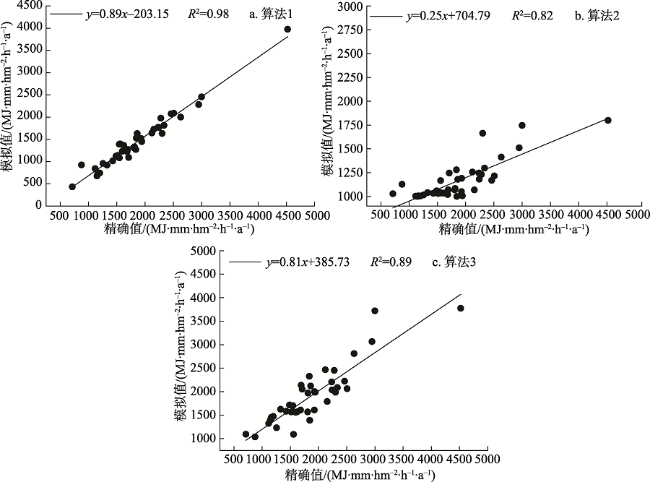
Fig. 2 Scatter plot of erosive force values and exact values for each simulated rainfall图2 各模拟年降雨侵蚀力值与精确值的散点图 |
Fig. 3 Comparison and fitting of simulated and exact values of rainfall erosivity from 1994-2016图3 1994-2016年降雨侵蚀力模拟值与精确值的比较及拟合 |
Table 3 Rainfall days, rainfall, erosive rainfall, and rainfall erosivity in the Taihang Mountains Area表3 太行山脉地区多年降雨日数、降雨量、侵蚀性降雨量及降雨侵蚀力 |
| 站点 | 年降雨日数/天 | 年降雨量 /mm | 年侵蚀性降雨量 /mm | 年降雨侵蚀力 /(MJ·mm·hm-2·h-1·a-1) | 年侵蚀性降雨量 /mm |
|---|---|---|---|---|---|
| 五台山 | 125.41 | 774.32 | 462.93 | 2116.20 | 0.60 |
| 太原 | 74.62 | 444.64 | 268.49 | 1356.93 | 0.60 |
| 榆社 | 86.47 | 544.90 | 346.54 | 1539.75 | 0.64 |
| 长治 | 87.75 | 559.87 | 354.21 | 1823.62 | 0.63 |
| 运城 | 78.16 | 529.23 | 350.84 | 1688.15 | 0.66 |
| 阳城 | 87.22 | 599.99 | 403.64 | 1984.75 | 0.67 |
| 安阳 | 75.29 | 579.20 | 418.73 | 2412.81 | 0.72 |
| 新乡 | 75.78 | 605.14 | 421.34 | 2502.56 | 0.70 |
| 蔚县 | 83.94 | 413.96 | 214.52 | 796.31 | 0.52 |
| 石家庄 | 73.27 | 555.51 | 373.63 | 2092.72 | 0.67 |
| 怀来 | 74.70 | 396.48 | 225.61 | 977.46 | 0.57 |
| 邢台 | 73.67 | 527.95 | 365.18 | 2021.85 | 0.69 |
| 侯马 | 81.62 | 512.31 | 324.70 | 1675.22 | 0.63 |
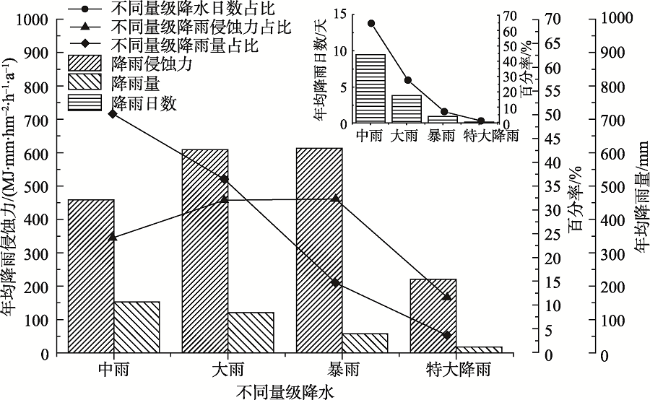
Fig. 4 Analysis of different magnitude rainfall days, rainfall, rainfall erosivity ratios and their characteristics in the Taihang Mountains Area图4 太行山脉地区不同量级降雨日数、降雨量、降雨侵蚀力比列及其特征分析 |
Fig. 5 Characteristics of annual rainfall erosivity and annual rainfall in the Taihang Mountains Area图5 太行山脉地区多年年降雨侵蚀力与年降雨量变化特征 |
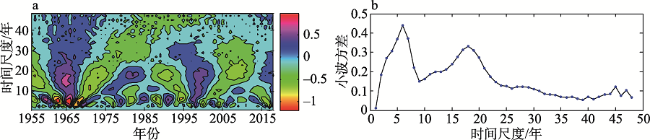
Fig. 6 Wavelet analysis of annual rainfall erosion forces图6 年降雨侵蚀力小波分析动态变化 |
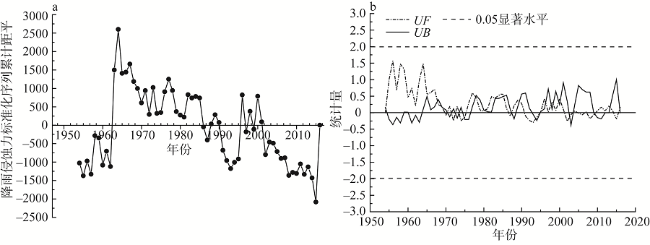
Fig. 7 Time series of annual rainfall erosivity based on the cumulative anomaly and Mann-Kendall mutation test图7 基于累计距平法和Mann-kendall突变检验法的年降雨侵蚀力时间序列 |
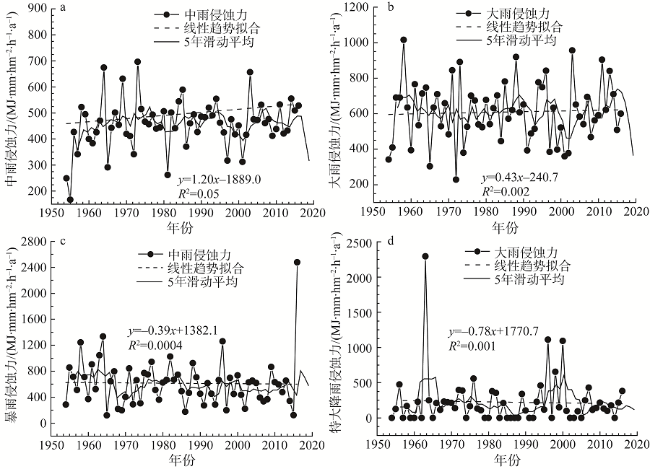
Fig. 8 Interannual variation of rainfall erosivity for different magnitudes in the Taihang Mountains Area图8 太行山区不同量级降雨侵蚀力年际变化 |
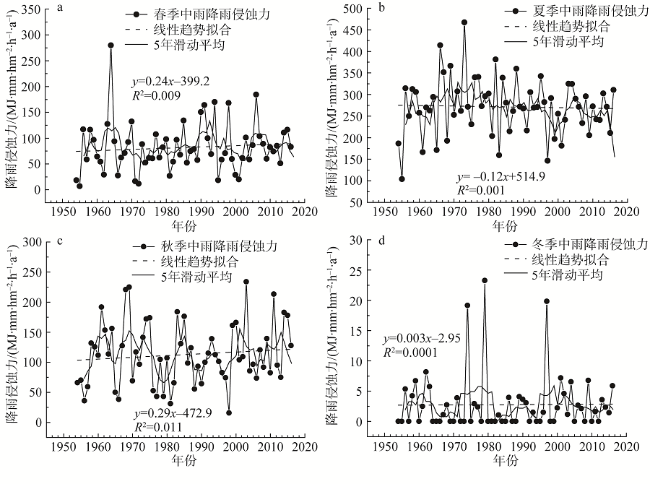
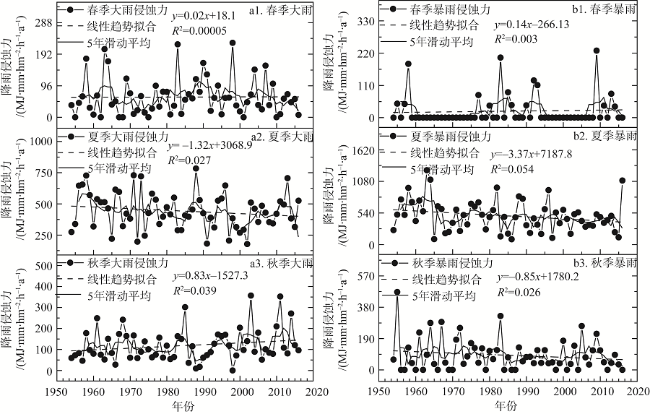
Fig. 9 Seasonal variation of rain erosivity图9 中雨侵蚀力季节变化特征 |
Fig. 10 Seasonal variations of erosive force and storm erosive force in heavy rain图10 大雨侵蚀力与暴雨侵蚀力季节变化特征 |
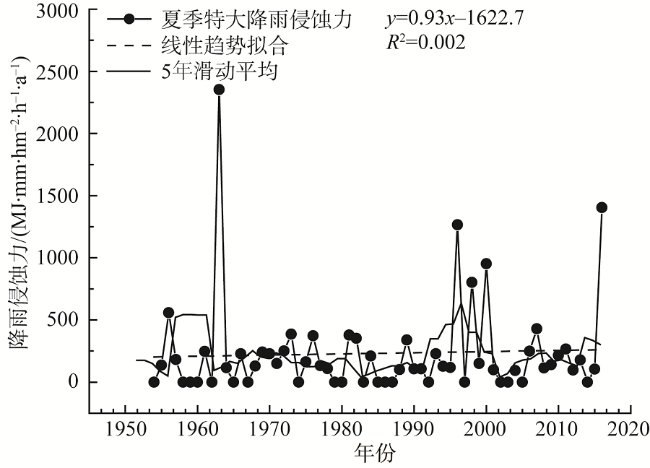
Fig. 11 Seasonal variations of erosive force in extreme rainfall图11 特大降雨侵蚀力季节变化特征 |
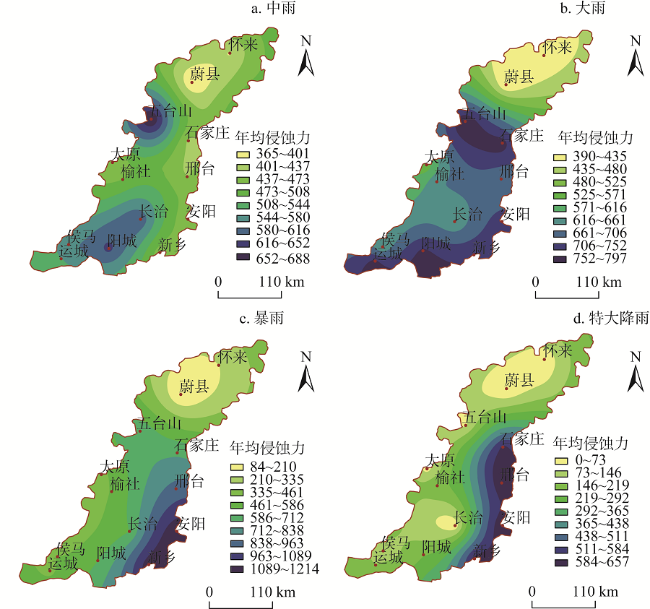
Fig. 12 Spatial distribution of interannual variations of rainfall erosivity for different magnitudes in the Taihang Mountains Area图12 太行山脉地区不同量级降雨侵蚀力年际变化空间分布 |
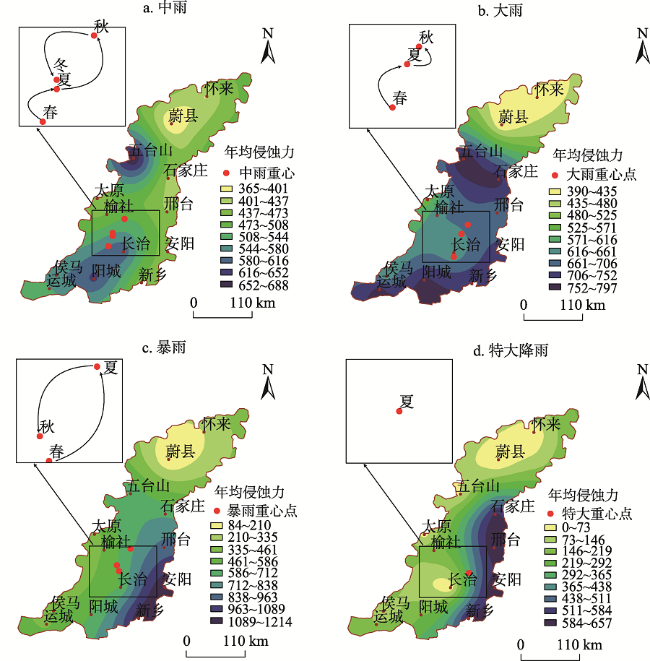
Fig. 13 Seasonal trajectory of the gravity center of gravity for different magnitudes of rainfall图13 不同量级降雨侵蚀力重心季节迁移轨迹 |
Table 4 Analysis of rainfall erosivity and its related factors in different grades表4 不同量级降雨侵蚀力及其相关影响因素分析 |
| 不同类型降雨侵蚀力 | 降雨侵蚀力与其他不同因素的决定系数R2 | |||
|---|---|---|---|---|
| 侵蚀性降雨量 | 海拔 | 纬度 | 经度 | |
| 太行山区 | 0.93** | 0.29 | -0.61* | 0.08 |
| 中雨 | 0.89** | 0.54 | 0.41 | 0.54 |
| 大雨 | 0.96** | 0.11 | -0.65* | 0.40 |
| 暴雨 | 0.96** | 0.49 | 0.51 | 0.14 |
| 特大降雨 | 0.64** | -0.69** | 0.30 | 0.30 |
注:*、**分别表示通过0.05、0.01显著性检验。 |
The authors have declared that no competing interests exist.
| [1] |
[
|
| [2] |
[
|
| [3] |
|
| [4] |
|
| [5] |
[
|
| [6] |
[
|
| [7] |
[
|
| [8] |
|
| [9] |
[
|
| [10] |
[
|
| [11] |
[
|
| [12] |
[
|
| [13] |
[
|
| [14] |
|
| [15] |
中华人民共和国水利部. 第一次全国水利普查水土保持情况公报. 2013-05.
[Ministry of Water Resources of the People's Republic of China. First national water conservancy survey on soil and water conservation. 2013-05.]
|
| [16] |
[
|
| [17] |
[
|
| [18] |
[
|
| [19] |
[
|
| [20] |
[
|
| [21] |
[
|
| [22] |
[
|
| [23] |
[
|
| [24] |
[
|
/
| 〈 |
|
〉 |
