
JOURNAL OF NATURAL RESOURCES >
The relationship analysis of urban expansion types and changes in ecological landscape types based on LEI and MSPA in the city of Nanchang
Received date: 2018-09-26
Request revised date: 2019-01-23
Online published: 2019-04-20
Copyright
The economic growth and urbanization development of Nanchang have been accelerated significantly and considerably by China's rapid urbanization and industrialization since the reform and opening-up in the late 1980s. However, due to the rapid urban expansion, the ecological and environmental problems caused by the fragmentation of green landscapes have become more serious. Thus, this paper chose Nanchang city as an example to analyze the changes and relationship of urban expansion types and ecological landscape types, which will provide guidance for improving the ecological environments. Firstly, this paper used the Landscape Expansion Index (LEI) to identify the expansion models of the three periods, and analyzed the variations of construction land expansion from both time and space, based on the land use data of 2000, 2005, 2010 and 2015. Then, the Morphological Spatial Pattern Analysis (MSPA) method was used to obtain the ecological landscapes of the four periods, and expressed the ecological landscape fragmentation process from nine representative points. Finally, multiple buffer layers were created to explore the correlation between the variations in different expansion types and landscape types. The results are shown as follows. (1) Edge-expansion is the main expansion pattern, while ecological landscape is dominated by "core", and the variation of expansion types and landscape types varies with time. (2) The relationship between urban expansion types and ecological landscape types in different circles is significantly different at different development periods. (3) During the urban expansion process, infilling expansion is the main method to improve the compactness at the central urban area. In general, the ecological landscape is more fragmented, the edge-expansion will accelerate the reduction of large green patches, and the outlying expansion promotes the green landscape units more fragmentary, while infilling expansion has the effect of weakening the process. According to the research results, calculating the landscape expansion index of the newly approved construction land and studying the current situation of ecological landscape types will enable decision makers to identify the urban expansion trend and make scientific and developmental predictions for the next stage of development. Then, decision makers can control the disorderly urban sprawl from a macroscopic level.
Key words: LEI; MSPA; urban expansion; landscape pattern; relationship analysis; Nanchang
ZHAO Yan-ru , ZOU Zi-li , ZHANG Xiao-ping , WEI Xiao-jian . The relationship analysis of urban expansion types and changes in ecological landscape types based on LEI and MSPA in the city of Nanchang[J]. JOURNAL OF NATURAL RESOURCES, 2019 , 34(4) : 732 -744 . DOI: 10.31497/zrzyxb.20190405
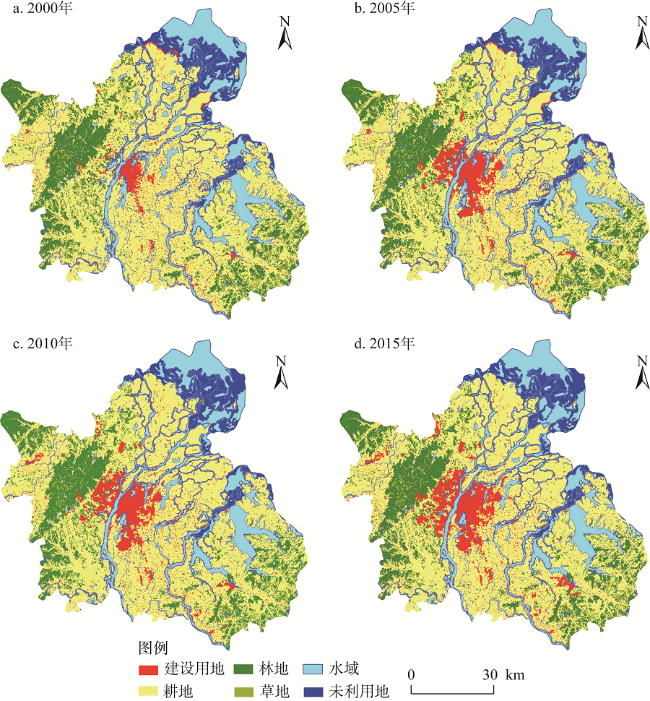
Fig. 1 Landuse map of Nanchang during 2000-2015图1 2000-2015年土地利用现状 |
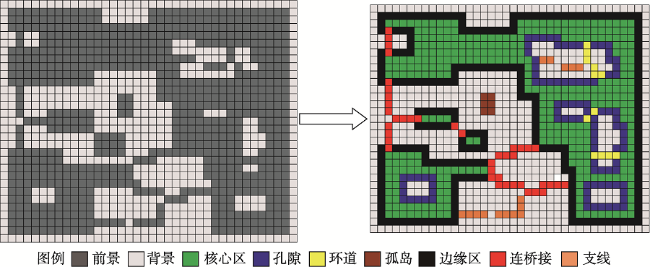
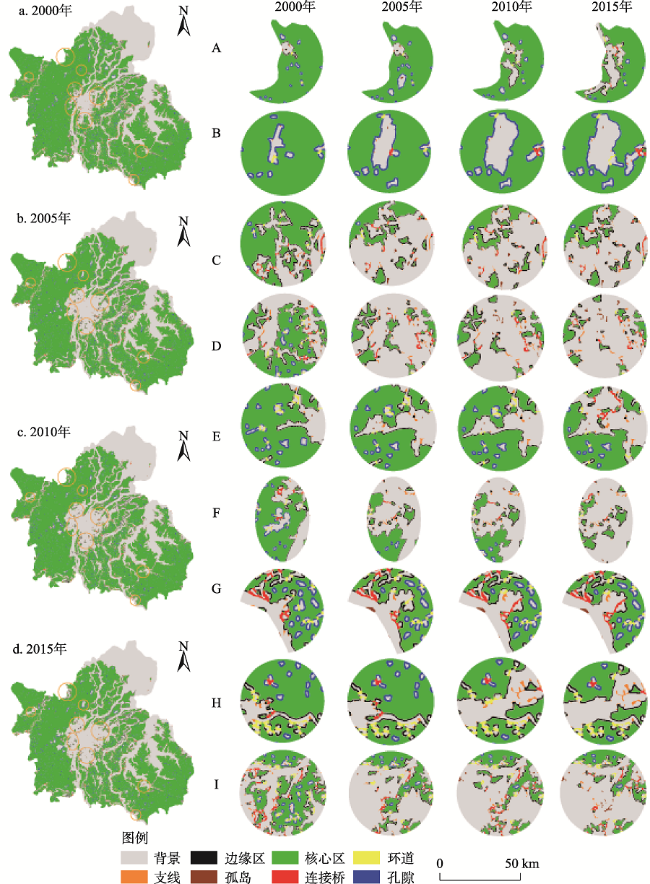
Fig. 2 The landscape type map of MSPA图2 MSPA结构示意图 |
Table 1 The definition and ecological meaning of morphological spatial pattern analysis (MSPA) classes表1 MSPA的景观类型定义及生态学含义 |
| 景观类型 | 定义 | 生态学含义 |
|---|---|---|
| 核心区(Core) | 前景像素点远离背景像素点的距离大于指定大小的某个参数的像素集合 | 大型自然斑块、野生动植物栖息地、森林保护区等 |
| 孤岛(Islet) | 未连接任何的前景区域的斑块,并且面积小于核心区的最小阈值 | 彼此不相连的孤立、破碎的小型自然斑块,通常包括建成区内的小型城市绿地 |
| 孔隙(Perforation) | 中心区内部的孔洞,由背景构成 | 核心区内部的建设用地,不具有生态效益 |
| 边缘区(Edge) | 前景外部的边缘 | 是核心区和建设用地之间的过渡,具有边缘效应 |
| 连接桥(Bridge) | 至少有2个点连到不同的核心区 | 连通核心区之间的带状生态用地,即区域绿色基础设施中的廊道,促进区域内部物种迁徙、能量流动与网络形成 |
| 环道(Loop) | 至少有2个点连接到同一核心区 | 连接同一核心区的生态走廊,规模小、与外围自然斑块的连接度低 |
| 支线(Branch) | 仅有一边连接到边缘区、桥接区或环道区 | 仅与核心区一端联系的生态斑块,景观连接度较差 |
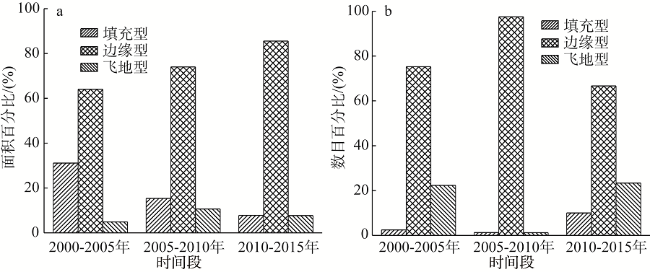
Fig. 3 The area percentages and number percentages of the three patterns of expansion at different periods图3 三种扩张模式在不同时间段的面积百分比和数目百分比 |
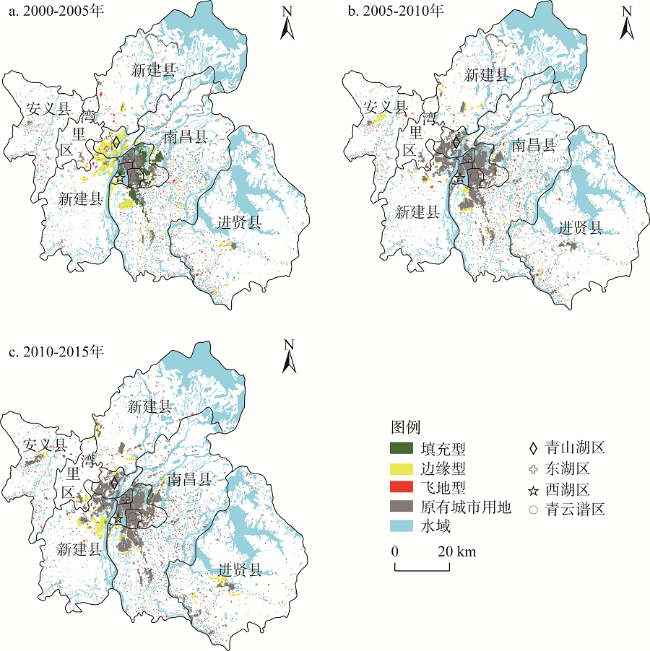
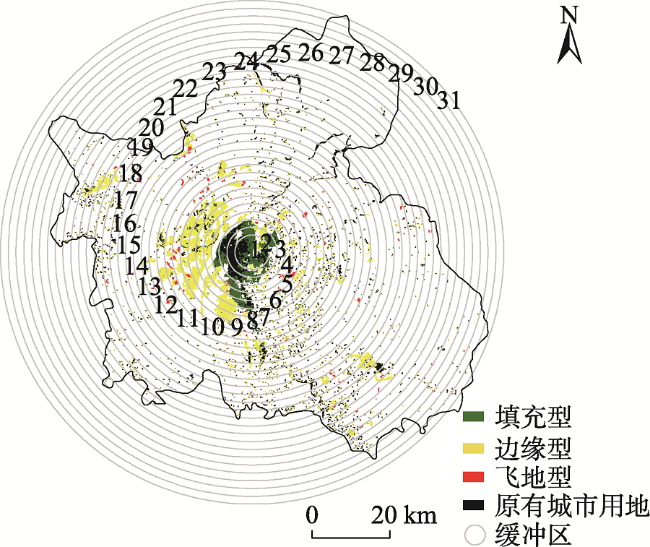
Fig. 4 Urban expansion type map for each period图4 各个时间段的城市扩张类型图 |
Fig. 5 MSPA type space change in Nanchang during 2000-2015图5 2000-2015年南昌市MSPA类型空间变化 |
Table 2 Ecological landscape types of statistical tables during 2000-2015 (km2)表2 2000-2015年各生态景观类型统计表 |
| 年份 | 核心区面积 | 孤岛面积 | 孔隙面积 | 边缘区面积 | 连接桥面积 | 环道面积 | 支线面积 | 生态景观总面积 | ||
|---|---|---|---|---|---|---|---|---|---|---|
| 2000 | 4320.56 | 4.65 | 365.00 | 470.08 | 61.18 | 95.02 | 50.32 | 5366.81 | ||
| 2005 | 4192.65 | 4.17 | 341.87 | 460.41 | 56.25 | 84.08 | 52.10 | 5191.53 | ||
| 2010 | 4195.34 | 4.97 | 343.90 | 458.47 | 55.15 | 84.60 | 50.83 | 5193.26 | ||
| 2015 | 4092.20 | 6.57 | 338.05 | 470.97 | 57.76 | 86.90 | 54.26 | 5106.71 | ||
Fig. 6 Buffer analysis of the study area图6 研究区缓冲区分析 |
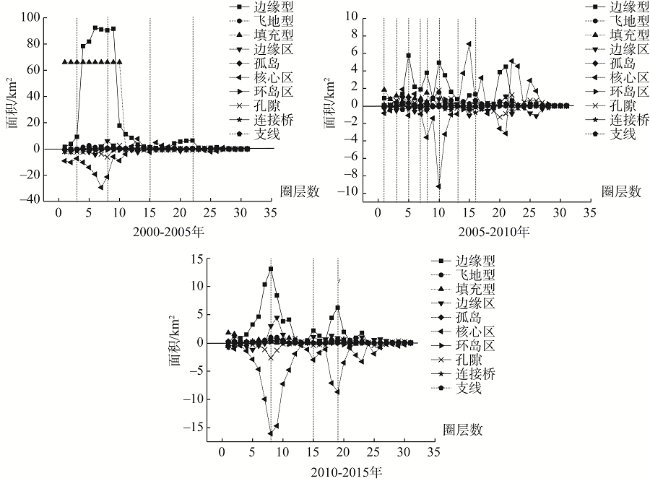
Fig. 7 Relationship between various types of expansion and landscape types图7 各扩张类型与各景观类型变化关系 |
The authors have declared that no competing interests exist.
| [1] |
[
|
| [2] |
[
|
| [3] |
[
|
| [4] |
[
|
| [5] |
[
|
| [6] |
[
|
| [7] |
[
|
| [8] |
[
|
| [9] |
[
|
| [10] |
|
| [11] |
|
| [12] |
[
|
| [13] |
[
|
| [14] |
[
|
| [15] |
[
|
| [16] |
[
|
| [17] |
[
|
| [18] |
[
|
| [19] |
[
|
| [20] |
|
| [21] |
|
| [22] |
|
| [23] |
|
| [24] |
[
|
| [25] |
[
|
| [26] |
[
|
| [27] |
[
|
| [28] |
[
|
| [29] |
[
|
| [30] |
[
|
| [31] |
[
|
| [32] |
[
|
| [33] |
[
|
| [34] |
[
|
| [35] |
[
|
| [36] |
|
| [37] |
[
|
/
| 〈 |
|
〉 |