
JOURNAL OF NATURAL RESOURCES >
Specialization, diversity and their impacts on China's provincial industrial pollution emissions
Received date: 2018-07-02
Request revised date: 2018-12-20
Online published: 2019-03-28
Copyright
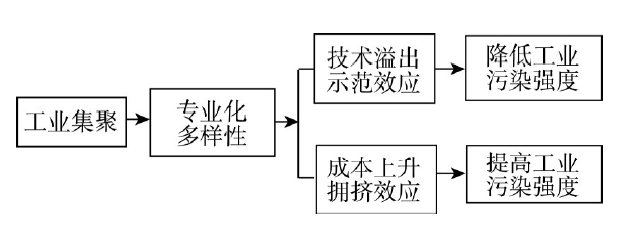
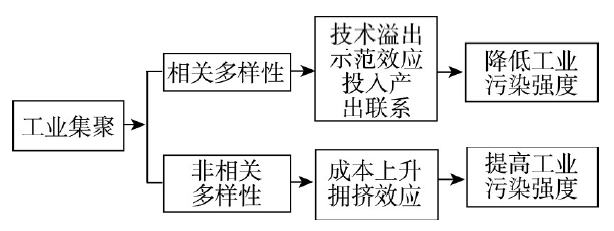
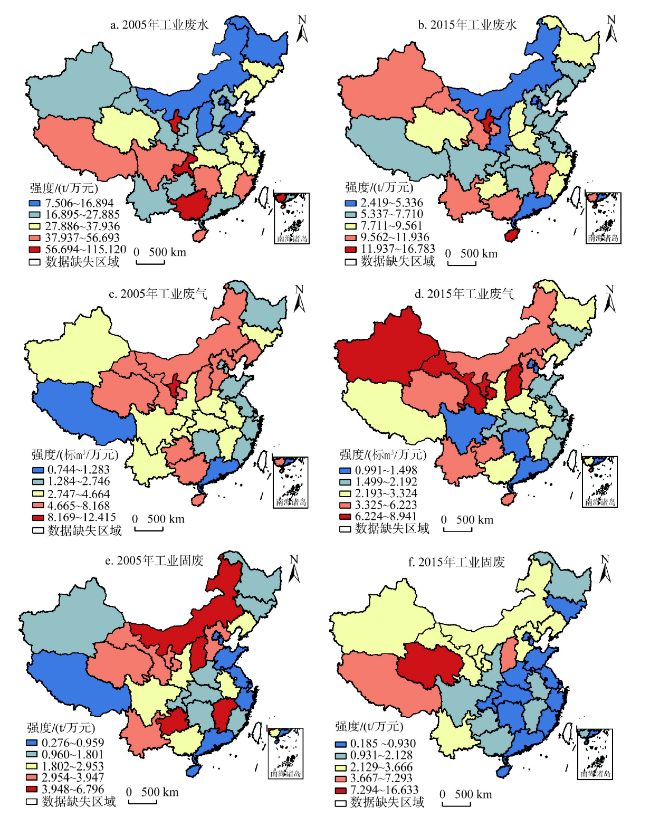
As industrial agglomeration increases, wastewater, waste gas, and solid waste are becoming the main sources of environmental pollution. Therefore, how to correctly deal with the relationship between industrial agglomeration and pollution emissions has become a hot issue in the current academic circles. Agglomeration externality is an important mechanism to reduce industrial pollution emission, and different agglomeration modes correspond to different pollution emission behaviors. Therefore, this study divides agglomeration into four types such as specialization, diversity, related diversity, and unrelated diversity. The research goal of this paper is to investigate the effects of different agglomeration types on pollution emissions. Taking 31 provincial units in China as an example, based on the theory of agglomeration economy, this paper analyses the characteristics of industrial pollution in China and studies the relationship between industrial agglomeration and different industrial pollution. The main conclusions are as follows: (1) There is a significant spatial difference in the intensity of industrial wastewater, waste gas and solid waste. Generally speaking, the discharge intensity of industrial wastewater in the Yangtze River Basin is higher, and that of the northwest and southwest regions are rising significantly. The emission intensity of industrial waste gas and industrial solid waste in the north and northwest regions is higher. (2) Diversity is more beneficial to the reduction of emission intensity of industrial pollution than specialized agglomeration. Diversity has the greatest impact on industrial waste water, and has little effect on the gas and solid pollution. Industrial linkage is an important condition for diversity agglomeration to produce environmental 'self-purification' effect. Related diversity is conducive to the decrease of emission intensity of industrial pollution, and unrelated diversity will exacerbate pollution levels. (3) From the perspective of different polluting industries, the specialized wastewater pollution industries is conducive to the decline of pollution intensity, while the specialized waste gas and solid waste pollution industries will intensify pollution emissions. The diversified development of the polluting industry is conducive to the decline of pollution intensity. (4) The effects of different agglomeration types on industrial pollution are heterogeneous in terms of regional and pollution types. (5) To further reduce industrial pollution, we should improve the diversity of the agglomeration industry. We should also pay more attention to the improvement of the inner correlation between the industries and avoid the spatial concentration of the unrelated industries. At the same time, differentiated prevention and control measures should be formulated according to different regions, polluting industries, and industrial pollutants.
WANG Yan-hua , MIAO Chang-hong , HU Zhi-qiang , ZHANG Yan . Specialization, diversity and their impacts on China's provincial industrial pollution emissions[J]. JOURNAL OF NATURAL RESOURCES, 2019 , 34(3) : 586 -599 . DOI: 10.31497/zrzyxb.20190312
Fig. 1 The relationship between specialization, diversification and industrial pollution图1 专业化、多样性与工业污染的关系 |
Fig. 2 The relationship between related variety, unrelated variety and industrial pollution图2 相关多样性、非相关多样性与工业污染的关系 |
Fig. 3 Spatial pattern of industrial pollution intensity in China图3 中国省域工业污染排放强度的空间格局 |
Table 1 The relationship between specialization, diversity and industrial pollution表1 专业化、多样性与工业污染的关系 |
| 工业废水 | 工业废气 | 工业固废 | |||||||||
|---|---|---|---|---|---|---|---|---|---|---|---|
| 全国 | 沿海 | 内陆 | 全国 | 沿海 | 内陆 | 全国 | 沿海 | 内陆 | |||
| rzi | -0.016 (0.021) | 0.128 (0.097) | -0.040* (0.022) | 0.006 (0.013) | -0.122** (0.052) | 0.023 (0.015) | 0.036* (0.021) | -0.133** (0.058) | 0.076*** (0.023) | ||
| rdi | -0.921*** (0.138) | -0.499* (0.285) | -0.848*** (0.164) | -0.230*** (0.088) | 0.546*** (0.153) | -0.360*** (0.111) | -0.224* (0.137) | 0.148 (0.170) | -0.218 (0.171) | ||
| pop | -8.465*** (0.591) | -4.895*** (0.623) | -13.564*** (1.232) | -1.719*** (0.377) | -2.069*** (0.335) | 1.168 (0.836) | -0.561 (0.588) | -2.648*** (0.371) | 6.966*** (1.285) | ||
| str | -0.058*** (0.007) | -0.019 (0.013) | -0.061*** (0.008) | -0.013*** (0.004) | -0.006 (0.007) | -0.015*** (0.005) | -0.002 (0.007) | -0.001 (0.008) | -0.012 (0.008) | ||
| fdi | 2.095 (2.189) | 13.505*** (3.257) | -3.721 (2.645) | -0.061 (1.394) | -1.254 (1.752) | 0.946 (1.795) | -1.297 (2.177) | 0.852 (1.939) | -1.690 (2.758) | ||
| tec | 6.452 (5.061) | 3.857 (4.198) | 3.152 (11.951) | -1.167 (3.223) | 4.633** (2.257) | -2.373 (8.111) | -13.632*** (5.032) | 2.228 (2.499) | -28.854** (12.464) | ||
| en | 0.004 (0.006) | 1.219*** (0.378) | 0.002 (0.007) | -0.012*** (0.004) | 0.217 (0.203) | -0.011** (0.004) | -0.022*** (0.006) | 0.210 (0.225) | -0.018*** (0.007) | ||
| c | 51.433*** (3.222) | 34.517*** (4.585) | 70.137*** (5.738) | 11.177*** (2.052) | 13.511*** (2.466) | -2.909 (3.894) | 3.910 (3.203) | 16.493*** (2.729) | -30.640*** (5.984) | ||
| R2 | 0.672 | 0.831 | 0.642 | 0.838 | 0.918 | 0.805 | 0.823 | 0.960 | 0.675 | ||
| 估计方法 | 固定效应 | 固定效应 | 固定效应 | 固定效应 | 固定效应 | 固定效应 | 固定效应 | 固定效应 | 固定效应 | ||
注:*、**、***分别表示在0.1、0.05、0.01水平上显著,括号内数字为残差值,下同。 |
Table 2 The relationship between related variety, unrelated variety and industrial pollution表2 相关多样性、非相关多样性与工业污染的关系 |
| 工业废水 | 工业废气 | 工业固废 | |||||||||
|---|---|---|---|---|---|---|---|---|---|---|---|
| 全国 | 沿海 | 内陆 | 全国 | 沿海 | 内陆 | 全国 | 沿海 | 内陆 | |||
| rv | -1.929*** (0.622) | -3.687*** (0.710) | 0.275 (0.775) | 0.434 (0.296) | 0.810 (0.479) | 0.235 (0.388) | -1.326*** (0.368) | 0.250 (0.504) | -2.435*** (0.378) | ||
| uv | 2.973*** (0.736) | 1.131 (1.002) | 5.672*** (0.917) | 1.833*** (0.350) | 0.485 (0.676) | 2.376*** (0.459) | 3.286*** (0.435) | -0.226 (0.711) | 3.039*** (0.448) | ||
| pop | -6.990*** (0.621) | -4.237*** (0.581) | -15.447*** (1.333) | -2.373*** (0.295) | -2.238*** (0.392) | -3.132*** (0.668) | -1.759*** (0.366) | -2.755*** (0.412) | -0.273*** (0.083) | ||
| str | -0.059*** (0.007) | -0.023** (0.011) | -0.064*** (0.008) | -0.026*** (0.003) | -0.009 (0.008) | -0.026*** (0.004) | -0.024*** (0.004) | 0.003 (0.008) | -0.026*** (0.005) | ||
| fdi | 1.283 (2.193) | 10.843*** (2.812) | -4.833* (2.605) | -1.089 (1.041) | -1.536 (1.898) | -0.901 (1.306) | -2.748** (1.295) | 0.111 (1.996) | -2.635* (1.538) | ||
| tec | 4.668 (5.090) | 3.269 (3.605) | -9.172 (11.037) | 2.641 (2.417) | 4.155* (2.433) | -1.732 (5.531) | -4.105 (3.005) | 2.299 (2.559) | -11.962* (6.502) | ||
| en | 0.118** (0.060) | 1.011*** (0.317) | 0.058 (0.060) | -0.008 (0.028) | 0.418* (0.214) | -0.021 (0.030) | 0.001 (0.035) | 0.377* (0.225) | 0.019 (0.035) | ||
| c | 41.923*** (3.820) | 34.493*** (4.908) | 71.967*** (6.132) | 12.253*** (1.814) | 13.688*** (3.312) | 14.288*** (3.073) | 9.091*** (2.256) | 16.881*** (3.484) | 3.250*** (0.782) | ||
| R2 | 0.664 | 0.874 | 0.653 | 0.896 | 0.904 | 0.864 | 0.935 | 0.957 | 0.452 | ||
| 估计方法 | 固定效应 | 固定效应 | 固定效应 | 固定效应 | 固定效应 | 固定效应 | 固定效应 | 固定效应 | 随机效应 | ||
Table 3 The relationship between specialization, diversity and industrial pollution from the perspective of different pollution intensive industries表3 不同污染密集型产业视角下专业化、多样性与工业污染的关系 |
| 废水污染型工业 | 废气污染型工业 | 固废污染型工业 | |
|---|---|---|---|
| rzi | -1.081*** (0.139) | 0.297*** (0.095) | 0.639*** (0.172) |
| rdi | -1.354*** (0.096) | -0.182*** (0.068) | -0.339*** (0.122) |
| pop | -4.359*** (0.519) | -2.495*** (0.329) | -0.846 (0.653) |
| str | -0.052*** (0.005) | -0.021*** (0.003) | 0.004 (0.007) |
| fdi | -0.742 (1.722) | -1.159 (1.052) | -2.811 (2.114) |
| tec | 2.008 (4.045) | 3.605 (2.484) | -6.896 (5.019) |
| en | 0.003 (0.005) | 0.135* (0.080) | -0.023*** (0.006) |
| c | 47.126*** (2.522) | 17.716*** (1.686) | 8.416*** (3.180) |
| R2 | 0.679 | 0.412 | 0.472 |
| 估计方法 | 固定效应 | 固定效应 | 固定效应 |
The authors have declared that no competing interests exist.
| [1] |
|
| [2] |
[
|
| [3] |
|
| [4] |
[
|
| [5] |
|
| [6] |
|
| [7] |
[
|
| [8] |
|
| [9] |
|
| [10] |
[
|
| [11] |
|
| [12] |
[
|
| [13] |
[
|
| [14] |
[
|
| [15] |
[
|
| [16] |
[
|
| [17] |
|
| [18] |
[
|
| [19] |
|
| [20] |
|
| [21] |
|
| [22] |
|
| [23] |
[
|
| [24] |
|
| [25] |
[
|
| [26] |
[
|
| [27] |
中华人民共和国国家统计局. 中国环境统计年鉴. 北京: 中国统计出版社, 2006-2016.
[National Bureau of Statistics of the People's Republic of China. China Environmental Statistics Yearbook. Beijing: China Statistics Press, 2006-2016.]
|
| [28] |
中华人民共和国国家统计局. 中国环境年鉴. 北京: 中国统计出版社, 2006-2016.
[National Bureau of Statistics of the People's Republic of China. China Environmental Yearbook. Beijing: China Statistics Press, 2006-2016.]
|
| [29] |
中华人民共和国国家统计局. 中国工业经济统计年鉴(2006-2016). 北京: 中国统计出版社, 2006-2016.
[National Bureau of Statistics of the People's Republic of China. China Industry Statistical Yearbook. Beijing: China Statistics Press, 2006-2016.]
|
| [30] |
[
|
/
| 〈 |
|
〉 |