
JOURNAL OF NATURAL RESOURCES >
Spatiotemporal evolvement and problem region diagnosis of agricultural transformation in Chongqing city: Based on a total factor productivity perspective
Received date: 2018-09-26
Request revised date: 2019-01-10
Online published: 2019-03-28
Copyright
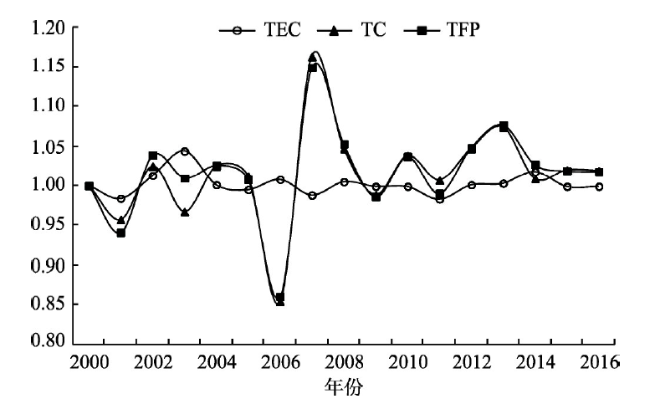
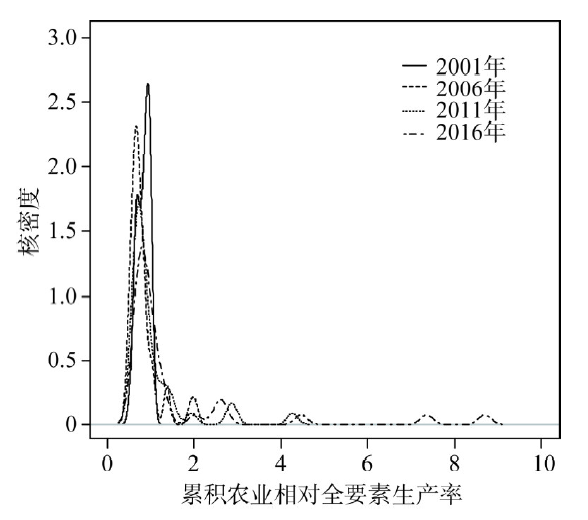
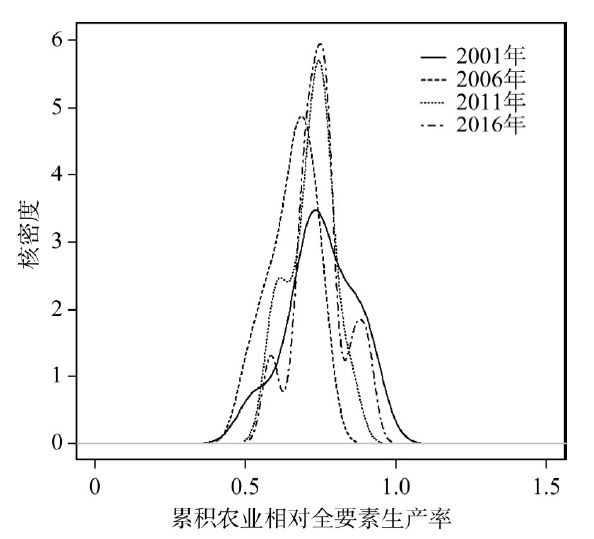
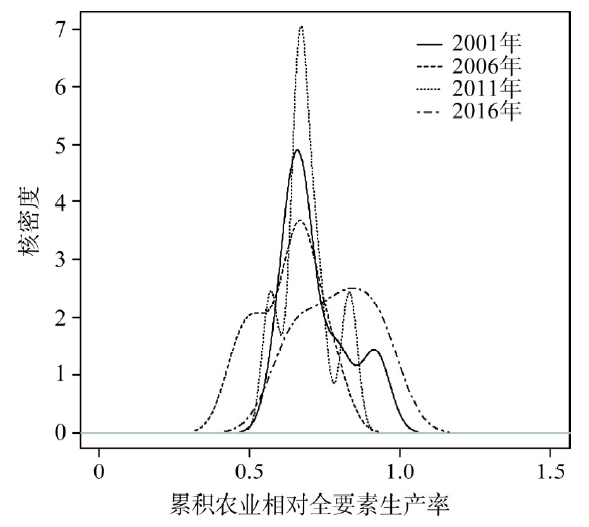
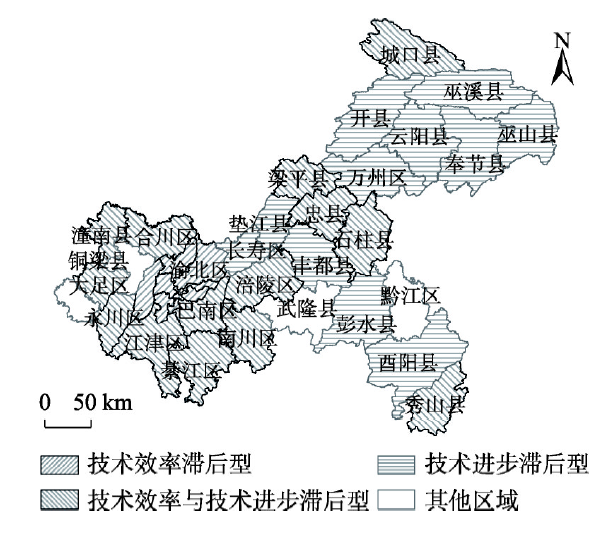
Studying the law of spatiotemporal evolution of agricultural total factor productivity is of great significance to formulate the agricultural transformation and upgrading policies rationally. This paper, which is based on the calculation of agricultural total factor productivity growth from 37 counties in Chongqing over the period 2000-2016 by using DEA-Malmquist index model, investigates characteristics of spatiotemporal evolution of agricultural total factor productivity by using spatial analysis and Kernel density estimation methods and identifies the problem regions of Chongqing. The results are listed as follows: (1) From 2000 to 2016, the agricultural total factor productivity is on the rise. The agricultural total factor productivity index has a tendency of "U" type and periodic fluctuation, which shows obvious spatial imbalance. (2) The change trend of agricultural total factor productivity index is similarly consistent with that of technical progress index, which indicates that the technology progress is the main reason for total factor productivity growth. (3) From the view of the whole city, the Kernel density curve of agricultural total factor productivity keeps moving to the right, and the crest height continues to rise. The crest shape changes from "unimodal" to "multi-modal" distribution, which implies that the regional disparity of agricultural total factor productivity shows an increasing trend during the study period. (4) According to the relationship among agricultural total factor productivity growth, technical progress and technical efficiency, three types of problem regions are identified. Then policy suggestions for agricultural transformation and development are proposed for each type of problem region.
YIN Chao-jing , LI Zhao-liang , LI Qian-nan , ZHAO Tong-lin . Spatiotemporal evolvement and problem region diagnosis of agricultural transformation in Chongqing city: Based on a total factor productivity perspective[J]. JOURNAL OF NATURAL RESOURCES, 2019 , 34(3) : 573 -585 . DOI: 10.31497/zrzyxb.20190311
Fig. 1 Malmquist efficiency index and its decomposition of agriculture in Chongqing during 2000-2016图1 2001-2016年重庆市农业Malmquist生产率指数及其分解 |
Table 1 The growth of agricultural Malmquist efficiency index and its decomposition in Chongqing duing 2000-2016表1 2000-2016年重庆市各县(区)农业生产率增长及其分解 |
| 地区 | 曼奎斯特 生产率指数 | 技术进步指数 | 技术效率变化指数 | 地区 | 曼奎斯特生产率指数 | 技术进步指数 | 技术效率 变化指数 |
|---|---|---|---|---|---|---|---|
| 一小时经济圈 | 1.033 | 1.033 | 0.999 | 长寿区 | 1.020 | 1.018 | 1.001 |
| 大渡口区 | 1.139 | 1.139 | 1.000 | 渝东南翼 | 1.003 | 0.997 | 1.019 |
| 江北区 | 1.101 | 1.101 | 1.000 | 黔江区 | 1.020 | 1.010 | 1.000 |
| 沙坪坝区 | 1.061 | 1.061 | 1.000 | 武隆县 | 1.001 | 1.005 | 0.990 |
| 九龙坡区 | 1.080 | 1.080 | 1.000 | 石柱县 | 0.989 | 0.990 | 0.999 |
| 南岸区 | 1.061 | 1.062 | 0.998 | 秀山县 | 0.988 | 0.993 | 1.007 |
| 北碚区 | 1.044 | 1.045 | 0.998 | 酉阳县 | 1.013 | 0.991 | 1.019 |
| 渝北区 | 1.037 | 1.037 | 1.000 | 彭水县 | 1.006 | 0.992 | 1.013 |
| 巴南区 | 1.005 | 1.005 | 1.000 | 渝东北翼 | 0.994 | 0.989 | 1.006 |
| 綦江区 | 0.992 | 0.999 | 0.994 | 万州区 | 0.990 | 0.988 | 1.002 |
| 潼南县 | 1.017 | 1.021 | 0.996 | 梁平县 | 0.987 | 0.987 | 1.000 |
| 铜梁县 | 1.024 | 1.022 | 1.002 | 城口县 | 0.991 | 0.988 | 1.003 |
| 大足区 | 1.010 | 1.008 | 1.002 | 丰都县 | 0.995 | 0.992 | 1.004 |
| 荣昌县 | 1.019 | 1.017 | 1.002 | 垫江县 | 0.984 | 0.986 | 0.998 |
| 璧山县 | 1.010 | 1.010 | 1.000 | 忠 县 | 0.989 | 0.985 | 1.003 |
| 江津区 | 0.995 | 0.995 | 1.000 | 开 县 | 1.001 | 0.991 | 1.011 |
| 合川区 | 0.998 | 0.998 | 1.000 | 云阳县 | 0.998 | 0.986 | 1.012 |
| 永川区 | 1.009 | 1.011 | 0.999 | 奉节县 | 0.996 | 0.987 | 1.010 |
| 南川区 | 1.001 | 1.005 | 0.997 | 巫山县 | 1.003 | 0.993 | 1.010 |
| 涪陵区 | 1.000 | 1.000 | 0.999 | 巫溪县 | 1.002 | 0.991 | 1.011 |
注:本表中各指数为分县(区)历年的几何平均数,总平均数亦为各县(区)的几何平均数。 |
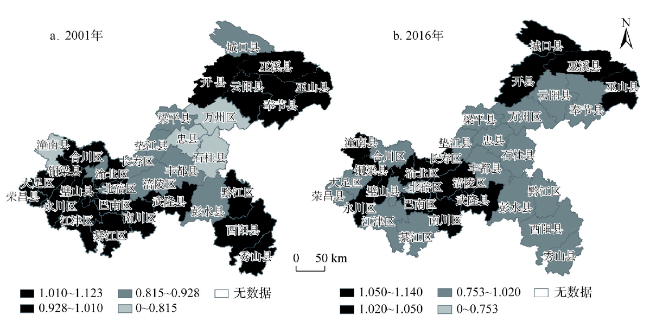
Fig. 2 The spatial distribution of agricultural total factor productivity index of Chongqing in 2001 and 2016图2 2001年和2016年重庆市农业全要素生产率指数空间格局变化 |
Fig. 3 Agricultural total factor productivity evolution of Chongqing图3 重庆37个县(区)农业全要素生产率演进 |
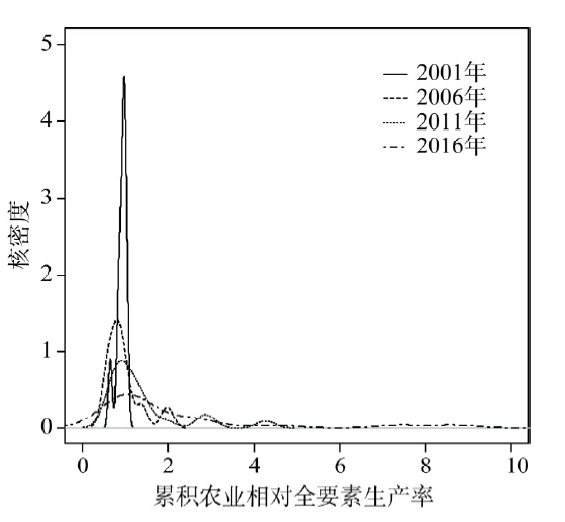
Fig. 4 Agricultural total factor productivity evolution of 37 districts in One-hour Economic Circle图4 一小时经济圈农业全要素生产率的演进 |
Fig. 5 Agricultural total factor productivity evolution of Chongqing's northeast wing area图5 渝东北翼地区农业全要素生产率演进 |
Fig. 6 Agricultural total factor productivity evolution of Chongqing's southeast wing area图6 渝东南翼地区农业全要素生产率演进 |
Fig. 7 Types and distribution of agricultural production efficiency in Chongqing during 2000-2016图7 2000-2016年重庆市农业生产效率问题类型及分布 |
The authors have declared that no competing interests exist.
| [1] |
[
|
| [2] |
[
|
| [3] |
[
|
| [4] |
[
|
| [5] |
[
|
| [6] |
[
|
| [7] |
[
|
| [8] |
[
|
| [9] |
[
|
| [10] |
[
|
| [11] |
[
|
| [12] |
[
|
| [13] |
[
|
| [14] |
[
|
| [15] |
[
|
| [16] |
[
|
| [17] |
|
| [18] |
[
|
| [19] |
|
| [20] |
|
| [21] |
|
| [22] |
|
| [23] |
|
| [24] |
[
|
| [25] |
[
|
| [26] |
[
|
| [27] |
[
|
| [28] |
[
|
| [29] |
[
|
| [30] |
|
| [31] |
|
| [32] |
[
|
| [33] |
[
|
/
| 〈 |
|
〉 |