
JOURNAL OF NATURAL RESOURCES >
Pattern optimization and carbon emissions of coal supply in China
Received date: 2018-07-02
Request revised date: 2018-11-09
Online published: 2019-03-28
Copyright
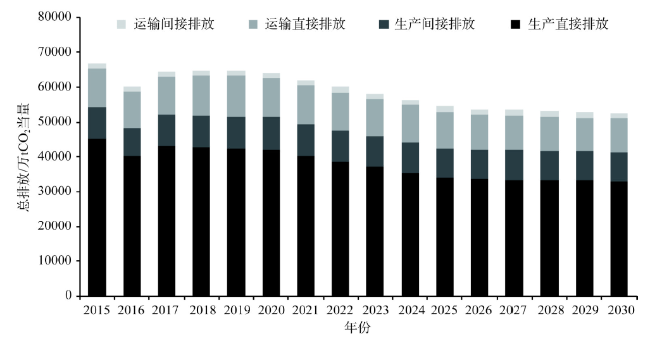
As the economic development of China enters into a new normal, coal industry is changing greatly. To reduce the total cost of the coal supply industry in China and calculate the carbon emission of it, we developed the R-CSSM model based on linear program method to optimize the future pattern of China's coal production and transportation on the basis of the collection and analysis of the present situation of the coal supply industry and relevant policy. The carbon emission coefficients were calculated after we examined each link of the coal supply industry in different regions. Then we used these coefficients to calculate the carbon emissions from coal related activities under the optimized pattern. The results show that, under the existing arrangements and the constraints of resources and policy, China's coal production will continue to be centralized, the coal production of Shanxi, Shaanxi, Inner Mongolia, Ningxia, Gansu and Xinjiang will continue to rise, accounting for nearly 88% of all coal production in China by 2030, and this ratio rises by 17% compared with 2015. The pressure of coal transportation would increase first and then decrease, the railway transportation ability of Xinjiang, and southwestern and northeastern China for coal will be low, and railway expansion and reconstruction project need to be taken in these places. By 2020, the coal supply industry would have a total emission of about 641 million tons of carbon dioxide-equivalent, compared with 2015, and emission per unit of supply will fall by 8.75%. And the coal supply industry would have a total emission of about 526 million tons of carbon dioxide-equivalent in 2030, compared with 2015, emission per unit of supply will fall by 15.34%. Based on that, the coal production capacity, the coal transportation capacity, and the carbon emissions of coal supply industry in each province were analyzed. And the relevant suggestions for the development of China's coal industry have been put forward, which can provide a good support for the related decision making and the carbon emission reduction of coal industry.
Key words: coal supply; pattern optimization; carbon emission; policy constraints
LIU Jun-bo , GAO Jun-lian , XU Xiang-yang . Pattern optimization and carbon emissions of coal supply in China[J]. JOURNAL OF NATURAL RESOURCES, 2019 , 34(3) : 473 -486 . DOI: 10.31497/zrzyxb.20190303
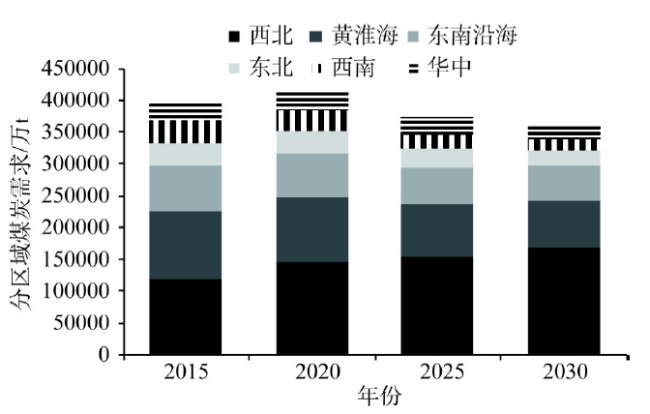
Fig. 1 The coal demand of different regions图1 分区煤炭需求 |
Table 1 The coal production capacities of diffierent provinces of China in 2020 (万t/年)表1 2020年各省煤炭产能 |
| 省区 | “十三五”政策 | EMi | 政策来源 |
|---|---|---|---|
| 北京 | 十三五期间逐步退出煤炭生产 | 0 | 煤炭工业发展“十三五”规划 |
| 陕西 | 产能控制在66000万t左右 | 66000 | 煤炭工业发展“十三五”规划 |
| 宁夏 | 宁东煤炭基地产量9000万t左右 | 10700 | 煤炭工业发展“十三五”规划 |
| 山东 | 煤炭产量压缩到10000万t左右 | 12000 | 煤炭工业发展“十三五”规划 |
| 河南 | 河南煤炭基地产量13500万t左右 | 16000 | 煤炭工业发展“十三五”规划 |
| 黑龙江 | 黑龙江维持2015年现有生产规模 | 8000 | 煤炭工业发展“十三五”规划 |
| 新疆 | 新疆煤炭产量25000万t左右 | 30000 | 煤炭工业发展“十三五”规划 |
| 贵州 | 云贵煤炭基地产量26000万t左右 | 31000 | 煤炭工业发展“十三五”规划 |
| 安徽 | 安徽煤炭产量控制在13000万t左右 | 15500 | 安徽省能源发展“十三五”规划 |
| 福建 | 十三五期间压缩产能600万t以上 | 1500 | 福建“十三五”能源发展专项规划 |
| 河北 | 煤炭产能控制在7000万t左右 | 7000 | 河北煤炭工业发展“十三五”规划 |
| 四川 | 全省生产原煤4500万t左右 | 5400 | 四川省“十三五”能源发展规划 |
| 江西 | 去产能1868万t | 1670 | 江西省“十三五”煤炭发展规划 |
| 湖南 | 湖南省煤炭产量2500万t左右 | 3000 | 湖南省煤炭“十三五”规划 |
| 重庆 | 预测煤炭产量2000万t左右 | 2400 | 重庆能源集团事业发展部 |
| 江苏 | 江苏省煤炭产量700万t左右 | 850 | 江苏省“十三五”规划 |
| 内蒙古 | 内蒙古煤炭产能130000万t左右 | 130000 | 内蒙古“十三五”规划 |
| 山西 | 山西省煤炭产能120000万t左右 | 120000 | 山西“十三五”规划 |
| 湖北 | “十三五”期间去产能800万t | 1400 | 湖北省政府工作报告 |
| 云南 | 煤炭产能不超过7000万t | 7000 | 云南省去产能规划 |
| 甘肃 | 退出产能1000万t | 5560 | 甘肃省工业领域去产能去库存降成本实施方案 |
Table 2 The CH4 emission factors from coal mining and its growth rates for each province of China in 2015表2 2015年各省煤矿瓦斯涌出系数与增长率 |
| 省区 | 涌出系数/(kg/t) | 年增长率 /% | 省区 | 涌出系数/(kg/t) | 年增长率 /% | 省区 | 涌出系数/(kg/t) | 年增长率 /% |
|---|---|---|---|---|---|---|---|---|
| 北京 | 0.495 | 0 | 福建 | 0.495 | 0 | 云南 | 6.137 | 2.354 |
| 河北 | 2.501 | -2.950 | 江西 | 6.646 | -4.262 | 重庆 | 22.908 | 0.778 |
| 山西 | 4.387 | 0.122 | 山东 | 0.819 | 2.536 | 陕西 | 0.931 | 0 |
| 内蒙古 | 0.635 | 3.041 | 河南 | 8.671 | -0.454 | 甘肃 | 1.284 | 0 |
| 辽宁 | 7.270 | -2.218 | 湖北 | 5.528 | 3.071 | 宁夏 | 6.020 | 0 |
| 吉林 | 3.787 | -2.127 | 湖南 | 6.239 | -2.890 | 青海 | 0.495 | 0 |
| 黑龙江 | 12.733 | 7.353 | 广西 | 0.263 | -15.588 | 新疆 | 2.105 | 0 |
| 江苏 | 2.636 | -3.094 | 四川 | 8.514 | 0.130 | |||
| 安徽 | 12.503 | -3.851 | 贵州 | 15.449 | -2.038 |
Table 3 The indirect emission factors for coal production (t/万t)表3 煤炭生产间接排放系数 |
| 省区 | 间接排放 | 省区 | 间接排放 | 省区 | 间接排放 | 省区 | 间接排放 | 省区 | 间接排放 |
|---|---|---|---|---|---|---|---|---|---|
| 北京 | 135.844 | 吉林 | 284.391 | 江西 | 211.284 | 广西 | 215.645 | 陕西 | 198.699 |
| 河北 | 240.014 | 黑龙江 | 231.246 | 山东 | 208.645 | 四川 | 256.605 | 甘肃 | 217.530 |
| 山西 | 234.758 | 江苏 | 199.336 | 河南 | 215.762 | 贵州 | 211.874 | 宁夏 | 234.522 |
| 内蒙古 | 276.638 | 安徽 | 218.708 | 湖北 | 205.440 | 云南 | 309.373 | 青海 | 241.852 |
| 辽宁 | 272.278 | 福建 | 203.554 | 湖南 | 225.849 | 重庆 | 259.857 | 新疆 | 226.674 |
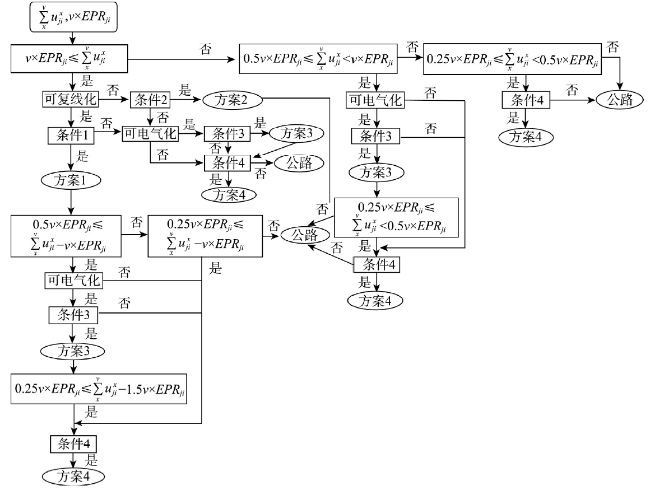
Fig. 2 The logic diagram of the choice of the transportation method图2 运输方式选择逻辑图 |
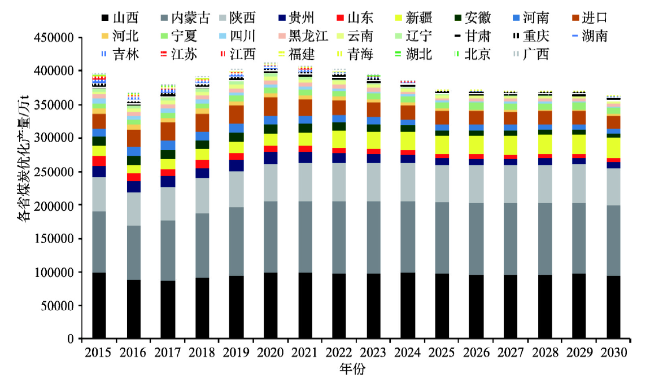
Fig. 3 The optimized layout of coal production图3 煤炭生产优化布局 |
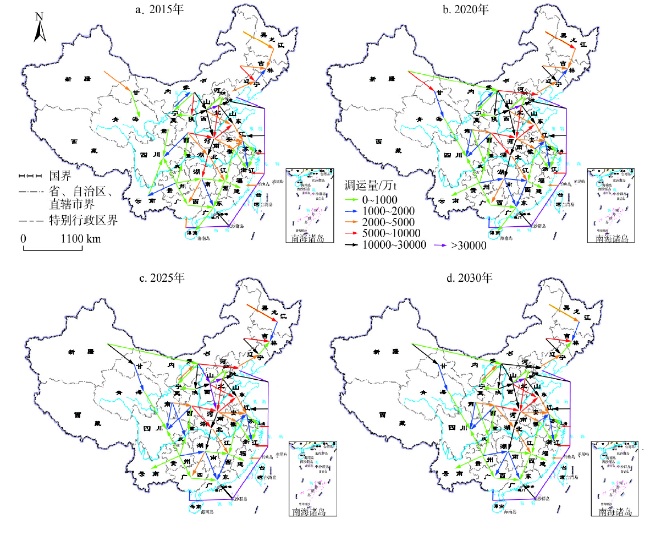
Fig. 4 The optimized pattern of coal transportation图4 煤炭调运优化格局 |
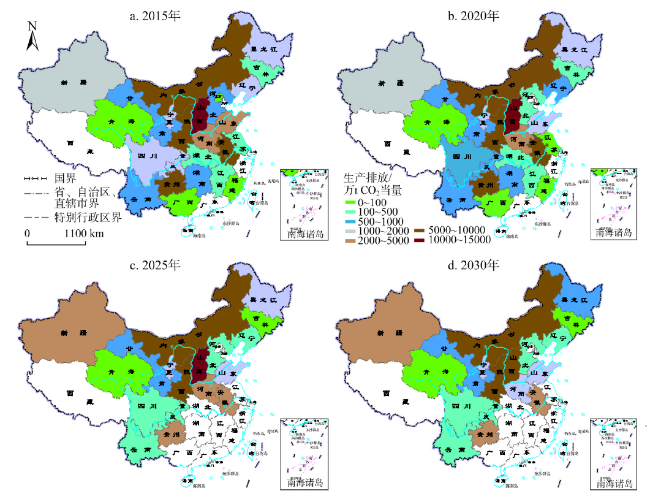
Fig. 5 The carbon emissions of coal production in each province of China图5 煤炭生产排放 |
Fig. 6 The total carbon emissions of coal supply industry图6 煤炭供应行业总排放 |
The authors have declared that no competing interests exist.
| [1] |
[
|
| [2] |
[
|
| [3] |
[
|
| [4] |
[
|
| [5] |
[
|
| [6] |
[
|
| [7] |
[
|
| [8] |
中国能源研究会. 中国能源展望2030. 北京: 经济管理出版社, 2016.
[
|
| [9] |
国家发展改革委, 国家能源局. 煤炭工业发展十三五规划. 2016.
[National Development and Reform Commission, National Energy Administration. Planning for the development of the coal industry in 13th Five-Year, 2016.]
|
| [10] |
国务院. 关于煤炭行业化解过剩产能实现脱困发展的意见. 2016. 关于煤炭行业化解过剩产能实现脱困发展的意见. 2016.
[The State Council.Opinions on removing overcapacity and realizing development from difficulty in coal industry. 2016. Opinions on removing overcapacity and realizing development from difficulty in coal industry. 2016.
|
| [11] |
[
|
| [12] |
[
|
| [13] |
[
|
| [14] |
|
| [15] |
[
|
| [16] |
[
|
| [17] |
[
|
| [18] |
[
|
| [19] |
铁道部. 铁路货物运价规则. 2005.
[Ministry of Railways. Railway Freight Tariff rules, 2005.]
|
| [20] |
[
|
| [21] |
[
|
| [22] |
[
|
/
| 〈 |
|
〉 |