
JOURNAL OF NATURAL RESOURCES >
Evaluation on natural capital loss in Southern Fujian Urban Agglomeration
Received date: 2018-06-12
Request revised date: 2018-10-20
Online published: 2019-01-20
Copyright
In the process of rapid urbanization, urban agglomeration development was promoting regional economic competition and cooperation, but also causing the intensification of contradictions between human and land, decline of ecosystem services level to a certain extent. In order to quantify the impact of urbanization on natural capital and reveal the influence mechanism of ecosystem service in human resource consumption process. In this study, Southern Fujian Urban Agglomeration (SFUA) is taken as an example, which is the typical rapidly urbanized area, emergy analysis method and GIS technology are used to analyze the spatial and temporal evolutions of renewable resources in the SFUA from 2000 to 2015, the evolution of eco-environment value and natural capital loss in the process of urbanization and land conversion. The results show that: (1) The renewable resources of SFUA presented a fluctuant decreasing trend in time, and gradually increasing trend in space; (2) The area proportion of urban land presented a significant increase trend in high environmental quality level, increased from 0 to 10.63%, the loss of regional eco-environment value caused by human activities was gradually rising; (3) Due to urbanization in the process of urban expansion, part of the natural land and agricultural land was converted to urban land, the total loss of natural capital caused by the conversion was 1.27E+22 seJ, and the currency value was more than 6.3 billion yuan. This study can help improve the research of eco-environmental effects due to urbanization, and provide decision-making reference for the urban agglomeration or regional eco-environment management and restoration.
FAN Bing-xiong , SHUI Wei , YANG Hai-feng , WANG Ya-nan , DU Yong , QI Xin-hua , ZHANG Xiao-hong , JIAN Xiao-mei , GUO Ping-ping . Evaluation on natural capital loss in Southern Fujian Urban Agglomeration[J]. JOURNAL OF NATURAL RESOURCES, 2019 , 34(1) : 153 -167 . DOI: 10.31497/zrzyxb.20190113
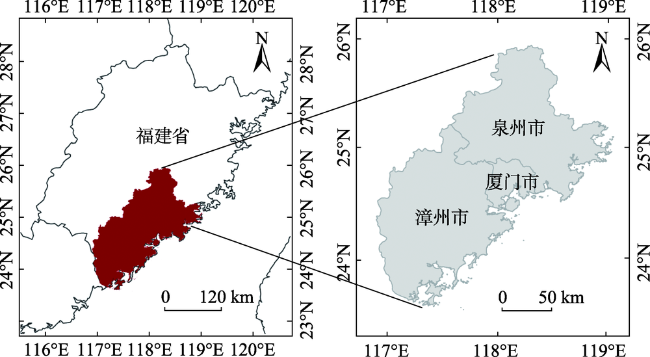
Fig. 1 Location of Southern Fujian Urban Agglomeration (Xiamen, Zhangzhou and Quanzhou)图1 闽三角城市群区位 |
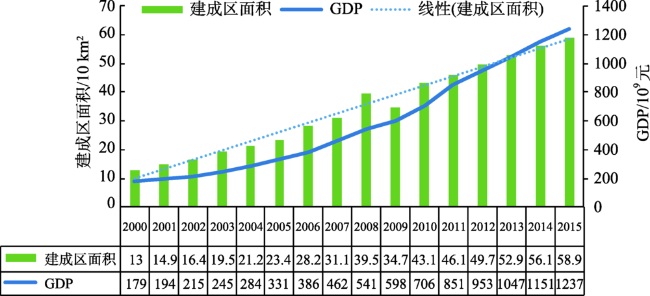
Fig. 2 The change of built-up area and GDP in Southern Fujian Urban Agglomeration from 2000 to 2015图2 2000-2015年闽三角城市群建成区面积与GDP变化情况 |
Table 1 The formula of renewable resource emergy accounting and the explanation of related parameters表1 可更新资源能值计算公式与相关参数说明 |
| 可更新能流 | 能量方程式 | 参数说明 | 参数处理 |
|---|---|---|---|
| 太阳辐射能 | (引自文献[16]) | Ts为光照时间(秒);S为太阳辐照度(1360.8 W/m2);α为太阳反照率;TR为太阳辐射能值转换率(1seJ/J)[17] | (1)光照时间:克里金插值得到 (2)太阳反照率:土地利用数据重分类得到 |
| 地热能 | A为面积(m2);Te为年平均地表温度(℃);Ts为地表1000 m以下温度(℃);Engeo为热流单位面积(J/m2) | Engeo:中国大陆地区大地热流数据汇编(第二、三、四版)[18,19,20]利用克里金插值得到 | |
| 风能 | ρ为空气密度(1.3 kg/m3);CD为阻力系数;V为风速;t为刮风时间;TR为风能能值转化率(1578 seJ/J)[21] | (1)CD:基于不同地表类型分别取值为0.01、0.02、0.03 (2)风速:克里金插值得到 | |
| 降雨化学能 | ET为土壤水分蒸发量(m/a-1);P为降雨量(mm/a-1);L为300+25T2+0.05T3 (T为年平均温度);ρ为水密度(1000 kg/m-3);G为吉布斯自由能值;TR为能值转换率(6360 seJ/J)[16] | (1)降雨量:克里金插值得到 (2)气温:克里金插值得到 | |
| 降雨位势能 | ρ为水密度(1000 kg/m-3);R为径流量;g为重力加速度;h为海拔;TR为降水重力势能能值转换率(10909 seJ/J)[16] | 径流量(R)及海拔高度(h):基于DEM在ArcGIS通过空间分析模块进行提取 | |
| 潮汐能① | A为大陆架及海面100 m内面积;ρ为海水密度(1.025E+06 g/m3);Ft为每年发生潮汐次数(730次);h为平均潮汐高差;g为重力加速度(9.8 m/s2);Tr为潮汐能能值转化率(1.68E+04 seJ/J)[22] | 由于数据格式与制图难度等问题,研究对潮汐能仅进行能值核算 | |
| 可更新能值 | Es为太阳辐射能量;Egeo为地热能能值; Ew为风能能值;Erc为降雨化学能能值;Erg为降雨位势能能值;Et为潮汐能能值 | 降雨化学能、位势能与潮汐能能值进行叠加,然后利用最大合成法(MVC)得到可更新能值图 |
注:① 2000年潮汐能:大陆架及海面100 m内面积为1294 km2; 平均潮汐高差为4.2 m(引自文献[23]) 能值=(1.294 E+09 m2) × (1.025 E+03 kg/m3) × (730次) × (4.2 m)2 × (9.8 m/s2) × (1.68 E+04 seJ/J)=2.81 E+21 seJ/a; 2005年潮汐能:大陆架及海面100 m内面积为1305 km2; 平均潮汐高差为3.9 m(引自潮汐表:2007[24]) 能值=(1.305 E+09 m2) × (1.025 E+03 kg/m3) × (730次) × (3.9 m)2 × (9.8 m/s2) × (1.68 E+04 seJ/J)=2.44 E+21 seJ/a; 2010年潮汐能:大陆架及海面100 m内面积为1346 km2; 平均潮汐高差为4.5 m(引自潮汐表:2010[25]) 能值=(1.346 E+09 m2) × (1.025 E+03 kg/m3) × (730次) × (4.5 m)2 × (9.8 m/s2) × (1.68 E+04 seJ/J)=3.35 E+21 seJ/a; 2015年潮汐能:大陆架及海面100 m内面积为1350 km2; 平均潮汐高差为4.8 m(引自潮汐表:2015[26]) 能值=(1.350 E+09 m2) × (1.025 E+03 kg/m3) × (730次) × (4.8 m)2 × (9.8 m/s2) × (1.68 E+04 seJ/J)=3.83 E+21 seJ/a。 |
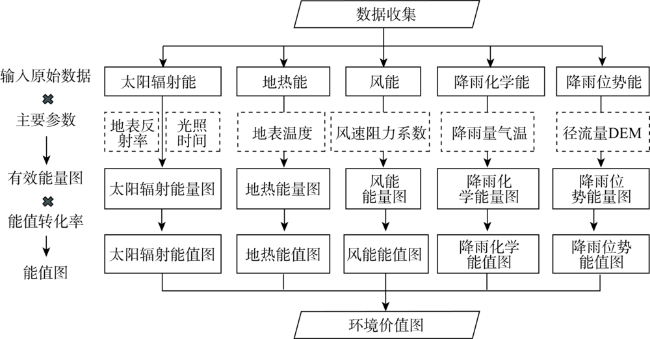
Fig. 3 The technical route of environmental value by emergy accounting图3 环境价值能值核算的技术路线 |
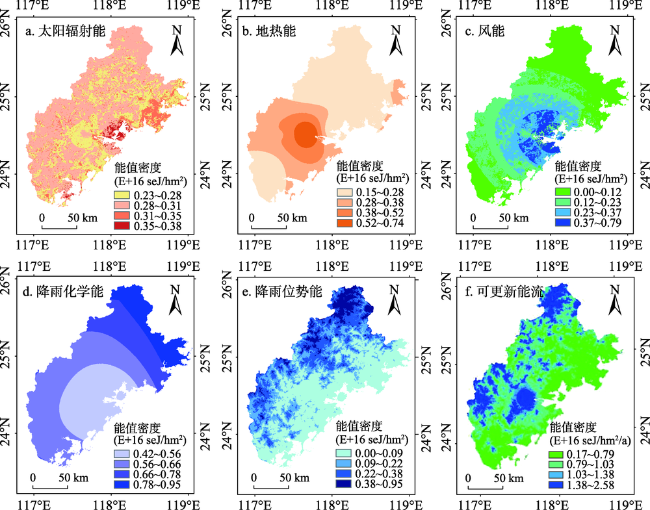
Fig. 4 The emergy density of renewable resources in Southern Fujian Urban Agglomeration in 2015图4 2015年闽三角城市群可更新资源的能值密度 |
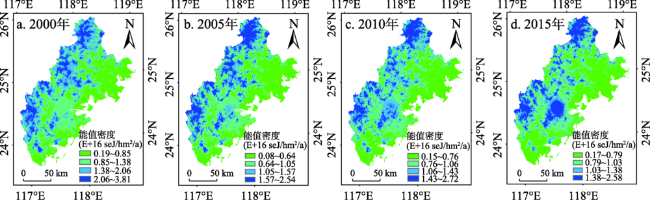
Fig. 5 The emergy density of renewable energy in 2000, 2005, 2010 and 2015图5 2000年、2005年、2010年和2015年可更新能源能值密度 |
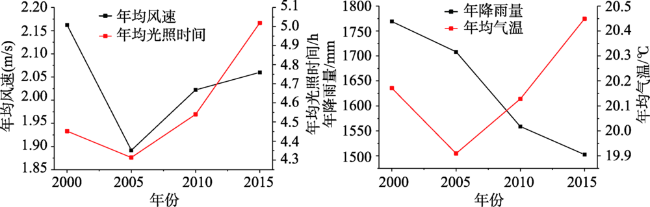
Fig. 6 The trend of annual average wind speed, average sunshine time, average rainfall and average temperature from 2000 to 2015图6 20002015年年均风速、年均光照时间、年降雨量和年均气温变化趋势 |
Table 2 The statistical results of renewable resources emergy and NPP in Southern Fujian Urban Agglomeration from 2000 to 2015表2 2000-2015年闽三角城市群可更新资源能值与NPP的统计结果 |
| 年份 | Avg | Min | Max | SD | Sum(seJ/a) | |
|---|---|---|---|---|---|---|
| 2000 | R(seJ/hm2/a) | 1.22E+16 | 1.92E+15 | 3.81E+16 | 6.13E+15 | 4.03E+21 |
| NPP(gC/hm2/a) | 9.58E+05 | 0 | 2.19E+06 | 5.15E+05 | 2.35E+11 | |
| 2005 | R(seJ/hm2/a) | 8.73E+15 | 8.64E+14 | 2.54E+16 | 4.49E+15 | 3.33E+21 |
| NPP(gC/hm2/a) | 9.08E+05 | 0 | 1.92E+06 | 4.44E+05 | 2.23E+11 | |
| 2010 | R(seJ/hm2/a) | 8.54E+15 | 1.52E+15 | 2.72E+16 | 2.96E+15 | 3.52E+21 |
| NPP(gC/hm2/a) | 9.20E+05 | 0 | 1.99E+06 | 4.82E+05 | 2.26E+11 | |
| 2015 | R(seJ/hm2/a) | 8.91E+15 | 1.08E+15 | 2.58E+16 | 2.48E+15 | 4.72E+21 |
| NPP(gC/hm2/a) | 1.09E+06 | 0 | 2.07E+06 | 5.42E+05 | 2.67E+11 |
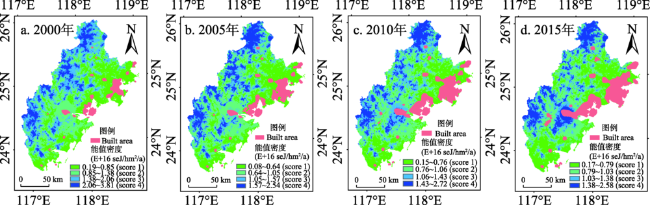
Fig. 7 The distribution of environmental value and urban land in 2000, 2005, 2010 and 2015图7 2000年、2005年、2010年和2015年环境价值与城镇用地分布情况 |
Table 3 The proportion of urban land in different environmental quality levels from 2000 to 2015表3 2000-2015年不同环境质量等级中城镇用地占比统计 |
| 年份 | 环境质量 等级 | 面积 /104 hm2 | 城镇用地 /104 hm2 | 城镇用地 占比/% |
|---|---|---|---|---|
| 2000 | 1 | 55.31 | 6.83 | 12.34 |
| 2 | 56.53 | 1.06 | 1.87 | |
| 3 | 44.37 | 0.02 | 0.05 | |
| 4 | 22.86 | 0 | 0 | |
| 2005 | 1 | 52.05 | 13.45 | 24.47 |
| 2 | 60.03 | 2.05 | 3.41 | |
| 3 | 52.44 | 1.16 | 2.21 | |
| 4 | 25.55 | 0 | 0 | |
| 2010 | 1 | 51.22 | 15.88 | 30.68 |
| 2 | 41.54 | 1.35 | 2.41 | |
| 3 | 41.43 | 1.62 | 3.91 | |
| 4 | 24.44 | 0.66 | 2.72 | |
| 2015 | 1 | 58.09 | 18.59 | 32.31 |
| 2 | 56.16 | 2.97 | 5.28 | |
| 3 | 50.94 | 1.79 | 3.51 | |
| 4 | 27.88 | 3.06 | 10.63 |
Table 4 The natural capital loss in the process of urbanization from 2000 to 2015表4 2000-2015年城镇化进程中自然资本损失 |
| 年份 | 项目 | 农业用地转城市用地 | 自然用地转城市用地 | 总计 |
|---|---|---|---|---|
| 2000-2005 | 损失面积/hm2 | 1.11E+04 | 2.00E+02 | 1.13E+04 |
| 植物生物量损失/seJ | 2.77E+21 | 8.58E+20 | 3.63E+21 | |
| 有机碳损失/seJ | 1.25E+21 | 4.49E+19 | 1.29E+21 | |
| 自然资本损失/seJ | 4.01E+21 | 9.03E+20 | 4.92E+21 | |
| 2005-2010 | 损失面积/hm2 | 3.60E+03 | 1.00E+03 | 4.60E+03 |
| 植物生物量损失/seJ | 8.99E+20 | 4.14E+21 | 5.04E+21 | |
| 有机碳损失/seJ | 4.04E+20 | 2.24E+20 | 6.28E+20 | |
| 自然资本损失/seJ | 1.30E+21 | 4.36E+21 | 5.66E+21 | |
| 2010-2015 | 损失面积/hm2 | 1.60E+03 | 4.00E+02 | 2.00E+03 |
| 植物生物量损失/seJ | 3.99E+20 | 1.46E+21 | 1.86E+21 | |
| 有机碳损失/seJ | 1.79E+20 | 8.97E+19 | 2.69E+20 | |
| 自然资本损失/seJ | 5.79E+20 | 1.55E+21 | 2.13E+21 | |
| 注: | ||||
| 自然用地转化为城市用地(2010-2015年) | ||||
| 1、植物生物量损失 | ||||
| 自然用地损失面积 | 4.00E+02 | hm2 | 表5 | |
| 每公顷自然用地生物量 | 446.4 | t/hm2 | IPCC[35] | |
| 自然用地转化损失的生物总量 | 1.79E+05 | t | ||
| UEV(R/NPP)[32] | 8.17E+09 | seJ/g | 表3 | |
| Emergy | 1.46E+21 | seJ | ||
| 2、有机碳损失 | ||||
| 自然用地损失面积4.00E+02 | 4.00E+02 | hm2 | 表5 | |
| 每公顷自然用地有机碳 | 3.6 | Kg/m2 | IPCC[35] | |
| 自然用地转化损失的有机碳 | 1.44E+10 | g | ||
| UEV | 6.23E+09 | seJ/g | Odum[21] | |
| Emergy | 8.97E+19 | seJ | ||
| 农业用地转化为城市用地(2010-2015年) | ||||
| 1、植物生物量损失 | ||||
| 农业用地损失面积 | 1.60E+03 | hm2 | 表5 | |
| 每公顷农业用地生物量 | 148.8 | t/hm2 | IPCC[35] | |
| 农业用地转化损失的生物总量 | 2.38E+05 | t | ||
| UEV | 1.68E+09 | seJ/g | Jiang[36] | |
| Emergy | 3.99E+20 | seJ | ||
| 2、有机碳损失 | ||||
| 农业用地损失面积 | 1.60E+03 | hm2 | 表5 | |
| 每公顷农业用地有机碳 | 1.8 | kg/m2 | IPCC[35] | |
| 农业用地转化损失的有机碳 | 2.88E+10 | g | ||
| UEV | 6.23E+09 | seJ/g | Odum[21] | |
| Emergy | 1.79E+20 | seJ | ||
The authors have declared that no competing interests exist.
| [1] |
[
|
| [2] |
|
| [3] |
|
| [4] |
|
| [5] |
|
| [6] |
|
| [7] |
|
| [8] |
|
| [9] |
|
| [10] |
|
| [11] |
|
| [12] |
|
| [13] |
|
| [14] |
[
|
| [15] |
|
| [16] |
|
| [17] |
|
| [18] |
[
|
| [19] |
[
|
| [20] |
[
|
| [21] |
|
| [22] |
|
| [23] |
[
|
| [24] |
国家海洋信息中心. 潮汐表2 2007. 济南,: 山东省地图出版社, 2006: 43-46.
[
|
| [25] |
国家海洋信息中心. 2011潮汐表. 海洋出版社, 2010: 58-60.
[
|
| [26] |
[
|
| [27] |
|
| [28] |
|
| [29] |
|
| [30] |
[
|
| [31] |
|
| [32] |
|
| [33] |
[
|
| [34] |
[
|
| [35] |
IPCC. Guidelines for national greenhouse gas inventories, agriculture, forestry and other land use, 4. 4; 2006.
|
| [36] |
|
| [37] |
|
| [38] |
|
| [39] |
[
|
| [40] |
[
|
| [41] |
|
| [42] |
[
|
| [43] |
[
|
/
| 〈 |
|
〉 |