
JOURNAL OF NATURAL RESOURCES >
Research on the causes for hydrological drought trendin Poyang Lake
Received date: 2018-06-21
Request revised date: 2018-11-22
Online published: 2019-01-20
Copyright
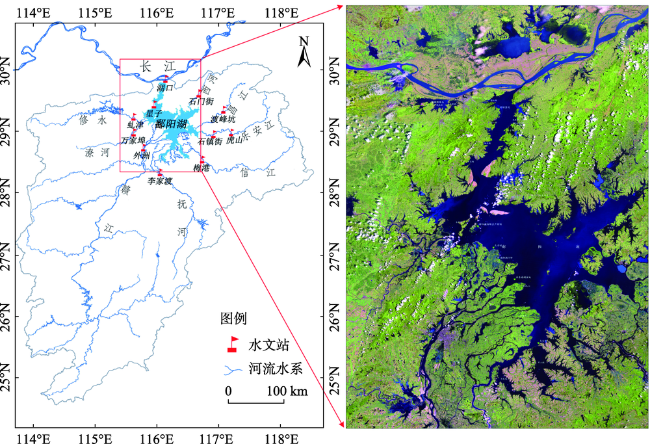
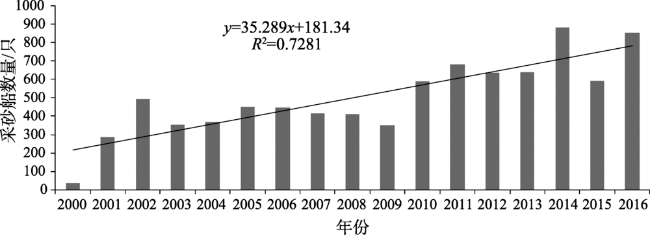
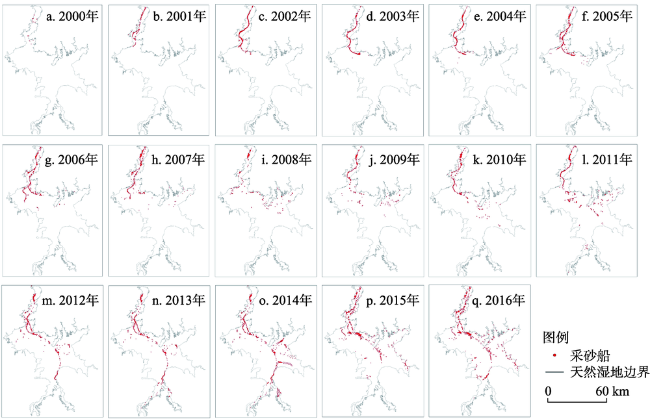
Poyang Lake is the largest fresh water lake in China. Seasonal fluctuation of water level is a typical hydrological feature of Poyang Lake. And Poyang Lake wetland is one of the most important international wetlands and the largest habitat for wintering birds in East Asia. Since the beginning of the 21st century, the hydrological drought trend of Poyang Lake that emerged in autumn and winter seasons has not only posed serious threats to the local freshwater/wetland ecological security, but also attracted wide attention from the public. It is therefore of great significance to precisely monitor hydrological changes in the study lake and reveal the underlying drivers. Some studies suggest that the drought trend of Poyang Lake is related to the decrease of precipitation in the basin or the running of Three Gorges Dam (TGD) displaced in the middle reach of Yangtze River. Lai et al. argued theoretically that the drought trend in Poyang Lake was caused by sand minning in the lake. In this study, we used the long term records of LANDSAT images to locate and analyze sand mining in Poyang Lake during 2000-2016. On this basis, long time-series hydrological data were used to analyse hydrological changes. Finally, we combined these two datasets to investigate the impact of sand mining on the drought trend of Poyang Lake. Our results showed that: (1) During 2000-2016, an increasing number of vessels involved in sand mining was observed in the lake, and the sand mining has been extended to the whole lake region, including its southernmost tip and ecologically sensitive areas; (2) The drought period of Poyang Lake tended to be prolonged, and a decreasing water surface gradient and an increasing outflow from Poyang Lake into Yangtze River at similar water level happened in these years; (3) Sand mining, causing river channel connecting Poyang Lake with Yangtze River becoming deeper and wider, contributed to the hydrological drought in autumn and winter of the lake. (4) Three Gorges Dam (TGD), which reduced the water level in downstream, and weakened the backwater effect to Poyang Lake drainage from Yangtze River, could also be one of the reasons for hydrological change in Poyang Lake. In recent years, Jiangxi provincial government has been promoting Poyang Lake Water Conservancy Project to deal with the drought trend. We should urge the departments concerned to formulate a comprehensive management scheme for Poyang Lake according to the main causes for hydrological changes.
Key words: hydrological changes; sand mining; Poyang Lake; Three Gorges Dam; cause analysis
QI Shu-hua , ZHANG Xiu-xiu , JIANG Feng , WANG Peng . Research on the causes for hydrological drought trendin Poyang Lake[J]. JOURNAL OF NATURAL RESOURCES, 2019 , 34(1) : 168 -178 . DOI: 10.31497/zrzyxb.20190114
Fig. 1 Poyang Lake and the main rivers in Poyang Lake watershed图1 鄱阳湖流域主要水系和鄱阳湖 |
Fig. 2 Number of vessels involved in sand mining in Poyang Lake in flood season during 2000-2016图2 2000-2016年鄱阳湖丰水期采砂船数量变化 |
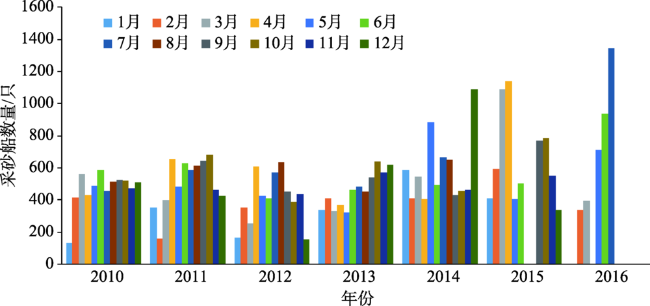
Fig. 3 Number of vessels involved in sand mining in Poyang Lake for each month during 2010-2016图3 2010-2016年各月份采砂船数量变化 |
Fig. 4 The distribution of vessels involved in sand mining in Poyang Lake in flood season during 2000-2016图4 2000-2016年鄱阳湖丰水期采砂船分布 |
Table 1 The drought duration in recent years according to water level records from Xingzi station表1 近年鄱阳湖枯水期变化(据星子水文站) |
| 年份 | 枯水天数/d | |||||
|---|---|---|---|---|---|---|
| <5.5 m | 5.5~6 m | 6~7 m | 7~8 m | 8~9 m | 9~10 m | |
| 2003 | 0 | 1 | 31 | 54 | 83 | 118 |
| 2004 | 31 | 61 | 83 | 118 | 175 | 190 |
| 2005 | 0 | 0 | 34 | 71 | 95 | 152 |
| 2006 | 0 | 6 | 83 | 139 | 184 | 229 |
| 2007 | 20 | 61 | 100 | 145 | 195 | 222 |
| 2008 | 9 | 42 | 86 | 109 | 127 | 159 |
| 2009 | 0 | 55 | 123 | 141 | 167 | 188 |
| 2010 | 0 | 13 | 57 | 88 | 122 | 142 |
| 2011 | 0 | 0 | 70 | 181 | 239 | 264 |
| 2012 | 0 | 9 | 19 | 59 | 104 | 134 |
| 2013 | 3 | 16 | 69 | 122 | 148 | 188 |
| 2014 | 4 | 52 | 69 | 90 | 144 | 169 |
| 1951-1999年平均 | 3.4 | 12.7 | 42.7 | 73.5 | 100 | 126.4 |
| 2000-2014年平均 | 4.5 | 18.9 | 56.6 | 97.8 | 136 | 169.5 |
Table 2 The average, maximum and minimum water levels at Xingzi gauging station in each decadal period (m)表2 星子水位站和湖口水文站主要时段的平均水位、平均年最高水位和最低水位 |
| 时段 | 平均水位 | (星子—湖口) 平均水位差 | 平均年最高水位 | 平均年最低水位 | ||||
|---|---|---|---|---|---|---|---|---|
| 星子站 | 湖口站 | 星子站 | 湖口站 | 星子站 | 湖口站 | |||
| 1950s | 11.675 | 11.125 | 0.550 | 16.677 | 16.609 | 5.924 | 4.956 | |
| 1960s | 11.160 | 10.721 | 0.439 | 16.479 | 16.568 | 5.586 | 4.737 | |
| 1970s | 11.256 | 10.737 | 0.519 | 17.087 | 17.075 | 5.932 | 5.018 | |
| 1980s | 11.744 | 11.223 | 0.521 | 17.295 | 16.976 | 6.144 | 5.332 | |
| 1990s | 11.917 | 11.496 | 0.421 | 18.751 | 18.768 | 6.464 | 5.585 | |
| 2000-2002 | 11.537 | 11.021 | 0.516 | 16.483 | 16.520 | 6.813 | 5.890 | |
| 2003-2005 | 10.650 | 10.753 | -0.103 | 16.629 | 16.680 | 5.796 | 5.470 | |
| 2006-2009 | 10.028 | 9.715 | 0.313 | 16.677 | 16.609 | 5.924 | 4.956 | |
| 2010-2014 | 10.699 | 10.518 | 0.181 | 16.479 | 16.568 | 5.586 | 4.737 | |
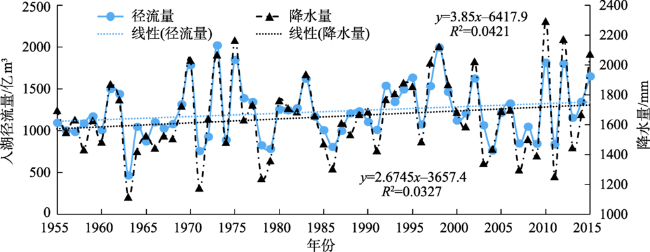
Fig. 5 The annual average precipitation and annual runoff dynamics during 1955-2013图5 1955-2013年间的鄱阳湖流域“五河”入湖径流和降水量的年度变化趋势 |
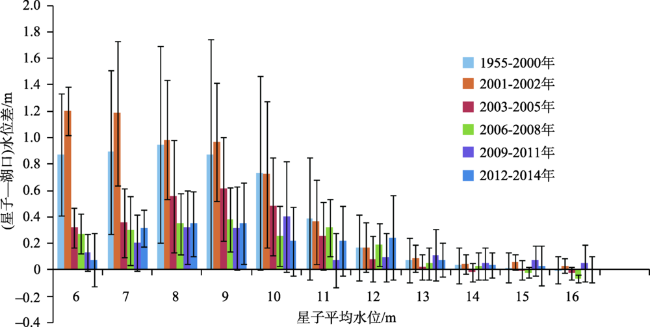
Fig. 6 The water level difference between Hukou and Xingzi gauging stations in different periods图6 不同时期一定水位下的星子与湖口水位差及其标准差 |
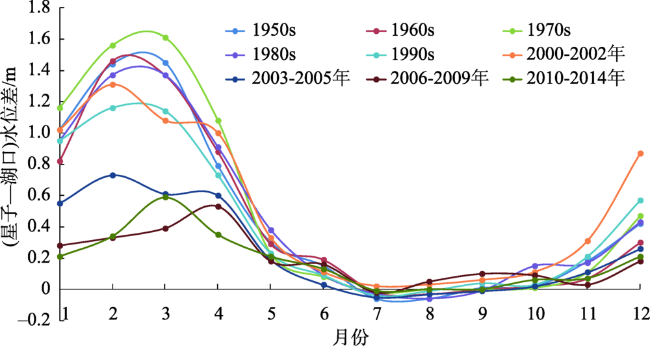
Fig. 7 Monthly dynamics of the difference of water level gauged at Xingzi and Hukou stations in different periods图7 不同时期星子—湖口段水位差的季节变化特征 |
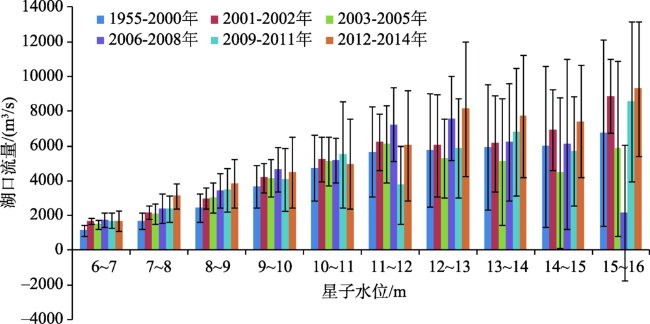
Fig. 8 Comparison of water discharge rate from Poyang Lake to Yangtze River at different water levels in different periods图8 不同时期一定水位下鄱阳湖出湖径流量和标准差 |
The authors have declared that no competing interests exist.
| [1] |
[
|
| [2] |
[
|
| [3] |
[
|
| [4] |
[
|
| [5] |
|
| [6] |
|
| [7] |
|
| [8] |
|
| [9] |
|
| [10] |
[
|
| [11] |
|
| [12] |
[
|
| [13] |
|
| [14] |
|
| [15] |
[
|
| [16] |
[
|
| [17] |
江西省科学院, 中国科学院南京地理与湖泊研究所, 江西省山江湖开发治理委员会办公室. 鄱阳湖地图集, 北京: 科学出版社, 1993: 6.
[Jiangxi Provincial Academy of Sciences, Nanjing Institute of Geography & Limnology,
|
/
| 〈 |
|
〉 |