
JOURNAL OF NATURAL RESOURCES >
The rationality of the model of tourism economic growth in forest parks based on the comparative advantage of resources
Received date: 2018-07-12
Request revised date: 2018-12-03
Online published: 2019-02-28
Copyright
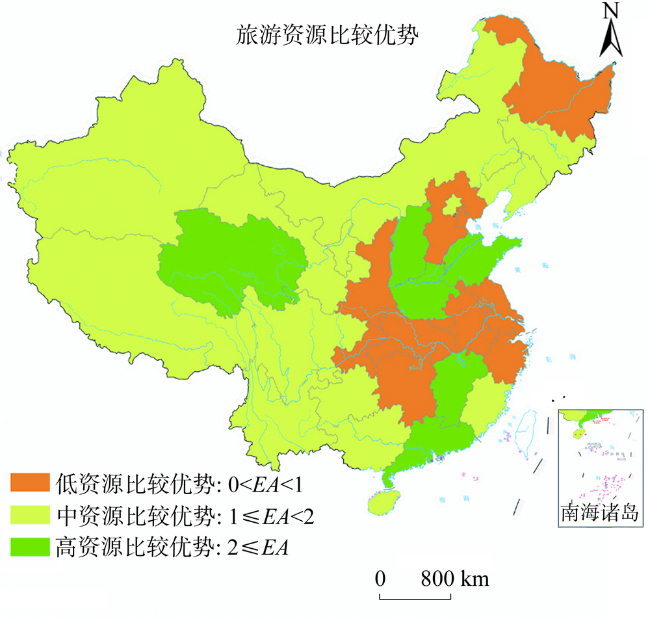
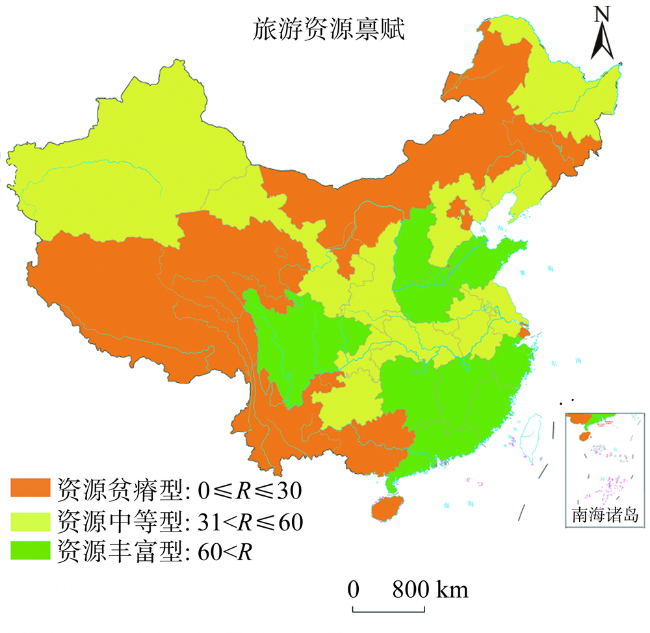
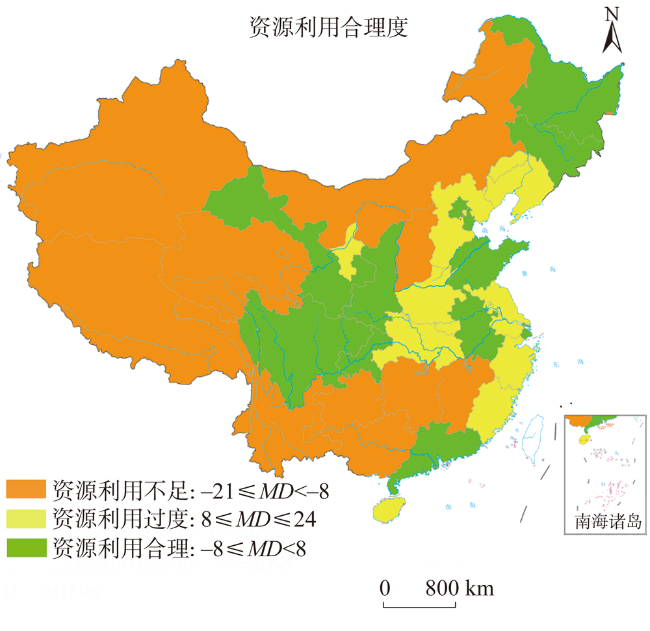
To study the rationality of tourism development model in forest parks can provide important bases for improving the utilization efficiency of forest tourism resources and protecting forest resources. This article uses the Cobb-Douglas production function to determine the type of the tourism growth model in forest parks at the provincial level and analyzes the effects and utilization efficiency of tourism resources in the tourism growth process of forest parks in perspectives of the "resource comparative advantage" and "resource utilization rationality". The main findings include: (1) The average contribution rates of capital investment, labor input, tourism resource endowment and generalized technological progress in forest parks are respectively 0.5132, 0.1712, 0.0697 and 0.2457 during the period from 2004 to 2014. There are five types of "capital-related-driven tourism growth model" in 24 provincial level areas (hereafter provinces). There are four types of "generalized technological progress-related-driven growth model" in 21 provinces, mainly in the central and western regions. There are only two types of "tourism resources-related-driven growth model" in 3 provinces. (2) In the process of tourism growth in China's forest parks, there is not only a phenomenon of redundant capital investment, but also a phenomenon of insufficient utilization of tourism resources. The utilization of tourism resources in some provinces is unreasonable due to excessive capital investment, which directly leads to "over-utilization of tourism resources" and "underutilization of tourism resources". The analysis shows that tourism resources in 19 provinces have not been rationally utilized. Among them, the tourism resources in 8 provinces are over-developed, dominated by the eastern coastal and central provinces, and the tourism resources in 11 provinces are underutilized, which is mainly in the southwest and northwest regions. In addition, only the forest tourism resources in 12 provinces such as Beijing, Tianjin and Shanghai can be developed and utilized reasonably. (3) There exists incomplete matchable development status among tourism resource endowment, comparative advantage of tourism resources and rational utilization of tourism resources due to the difference of capital investment in each province. The comparative advantages of tourism resources in the provinces with poor tourism resources are mostly at the intermediate level, but the state of resource utilization is mostly insufficient. The comparative advantage of tourism resources in provinces with medium tourism resources is mostly at a low level. Meanwhile, the provinces with rich tourism resources are generally those with a large amount of resources, but the state of tourism resource utilization is uncertain.
HUANG Jie-long , WANG Li-qun , CHEN Qiu-hua . The rationality of the model of tourism economic growth in forest parks based on the comparative advantage of resources[J]. JOURNAL OF NATURAL RESOURCES, 2019 , 34(2) : 261 -273 . DOI: 10.31497/zrzyxb.20190204
Table 1 Output elasticity of forest park input elements表1 森林公园投入要素的产出弹性 |
| 旅游收入 | 系数 | 标准误差 | P值 |
|---|---|---|---|
| lnK | 0.3886*** | 0.0492 | 0.000 |
| lnL | 0.5331*** | 0.0719 | 0.000 |
| lnR | 0.3074*** | 0.1059 | 0.004 |
| cons | 1.2978 | 0.3442 | 0.000 |
| R-square | 0.7293 | ||
| Number of obs | 339 | ||
注:***表示在10%以下的显著性水平。 |
Table 2 Provincial contribution of production factors and generalized technology表2 各省生产要素和广义技术的贡献率 |
| 省份 | 资本贡献率 | 劳动力贡献率 | 旅游资源贡献率 | 广义技术贡献率 | |||||||
|---|---|---|---|---|---|---|---|---|---|---|---|
| 数值 | 排序 | 数值 | 排序 | 数值 | 排序 | 数值 | 排序 | ||||
| 北京 | 0.4296 | 16 | 0.4777 | 4 | 0.0788 | 11 | 0.0139 | 24 | |||
| 天津 | 0.5573 | 11 | 0.1448 | 15 | -0.0591 | 31 | 0.3569 | 17 | |||
| 河北 | 0.2869 | 22 | 0.0518 | 24 | 0.0756 | 12 | 0.5857 | 7 | |||
| 山西 | 0.1354 | 30 | 0.0539 | 22 | 0.0290 | 22 | 0.7817 | 2 | |||
| 内蒙古 | 0.1859 | 26 | 0.0474 | 27 | 0.0160 | 25 | 0.7508 | 4 | |||
| 辽宁 | 0.3061 | 21 | 0.1685 | 11 | 0.0140 | 27 | 0.5114 | 8 | |||
| 吉林 | 1.6042 | 2 | 0.0493 | 26 | 0.0361 | 19 | -0.6896 | 30 | |||
| 黑龙江 | 0.5615 | 10 | 0.2115 | 7 | 0.0152 | 26 | 0.2118 | 21 | |||
| 上海 | 1.6321 | 1 | 0.0789 | 21 | 0.0230 | 23 | -0.7339 | 31 | |||
| 江苏 | 0.9449 | 3 | 0.1793 | 10 | 0.1385 | 4 | -0.2628 | 26 | |||
| 浙江 | 0.4169 | 18 | 0.1580 | 13 | 0.0899 | 9 | 0.3352 | 18 | |||
| 安徽 | 0.2549 | 24 | 0.1984 | 9 | 0.0517 | 15 | 0.4950 | 9 | |||
| 福建 | 0.5308 | 12 | 0.6398 | 1 | 0.1382 | 5 | -0.3089 | 27 | |||
| 江西 | 0.1693 | 28 | 0.0908 | 20 | 0.0606 | 13 | 0.6793 | 6 | |||
| 山东 | 0.2291 | 25 | 0.1649 | 12 | 0.1846 | 2 | 0.4214 | 14 | |||
| 河南 | 0.2856 | 23 | 0.2014 | 8 | 0.0897 | 10 | 0.4233 | 13 | |||
| 湖北 | 0.1234 | 31 | 0.0940 | 19 | 0.0377 | 17 | 0.7449 | 5 | |||
| 湖南 | 0.6848 | 6 | 0.2647 | 6 | 0.1118 | 7 | -0.0613 | 25 | |||
| 广东 | 0.4397 | 15 | 0.3050 | 5 | 0.1100 | 8 | 0.1453 | 22 | |||
| 广西 | 0.3892 | 20 | 0.1229 | 16 | 0.0320 | 21 | 0.4559 | 10 | |||
| 海南 | 0.8874 | 4 | 0.4869 | 3 | 0.1679 | 3 | -0.5422 | 29 | |||
| 重庆 | 0.5035 | 14 | 0.0527 | 23 | 0.0374 | 18 | 0.4064 | 15 | |||
| 四川 | 0.1598 | 29 | -0.0240 | 31 | 0.0443 | 16 | 0.8199 | 1 | |||
| 贵州 | 0.1834 | 27 | 0.0446 | 28 | 0.0118 | 28 | 0.7602 | 3 | |||
| 云南 | 0.4158 | 19 | 0.1538 | 14 | 0.0063 | 29 | 0.4241 | 12 | |||
| 西藏 | 0.8511 | 5 | 0.1169 | 18 | 0.0045 | 30 | 0.0274 | 23 | |||
| 陕西 | 0.5558 | 12 | 0.0222 | 30 | 0.0579 | 14 | 0.3641 | 16 | |||
| 甘肃 | 0.5732 | 8 | 0.0410 | 29 | 0.1128 | 6 | 0.2730 | 20 | |||
| 青海 | 0.6289 | 7 | 0.0495 | 25 | 0.0342 | 20 | 0.2875 | 19 | |||
| 宁夏 | 0.5666 | 9 | 0.5405 | 2 | 0.3926 | 1 | -0.4997 | 28 | |||
| 新疆 | 0.4182 | 17 | 0.1219 | 17 | 0.0192 | 24 | 0.4407 | 11 | |||
| 全国平均 | 0.5132 | 0.1712 | 0.0697 | 0.2457 | |||||||
Table 3 Comparative advantage value of tourism resources of forest parks in each province comparative表3 各省森林公园旅游资源比较优势值 |
| 省份 | 比较优势 | 排序 | 省份 | 比较优势 | 排序 | 省份 | 比较优势 | 排序 |
|---|---|---|---|---|---|---|---|---|
| 河南 | 3.1648 | 1 | 辽宁 | 1.4587 | 12 | 浙江 | 0.7886 | 23 |
| 山西 | 2.6544 | 2 | 福建 | 1.4197 | 13 | 河北 | 0.7656 | 24 |
| 青海 | 2.5578 | 3 | 云南 | 1.3101 | 14 | 重庆 | 0.5753 | 25 |
| 广东 | 2.2314 | 4 | 吉林 | 1.2752 | 15 | 湖北 | 0.5752 | 26 |
| 江西 | 2.0962 | 5 | 四川 | 1.1732 | 16 | 黑龙江 | 0.5333 | 27 |
| 山东 | 2.0061 | 6 | 内蒙古 | 1.1403 | 17 | 江苏 | 0.3432 | 28 |
| 新疆 | 1.9630 | 7 | 北京 | 1.0747 | 18 | 湖南 | 0.2790 | 29 |
| 甘肃 | 1.9398 | 8 | 贵州 | 1.0745 | 19 | 上海 | 0.2423 | 30 |
| 西藏 | 1.9232 | 9 | 宁夏 | 1.0278 | 20 | 天津 | 0.0878 | 31 |
| 广西 | 1.8485 | 10 | 陕西 | 0.9244 | 21 | |||
| 海南 | 1.7190 | 11 | 安徽 | 0.8247 | 22 | 全国平均 | 1.3225 |
Fig. 1 Comparative advantage of tourism resources图1 旅游资源比较优势 |
Fig. 2 Tourism resources endowment图2 旅游资源禀赋 |
Fig. 3 Reasonable use of tourism resources图3 旅游资源利用合适度 |
The authors have declared that no competing interests exist.
| [1] |
[
|
| [2] |
[
|
| [3] |
[
|
| [4] |
[
|
| [5] |
[
|
| [6] |
[
|
| [7] |
[
|
| [8] |
[
|
| [9] |
[
|
| [10] |
[
|
| [11] |
[
|
| [12] |
[
|
| [13] |
[
|
| [14] |
[
|
| [15] |
[
|
| [16] |
[
|
| [17] |
[
|
| [18] |
[
|
| [19] |
[
|
| [20] |
[
|
| [21] |
[
|
| [22] |
|
| [23] |
|
| [24] |
[
|
| [25] |
[
|
| [26] |
[
|
| [27] |
[
|
| [28] |
[
|
| [29] |
[
|
| [30] |
[
|
| [31] |
[
|
/
| 〈 |
|
〉 |