
JOURNAL OF NATURAL RESOURCES >
Evolution characteristics and driving mechanism of urban-rural scale system at county level: A case of Zhangjiagang city, Jiangsu province
Received date: 2018-07-01
Request revised date: 2018-10-09
Online published: 2019-01-20
Copyright
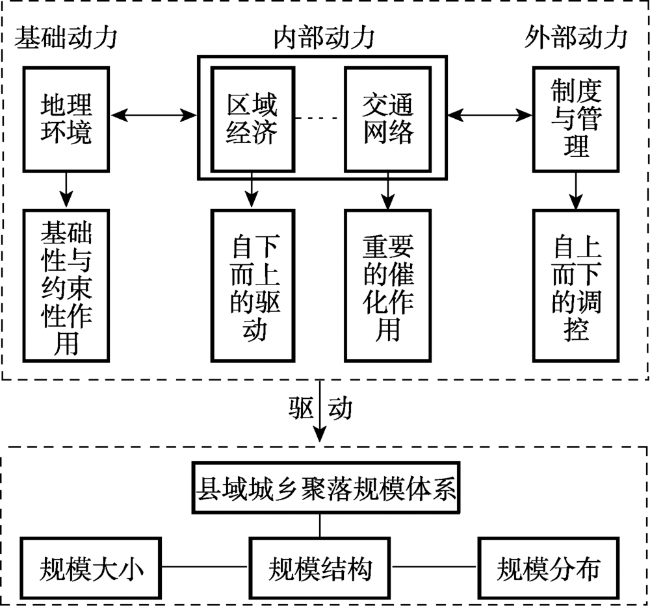
In the context of the new era, it is of great theoretical and practical significance to promote urban-rural integrated development and rural vitalization by means of studying the urban-rural scale system. The concept of urban-rural scale system had three essential characteristics of size, structure and distribution, therefore the three-dimensional analytical method had been established. This paper explored the evolution characteristics and driving mechanism of urban-rural scale system, based on both the land change survey data and remote sensing data in 1995, 2005 and 2015, using the well-developed Zhangjiagang city of Jiangsu province as a case. Several conclusions can be drawn as follows: (1) The number of urban-rural settlements was continually decreasing, but the scale of built-up areas showed the opposite trend during 1995-2015. (2) The type of city-town-village scale structure changed from "stele-pattern" to "pyramid-pattern", then to "olive-pattern" from 1995 to 2015. The number and built-up area of high grade settlements were increasing, and those of low grade settlements were decreasing. There was close correlation between the growth speed of settlements and their size-classes. Zipf's index of settlements size was generally high, with the decreasing growth rate of it, and the outcomes of model fitting conformed to the law of rank-size as a whole. (3) The spatial differentiation of urban-rural scale system had become increasingly obvious during the study period. However, the speed of polarization had decreased in the 10 years. There existed significant characteristics of spatial agglomeration of settlements, and distribution of cluster centers developed toward the direction of equalization. The spatial and temporal changes of urban-rural construction land were remarkably different in different regions, but the land-use change was mainly found in the urban areas. (4) This paper constructed a "four-wheel" driving mechanism of urban-rural scale system, including four driving factors. More specifically, geographic location was the fundamental factor limiting the development of urban-rural scale system; regional economy was the internal motivity impelling the settlements to evolve toward an advanced one; transport network was a kind of important catalyst in the process; institution and administration had become the indispensably external driving forces. These four factors, just like the four wheels of a car, interacted each other and together impelled the evolution of urban-rural scale system.
LI Zhi , ZHANG Xiao-lin , LI Hong-bo . Evolution characteristics and driving mechanism of urban-rural scale system at county level: A case of Zhangjiagang city, Jiangsu province[J]. JOURNAL OF NATURAL RESOURCES, 2019 , 34(1) : 140 -152 . DOI: 10.31497/zrzyxb.20190112
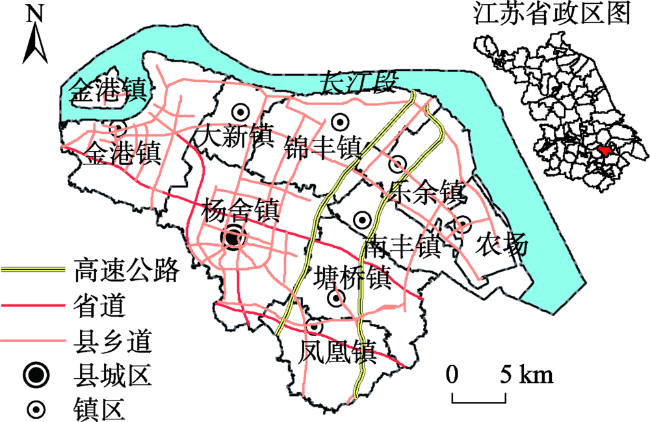
Fig. 1 The profile of Zhangjiagang, Jiangsu province图1 张家港市乡镇分布图 |
Table 1 Instruction of data used in the study表1 研究数据说明 |
| 数据名称 | 时间/年 | 研究用途 |
|---|---|---|
| Landsat TM/ETM+遥感影像 | 1995、2005、2015 | 获取城乡建设用地图斑 |
| 1∶1万土地利用变更调查数据库 | 2009-2015 | 数据校正 |
| Google Earth地图 | 1995、2005、2015 | 数据校正 |
| 张家港市行政区划矢量图 | 2015 | 辅助影像解译 |
| 张家港年鉴 | 1996-2016 | 获取社会经济数据和交通现状图 |
| 土地利用变更调查数据 | 1999-2015 | 获取城乡建设用地面积 |
| 中国人口普查分县资料 | 2000、2010 | 获取城乡人口数据 |
Table 2 The basic features of urban-rural scale system in Zhangjiagang表2 张家港市城乡聚落规模体系的基本特征 |
| 指标 | 1995年 | 2005年 | 2015年 | |
|---|---|---|---|---|
| 大小特征 | 聚落总个数/个 | 916 | 705 | 547 |
| 聚落总面积/km2 | 167.52 | 239.82 | 330.57 | |
| 聚落密度/(个/km2) | 1.16 | 0.89 | 0.69 | |
| 聚落平均面积/km2 | 0.18 | 0.34 | 0.60 | |
| 景观指数 | 最大斑块指数(LPI) | 13.63 | 22.01 | 26.10 |
| 平均斑块面积(MPS) | 11.79 | 20.08 | 33.12 | |
| 平均形状指数(MSI) | 1.23 | 1.25 | 1.24 |
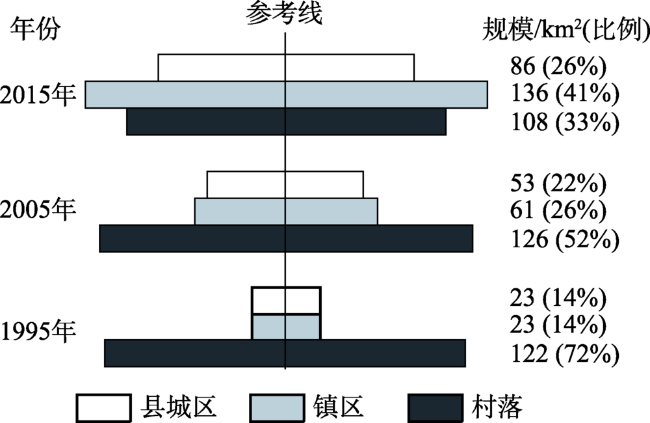
Fig. 2 Scale structure of city-town-village settlements图2 城—镇—村的规模结构 |
Table 3 Evolution characteristics of urban-rural scale structure表3 城乡聚落规模结构的演化特征 |
| 城乡聚落规模分级/ km2 | 1995年 | 2005年 | 2015年 | |||||
|---|---|---|---|---|---|---|---|---|
| 数目/个(占总比/%) | 规模(占总比/%) | 数目/个(占总比/%) | 规模(占总比/%) | 数目/个(占总比/%) | 规模(占总比/%) | |||
| Ⅰ(>25) | 0 (0) | 0 (0) | 2 (0.28) | 79.59 (33.19) | 3 (0.55) | 172.75 (52.26) | ||
| Ⅱ(15~25) | 1 (0.11) | 22.76 (13.59) | 0 (0) | 0 (0) | 1 (0.18) | 24.68 (7.47) | ||
| Ⅲ(5~15) | 1 (0.11) | 9.93 (5.93) | 3 (0.43) | 27.16 (11.33) | 7 (1.28) | 50.17 (15.18) | ||
| Ⅳ(1~5) | 17 (1.86) | 38.19 (22.80) | 22 (3.12) | 55.09 (22.97) | 11 (2.01) | 18.84 (5.70) | ||
| Ⅴ(0.5~1) | 17 (1.86) | 10.98 (6.55) | 11 (1.56) | 7.36 (3.07) | 12 (2.19) | 7.24 (2.19) | ||
| Ⅵ(0.25~0.5) | 62 (6.77) | 21.34 (12.74) | 58 (8.23) | 19.81 (8.26) | 49 (8.96) | 17.42 (5.27) | ||
| Ⅶ(0~0.25) | 818 (89.30) | 64.32 (38.40) | 609 (86.38) | 50.81 (21.19) | 464 (84.83) | 39.43 (11.93) | ||
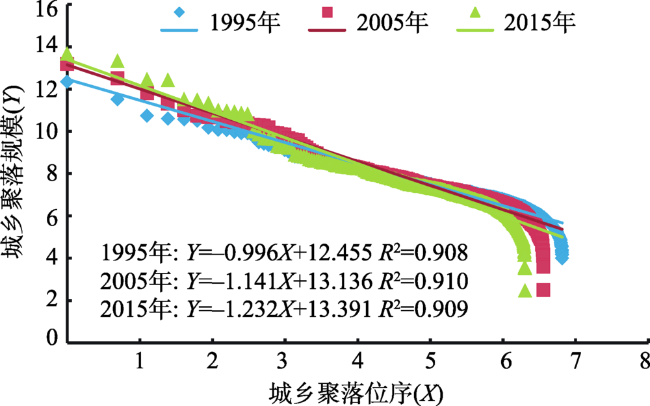
Fig. 3 Rank-size curves of urban-rural settlements图3 城乡聚落规模位序—规模图 |
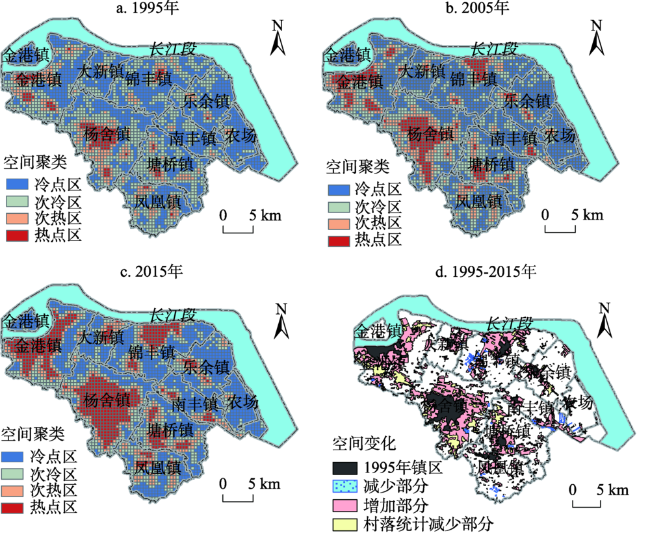
Fig. 4 The change of spatial cluster and land-use of urban-rural scale system图4 城乡聚落规模的空间聚类及空间变化 |
Fig. 5 Driving mechanism of urban-rural scale system at county level图5 县域城乡聚落规模体系的驱动机理 |
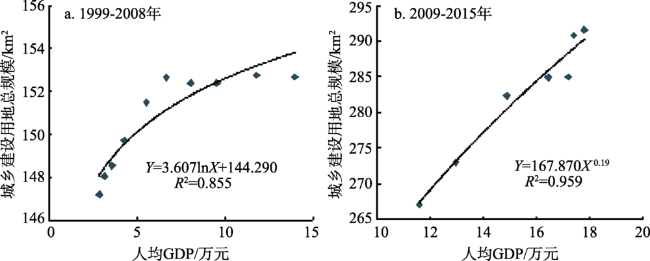
Fig. 6 Fitting diagram of per capita GDP and urban-rural construction land from 1999 to 2015 in Zhangjiagang图6 1999-2015年张家港市人均GDP与城乡建设用地总规模拟合图 |
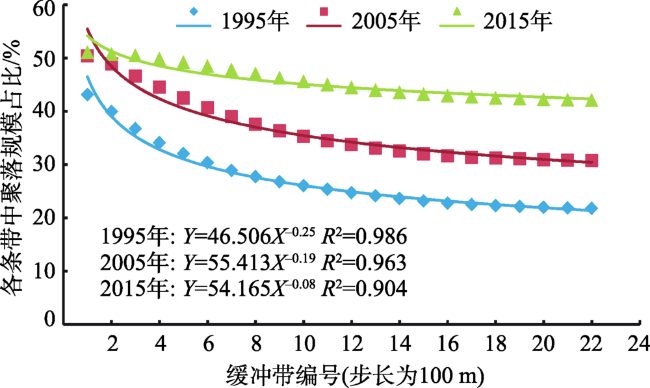
Fig. 7 The percentage of urban-rural settlement area in different buffer zones of traffic network图7 不同距离的城乡聚落规模占各条带土地总规模的比例 |
The authors have declared that no competing interests exist.
| [1] |
[
|
| [2] |
[
|
| [3] |
|
| [4] |
|
| [5] |
|
| [6] |
[
|
| [7] |
[
|
| [8] |
[
|
| [9] |
[
|
| [10] |
[
|
| [11] |
[
|
| [12] |
[
|
| [13] |
[
|
| [14] |
[
|
| [15] |
[
|
| [16] |
|
| [17] |
|
| [18] |
[
|
| [19] |
[
|
| [20] |
[
|
| [21] |
[
|
| [22] |
[
|
| [23] |
[
|
| [24] |
[
|
| [25] |
[
|
| [26] |
[
|
| [27] |
[
|
/
| 〈 |
|
〉 |