
JOURNAL OF NATURAL RESOURCES >
Layout optimization of regional urban development and agricultural production based on spatial decision-making: A case study of Linchuan district in Jiangxi province
Received date: 2018-10-31
Request revised date: 2019-01-19
Online published: 2019-03-28
Copyright
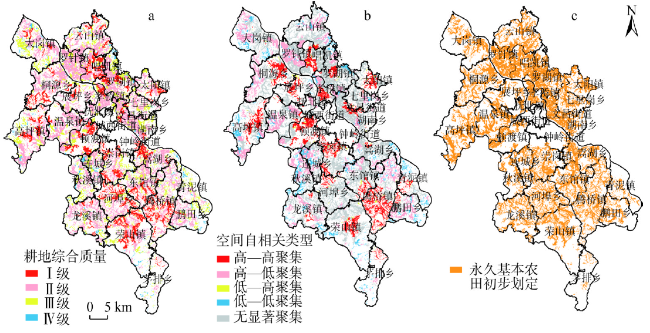
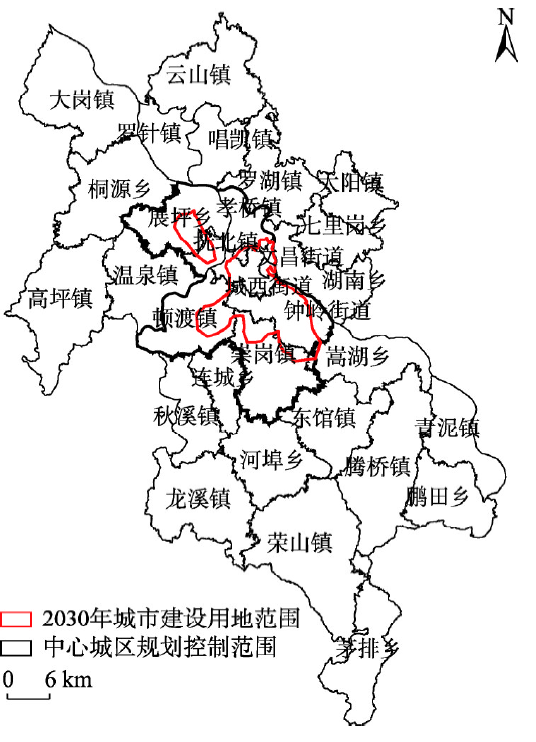
Scientific division of urban development space and agricultural production space is an important way to solve the problems of unregulated urban development and food security. Taking Linchuan district in Jiangxi province as an example, this paper uses ArcGIS, GeoDa software and others to establish a preliminary demarcation of the permanent basic farmland based on the comprehensive quality and autocorrelation of cultivated land in Linchuan district, and uses a multi-criterion CA model to simulate urban expansion. Through the comparison and adjustment of the results of the two aspects, combined with the direction of urban development, urban development model and the farmland natural utility grade, the demarcation of the boundary between the permanent basic farmland and the urban development will be carried out. The results showed that the demarcated area of permanent basic farmland was 593.46 km2. The preliminary delimitation results were mainly distributed in Shangdundu town, Chonggang town, Hejian town, Rongshan town, etc. The comprehensive quality of cultivated land was high, and most of it was high-high gathered area. According to the results of urban expansion simulations, the area of urban construction land in Linchuan district has increased significantly, and the area mainly increased in Zhanping township, Shangdundu town, and Zhongling street. The results of urban development direction analysis and urban expansion model analysis show that the urban construction land in Linchuan district mainly expands to the northwest, southeast, and southwest, and the expansion type is mainly a spreading one. According to the farmland natural utility grade, the initially demarcated permanent basic farmland is divided into an adjustable-in area and an adjustable-out area, so that the optimization and coordination of the permanent basic farmland area and the urban development boundary are carried out, and the final results are obtained between the permanent basic farmland area and the urban development boundary. It is predicted that the boundary area of urban development will reach 142.59 km2 by 2030, with a difference of 4.21 km2 out of a total of preliminary delineation of permanent basic farmland area. The research results can provide reference for the protection of cultivated land resources and avoid the disorderly expansion of cities, and can also provide reference for the future delineation work.
ZHAO Yue , LUO Zhi-jun , CAO Li-ping , ZHONG Shan , ZHAO Jie . Layout optimization of regional urban development and agricultural production based on spatial decision-making: A case study of Linchuan district in Jiangxi province[J]. JOURNAL OF NATURAL RESOURCES, 2019 , 34(3) : 526 -538 . DOI: 10.31497/zrzyxb.20190307
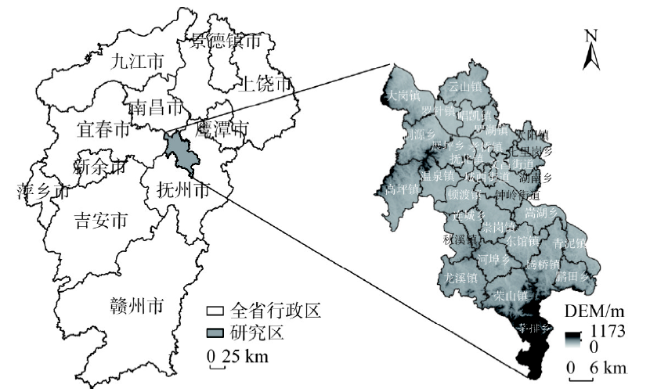
Fig. 1 Geographical location and scope of the study area图1 研究区地理位置和范围 |
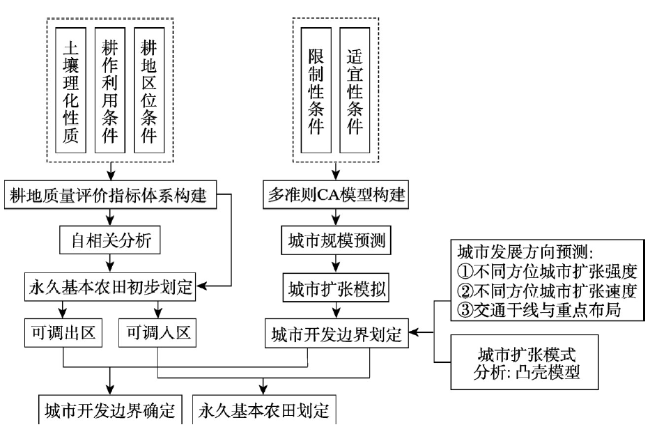
Fig. 2 Technical road map图2 技术路线图 |
Table 1 Evaluation index system of comprehensive quality of cultivated land表1 耕地综合质量评价指标体系 |
| 准则层 | 指标层 | 指标分级情况 | 权重 | ||||
|---|---|---|---|---|---|---|---|
| Ⅰ | Ⅱ | Ⅲ | Ⅳ | Ⅴ | |||
| 土壤理化 性质 | 有机质质量分数/% | [4, +∞) | [3, 4) | [2, 3) | [1, 2) | (-∞, 1) | 0.0754 |
| 耕层厚度/cm | [32, 40] | [24, 32) | [16, 24) | [8, 16) | [0, 8) | 0.0642 | |
| 土壤pH | [6.0, 7.9) | [5.5, 6.0), [7.9, 8.5) | [5.0, 5.5),[8.5, 9.0) | [4.5, 5.0) | (-∞, 4.5), [9.0, +∞) | 0.0812 | |
| 土壤质地 | 重壤土 | 中壤土 | 轻壤土 | 沙壤土 | 0.0541 | ||
| 剖面构型 | 1级 | 2级 | 3级 | 4级 | 5级 | 0.0691 | |
| 障碍层深度/cm | [70, 90] | [50, 70) | [30, 50) | [10, 30) | (-∞, 10) | 0.0632 | |
| 耕作利用 条件 | 排水条件 | 完善 | 基本完善 | 一般 | 不具备 | 0.0532 | |
| 灌溉条件 | 完善 | 基本完善 | 一般 | 不具备 | 0.0985 | ||
| 地形坡度/° | [0, 2) | [2, 6) | [6, 15) | [15, 25) | [25, 45) | 0.0661 | |
| 耕地连片度 | [965.6, +∞) | [581.9, 965.6) | [319.4, 581.9) | [138.4, 319.4) | [0, 138.4) | 0.0645 | |
| 土壤侵蚀程度 | 1级 | 2级 | 3级 | 4级 | 5级 | 0.0552 | |
| 耕地利用方式 | 水田 | 水浇地 | 旱地 | 0.0598 | |||
| 田块规整度 | (-∞, 1.02] | (1.02,1.06) | [1.06, 1.1) | [1.10, 1.50) | [1.50, +∞) | 0.0442 | |
| 耕地区位 条件 | 耕作距离/km | [0, 0.4) | [0.4, 1.0) | [1.0, 1.8) | [1.8, 2.8) | [2.8, +∞) | 0.0412 |
| 耕作便捷度/km | [0, 0.1) | [0.1, 0.3) | [0.3, 0.5) | [0.5, 0.7) | [0.7, +∞) | 0.0336 | |
| 交通通达度/km | [0, 0.1) | [0.1, 0.3) | [0.3, 0.6) | [0.6, 1.0) | [1.0, +∞) | 0.0442 | |
| 中心城镇影响度/km | [0, 0.1) | [0.1, 0.3) | [0.3, 0.5) | [0.5, 0.7) | [0.7, +∞) | 0.0323 | |
Fig. 3 Preliminary delineation of permanent basic farmland图3 永久基本农田初步划定成果图 |
Table 2 Cluster statistical table of comprehensive quality set of cultivated land表2 耕地综合质量集聚类型统计表 |
| 级别 | 高—高型 | 高—低型 | 低—高型 | 低—低型 | 无显著型 | 合计 | |||||||||
|---|---|---|---|---|---|---|---|---|---|---|---|---|---|---|---|
| 面积/km2 | 比例/% | 面积/km2 | 比例/% | 面积/km2 | 比例/% | 面积/km2 | 比例/% | 面积/km2 | 比例/% | ||||||
| Ⅰ级 | 62.84 | 8.93 | 12.69 | 1.80 | 0 | 0 | 0 | 0 | 80.24 | 11.40 | 155.77 | ||||
| Ⅱ级 | 64.34 | 9.14 | 124.27 | 17.66 | 0 | 0 | 0.02 | 0 | 192.03 | 27.29 | 380.66 | ||||
| Ⅲ级 | 7.67 | 1.09 | 23.13 | 3.29 | 7.53 | 1.07 | 45.50 | 6.47 | 64.30 | 9.14 | 148.13 | ||||
| Ⅳ级 | 0 | 0 | 0 | 0 | 0.22 | 0.03 | 14.63 | 2.08 | 4.19 | 0.60 | 19.04 | ||||
| 合计 | 134.86 | 19.17 | 160.08 | 22.75 | 7.75 | 1.10 | 60.15 | 8.55 | 340.76 | 48.43 | 703.59 | ||||
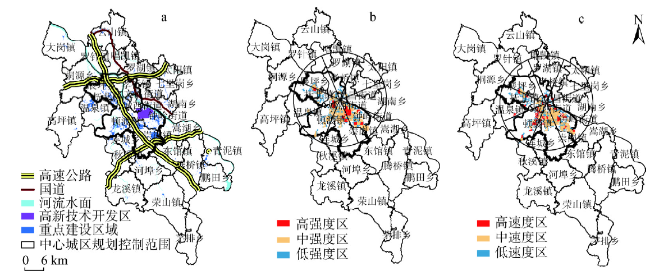
Fig. 4 Urban construction land scope in Linchuan district in 2030图4 2030年临川区城市建设用地范围 |
Fig. 5 Analysis of urban expansion direction图5 城市扩张方向分析 |
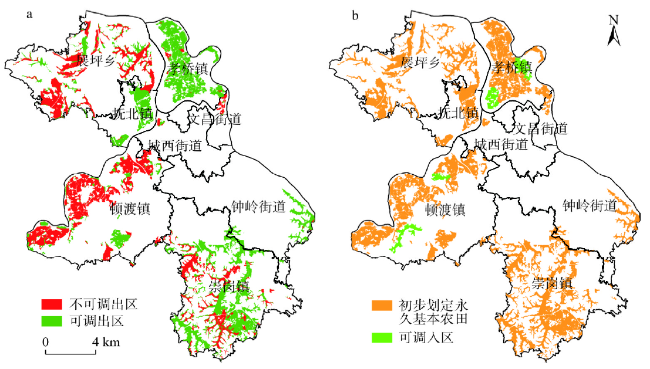
Fig. 6 Analysis of permanent basic farmland adjustment in central urban area图6 中心城区永久基本农田调整分析 |
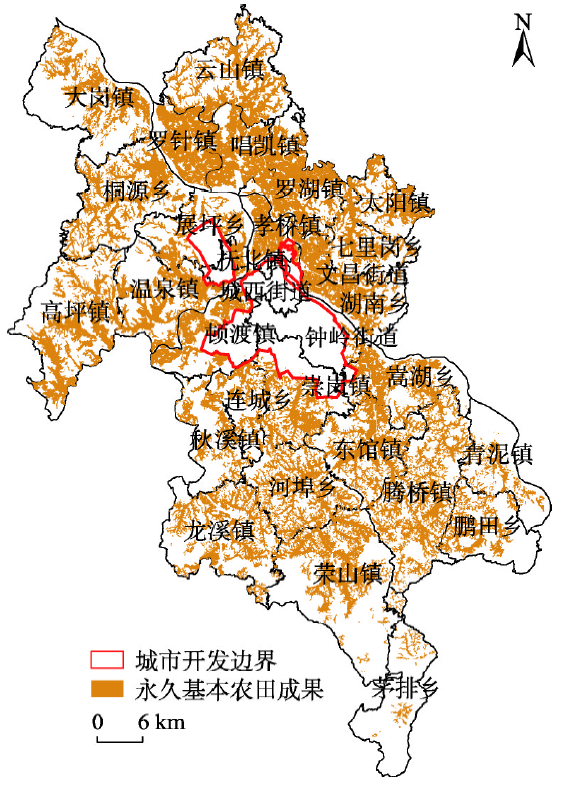
Fig. 7 Scheme for delineating the boundary between permanent basic farmland and urban development图7 永久基本农田与城市开发边界划定方案 |
Table 3 Comparison of permanent basic farmland in Linchuan district表3 临川区永久基本农田划定对比表 |
| 类别 | 传统划分方式 | 新划分方式 | |||||||
|---|---|---|---|---|---|---|---|---|---|
| 面积/km2 | 比例/% | 综合质量得分均值 | 图斑数/个 | 面积/km2 | 比例/% | 综合质量得分均值 | 图斑数/个 | ||
| 高—高聚集 | 100.31 | 16.90 | 67.87 | 1306 | 125.46 | 21.14 | 67.45 | 1578 | |
| 高—低聚集 | 137.13 | 23.11 | 66.56 | 706 | 144.61 | 24.37 | 66.64 | 334 | |
| 低—高聚集 | 5.28 | 0.89 | 62.36 | 296 | 0.20 | 0.03 | 62.74 | 8 | |
| 低—低聚集 | 48.71 | 8.21 | 60.23 | 1450 | 6.28 | 1.06 | 59.72 | 29 | |
| 无显著聚集 | 302.03 | 50.89 | 64.63 | 3536 | 316.92 | 53.40 | 65.21 | 2471 | |
| 合计 | 593.46 | 100.00 | 64.42 | 7294 | 593.46 | 100.00 | 66.07 | 4420 | |
The authors have declared that no competing interests exist.
| [1] |
[
|
| [2] |
[
|
| [3] |
[
|
| [4] |
[
|
| [5] |
|
| [6] |
[
|
| [7] |
[
|
| [8] |
[
|
| [9] |
[
|
| [10] |
|
| [11] |
[
|
| [12] |
[
|
| [13] |
[
|
| [14] |
[
|
| [15] |
[
|
| [16] |
[
|
| [17] |
[
|
| [18] |
[
|
| [19] |
[
|
| [20] |
[
|
| [21] |
[
|
| [22] |
[
|
| [23] |
[
|
| [24] |
[
|
| [25] |
[
|
| [26] |
[
|
| [27] |
[
|
| [28] |
[
|
| [29] |
[
|
| [30] |
[
|
| [31] |
[
|
/
| 〈 |
|
〉 |