
JOURNAL OF NATURAL RESOURCES >
Research on meteorological drought in the middle and lower reaches of the Yangtze River
Received date: 2018-07-02
Request revised date: 2018-11-20
Online published: 2019-02-28
Copyright
The middle and lower reaches of the Yangtze River serves as an important grain production base in China. In the context of global climate change, the drought events will directly affect the agriculture production and people's properties and lives in this region and also the national food security. In this study, the meteorological drought events have been extracted using run theory based on the standardized precipitation index (SPI), which is defined using the gridded dataset of monthly precipitation with a spatial resolution of 0.5°×0.5° in China from 1961 to 2015. The drought events are characterized by three variables including duration, severity and peak. Exponential and Gamma functions are then selected to describe the marginal distribution of drought duration and severity, respectively. The Clayton Copula is used to construct the joint distribution of drought duration and severity. Based on the above functions, conventional univariate frequency analysis and copula-based bivariate frequency analysis are used to characterize the spatial patterns of the drought events in the study area at various time scales over the past 55 years. While univariate analysis is focused on return levels of selected return periods (5-, 10-, 20-, and 30-year) for the SPI of 3-, 6-, and 12-month time scales, the bivariate analysis is focused on the joint occurrence probabilities P1 and P2 of drought duration and severity, where P1 is the probability of "drought duration and severity" exceeding their respective thresholds at the same time and P2 is the probability of "drought duration or severity" exceeding their respective thresholds at the same time. Here, the thresholds denote the duration and severity values corresponding to selected 5-, 10-, 20- and 30-year return periods. The results show that: (1) There are some differences between the spatial patterns of drought characteristics for the 3-month, 6-month, 12- month time scales in the middle and lower reaches of the Yangtze River, and the most serious droughts mainly occur in the lower reaches of the river. (2) Both drought duration and severity are positively correlated at various time scales, that is, the areas with higher drought severity are also associated with longer drought duration and vice versa. (3) Poyang Lake watershed and areas north of the lower Yangtze River are associated with larger values of the joint occurrence probability P1, that is, when the drought duration and severity exceed their corresponding 5, 10, 20 and 30-year return values at the same time, while smaller values of the joint occurrence probability P1 are noted for Southern Shaanxi, Southern Henan, a major portion of Hubei and central-north of Hunan, suggesting a low risk of droughts in these areas. The results of this study can provide theoretical basis for scientific managements of water resource and the risk assessments of drought disaster in the middle and lower reaches of the Yangtze River.
LI Ming , CHAI Xu-rong , WANG Gui-wen , HU Wei-xia , ZHANG Lian-zhi . Research on meteorological drought in the middle and lower reaches of the Yangtze River[J]. JOURNAL OF NATURAL RESOURCES, 2019 , 34(2) : 374 -384 . DOI: 10.31497/zrzyxb.20190213
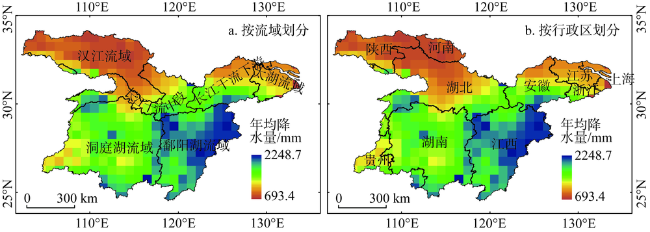
Fig. 1 Spatial distribution of annual precipitation in the middle and lower reaches of the Yangtze River from 1961 to 2015图1 1961-2015年长江中下游地区年均降水量空间分布 |
Table 1 Drought categories according to SPI value表1 依据SPI的干旱等级划分 |
| 干旱等级 | 无旱 | 轻旱 | 中旱 | 重旱 | 特旱 |
|---|---|---|---|---|---|
| SPI值 | (-0.5,+∞) | (-1.0,-0.5] | (-1.5,-1.0] | (-2.0,-1.5] | (-∞,-2.0] |
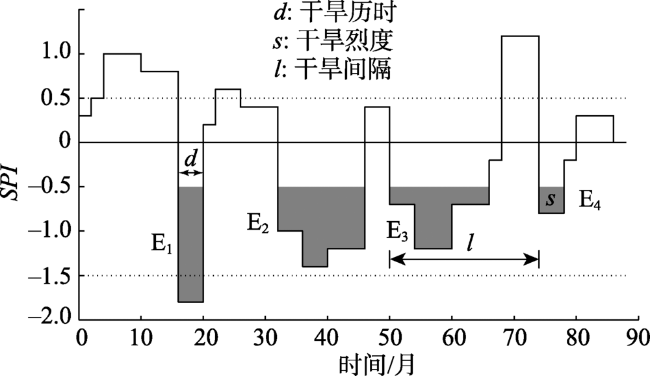
Fig. 2 Sketch showing definition of drought events图2 干旱事件的定义 |
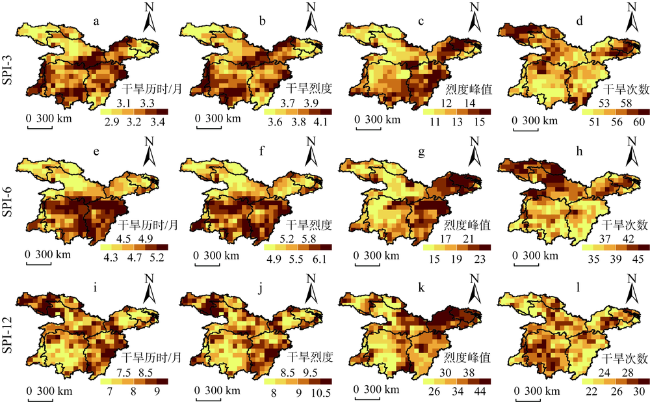
Fig. 3 Spatial pattern of average duration, average severity, maximum severity and number of drought events obtained on the basis of SPI-3, SPI-6 and SPI-12 values, respectively图3 平均干旱历时、平均干旱烈度、烈度峰值、干旱频次的空间格局 |
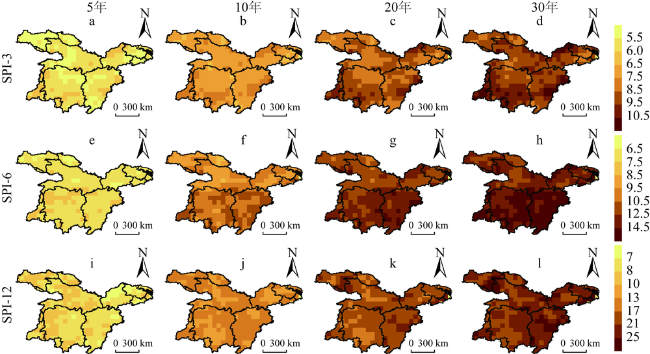
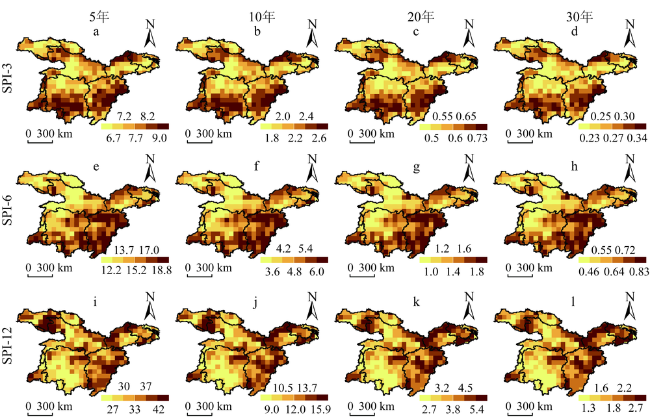
Fig. 4 Spatial patterns of 5 a, 10 a, 20 a, and 30 a return periods of drought severity derived on the basis of SPI-3, SPI-6 and SPI-12 values图4 基于SPI-3、SPI-6和SPI-12值获取的5年、10年、20年和30年重现期的干旱烈度空间格局 |
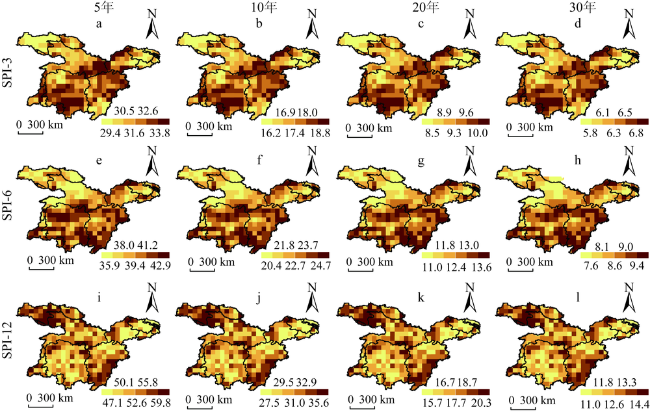
Fig. 5 Spatial patterns of 5 a, 10 a, 20 a, and 30 a return periods of drought duration derived on the basis of SPI-3, SPI-6 and SPI-12 values图5 基于SPI-3、SPI-6和SPI-12值获取的5年、10年、20年和30年重现期的干旱历时空间格局 |
Fig. 6 Spatial patterns of joint occurrence probability of drought duration and severity图6 干旱历时和干旱烈度的联合超越概率的空间格局 |
Fig. 7 Spatial patterns of joint occurrence probability of drought duration and severity图7 干旱历时和干旱烈度的联合超越概率的空间格局 |
The authors have declared that no competing interests exist.
| [1] |
[
|
| [2] |
|
| [3] |
[
|
| [4] |
[
|
| [5] |
[
|
| [6] |
[
|
| [7] |
[
|
| [8] |
|
| [9] |
[
|
| [10] |
|
| [11] |
|
| [12] |
[
|
| [13] |
|
| [14] |
|
| [15] |
[
|
| [16] |
|
| [17] |
|
| [18] |
[
|
| [19] |
[
|
| [20] |
[
|
| [21] |
|
| [22] |
[
|
| [23] |
|
| [24] |
|
| [25] |
[
|
| [26] |
[
|
| [27] |
|
| [28] |
[
|
| [29] |
[
|
| [30] |
|
/
| 〈 |
|
〉 |
