
JOURNAL OF NATURAL RESOURCES >
Spatial heterogeneity and sensitivity analysis of ecosystem services value in the Middle Yangtze River region
Received date: 2018-06-29
Request revised date: 2018-11-17
Online published: 2019-02-28
Copyright
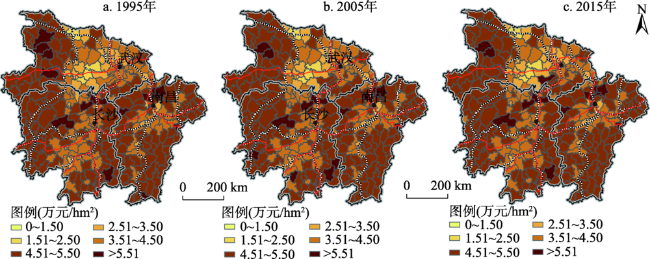
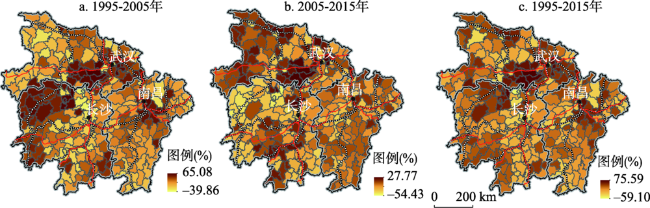
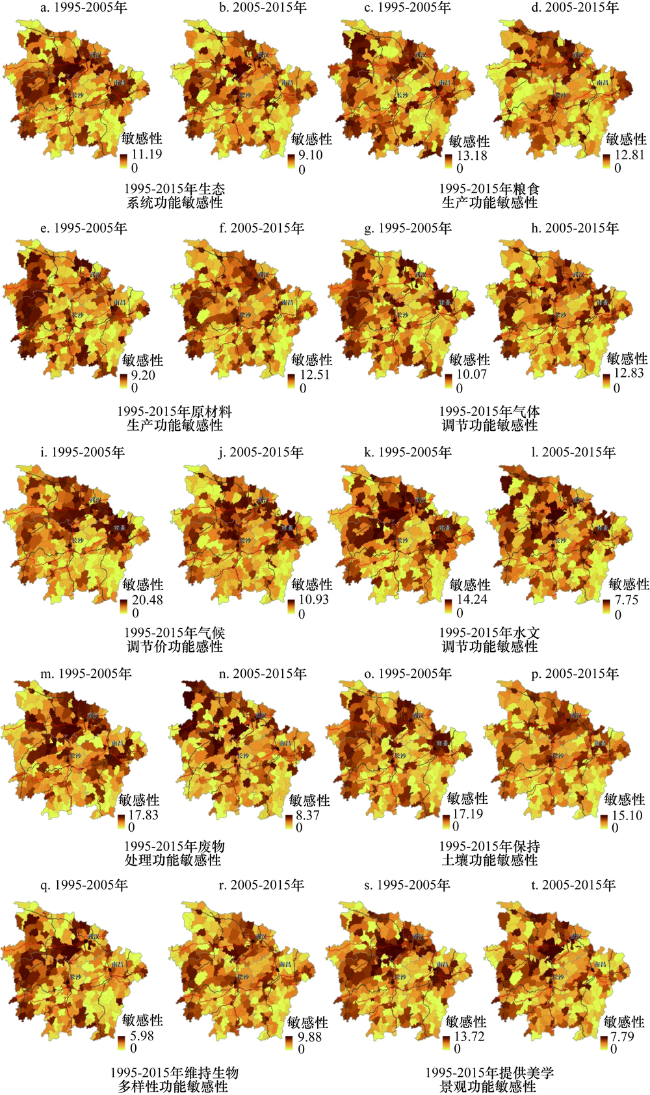
The continuous degradation of ecosystem services is a common challenge facing human-beings, and it is the focus of global sustainable development research. The ecological environmental protection in the Middle Yangtze River region is of great significance to the construction of ecological security pattern in China. In order to deeply analyze the interference degree of land use activities to ecosystem services value (ESV) in the Middle Yangtze River region, it is necessary to evaluate the spatial-temporal distribution of ESV and the sensitivity of ecosystem services to land use change in the study region. Based on the evaluation results of ESV in the Middle Yangtze River region, this paper constructed the ecological contribution model of land use change and ecosystem services sensitivity model. The results showed that: (1) The average ecosystem service value (AESV) in this region in the years of 1995, 2005 and 2015 was 46244.29 yuan/hm2, 46484.08 yuan/hm2, and 46249.254 yuan/hm2, respectively, and the study region experienced a "first increase and then decrease" change process. The counties with higher AESV were mainly located in the mountainous areas; plain areas, urban agglomeration areas, Wuhan, Changsha, and Nanchang, and major traffic routes tended to have lower AESV; the ESV change rate presented a spatial pattern of "two horizontal and three vertical" distribution. (2) The conversion of cultivated land to forest land and cultivated land to water areas during 1995-2015 were the key factors for the improvement of regional ESV, and their ecological contribution degrees were 33.34% and 32.99%, respectively; forest land converted to cultivated land, forest land converted to construction land and cultivated land converted to construction land were important causes that induced the deterioration of the regional ecological environmental quality, and their ecological contribution degrees were 36.21%, 20.26% and 11.98%, respectively. (3) The ecosystem services sensitivity areas were mainly distributed in areas with frequent human activities, 1% increase in the integrated land use dynamics would result in 0.18% and 0.15% fluctuation in ESV in the Middle Yangtze River region during the periods of 1995-2005 and 2005-2015, respectively; the ecological sensitivity of food production, raw material production, gas regulation, soil conservation and maintenance of biological diversity increased, and the sensitivity of other ecosystem function gradually weakened during the two study periods. The results of this study can provide scientific implications for the ecological environmental protection and the continuous supply of various sub-functions of the ecosystem services in the Middle Yangtze River region.
CHEN Wan-xu , LI Jiang-feng , ZHU Li-jun . Spatial heterogeneity and sensitivity analysis of ecosystem services value in the Middle Yangtze River region[J]. JOURNAL OF NATURAL RESOURCES, 2019 , 34(2) : 325 -337 . DOI: 10.31497/zrzyxb.20190209
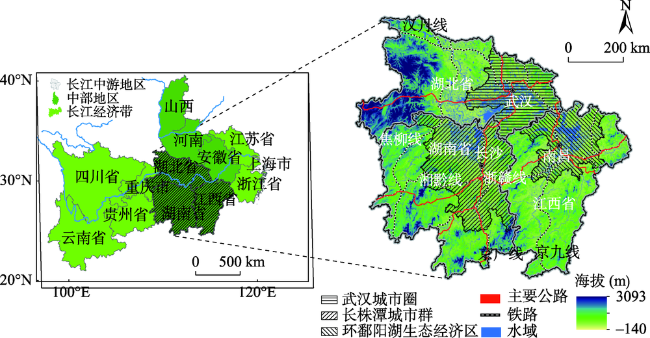
Fig. 1 The location of the Middle Yangtze River region图1 长江中游地区区位图 |
Table 1 Equivalent value per unit area of ecosystem services in China in 2007 元/(hm2·a) |
| 一级类型 | 二级类型 | 林地 | 草地 | 耕地 | 湿地 | 河流/湖泊 | 未利用地 |
|---|---|---|---|---|---|---|---|
| 供给服务 | 食物生产 | 0.33 | 0.43 | 1.00 | 0.36 | 0.53 | 0.02 |
| 原材料生产 | 2.98 | 0.36 | 0.39 | 0.24 | 0.35 | 0.04 | |
| 调节服务 | 气体调节 | 4.32 | 1.50 | 0.72 | 2.41 | 0.51 | 0.06 |
| 气候调节 | 4.07 | 1.56 | 0.97 | 13.55 | 2.06 | 0.13 | |
| 水文调节 | 4.09 | 1.52 | 0.77 | 13.44 | 18.77 | 0.07 | |
| 废物处理 | 1.72 | 1.32 | 1.39 | 14.40 | 14.85 | 0.26 | |
| 支持服务 | 保持土壤 | 4.02 | 2.24 | 1.47 | 1.99 | 0.41 | 0.17 |
| 维持生物多样性 | 4.51 | 1.87 | 1.02 | 3.69 | 3.43 | 0.40 | |
| 文化服务 | 提供美学景观 | 2.08 | 0.87 | 0.17 | 4.69 | 4.44 | 0.24 |
| 合计 | 28.12 | 11.67 | 7.90 | 54.77 | 45.35 | 1.39 |
Fig. 2 Spatial distribution of AESV in the Middle Yangtze River region in 1995-2015图2 1995-2015年长江中游地区地均生态系统服务价值空间分布 |
Fig. 3 Spatial distribution of the change rate of AESV in the Middle Yangtze River region in 1995-2015图3 1995-2015年长江中游地区地均生态系统服务价值变化率空间分布 |
Table 2 ESV and contribution rate of various land-use types in the Middle Yangtze River region in 1995-2015表2 1995-2015年长江中游地区各个地类生态系统服务价值及贡献率 |
| 地类 | 1995年ESV /亿元 | 1995年贡献率 /% | 2005年ESV /亿元 | 2005年贡献率 /% | 2015年ESV /亿元 | 2015年贡献率 /% |
|---|---|---|---|---|---|---|
| 1 | 2987.62 | 11.44 | 2964.14 | 11.29 | 2888.47 | 11.06 |
| 2 | 19947.25 | 76.39 | 20013.48 | 76.25 | 19808.60 | 75.85 |
| 3 | 549.57 | 2.10 | 507.47 | 1.93 | 516.09 | 1.98 |
| 4 | 1995.15 | 7.64 | 2197.42 | 8.37 | 2172.91 | 8.32 |
| 6 | 0.28 | 0.00 | 0.23 | 0.00 | 0.29 | 0.00 |
| 7 | 632.94 | 2.42 | 565.48 | 2.15 | 729.24 | 2.79 |
| 合计 | 26112.82 | 100 | 26248.23 | 100 | 26115.60 | 100 |
注:其中1~7分别代表耕地、林地、草地、河流湖泊、建设用地、荒漠和湿地7种地类,下同。 |
Table 3 Contribution rate of land use and land cover change to ESV in the Middle Yangtze River region in 1995-2015表3 1995-2015年长江中游地区土地利用变化对生态系统服务价值的贡献度 |
| 模式 | 1995-2005年 | 2005-2015年 | 1995-2015年 | ||||||||
|---|---|---|---|---|---|---|---|---|---|---|---|
| 土地利用转变类型 | ESV变化量/亿元 | 贡献度 /% | 土地利用转变类型 | ESV变化量/亿元 | 贡献度 /% | 土地利用转变类型 | ESV变化量/亿元 | 贡献度 /% | |||
| 生态系统功能改善 | 1→2 | 331.39 | 42.12 | 1→2 | 316.20 | 43.00 | 1→2 | 237.16 | 33.34 | ||
| 1→4 | 205.61 | 26.13 | 1→4 | 177.23 | 24.10 | 1→4 | 234.64 | 32.99 | |||
| 3→2 | 87.21 | 11.08 | 3→2 | 53.34 | 7.25 | 1→7 | 65.52 | 9.21 | |||
| 1→7 | 54.091 | 6.87 | 1→7 | 43.11 | 5.86 | 3→2 | 64.14 | 9.02 | |||
| 5→1 | 26.76 | 3.40 | 4→7 | 41.91 | 5.70 | 4→7 | 33.75 | 4.75 | |||
| 合计 | 705.06 | 89.60 | 合计 | 631.80 | 85.93 | 合计 | 635.22 | 89.30 | |||
| 生态系统功能恶化 | 2→1 | -331.93 | 50.95 | 2→1 | -336.22 | 38.74 | 2→1 | -256.57 | 36.21 | ||
| 4→1 | -103.47 | 15.88 | 2→5 | -131.79 | 15.18 | 2→5 | -143.53 | 20.26 | |||
| 7→4 | -34.90 | 5.36 | 4→1 | -122.74 | 14.14 | 1→5 | -84.88 | 11.98 | |||
| 2→3 | -31.98 | 4.91 | 1→5 | -85.30 | 9.83 | 4→1 | -79.94 | 11.28 | |||
| 2→5 | -31.27 | 4.80 | 2→3 | -76.36 | 8.80 | 2→3 | -32.61 | 4.60 | |||
| 合计 | -533.55 | 81.90 | 合计 | -752.41 | 86.69 | 合计 | -597.53 | 84.34 | |||
注:1→2代表耕地转为林地,其他代码以此类推。 |
Fig. 4 Spatial distribution of ESV sensitivity in the Middle Yangtze River region in 1995-2015图4 1995-2015年长江中游地区生态系统服务价值敏感性空间分布 |
The authors have declared that no competing interests exist.
| [1] |
|
| [2] |
|
| [3] |
|
| [4] |
|
| [5] |
[
|
| [6] |
|
| [7] |
|
| [8] |
|
| [9] |
[
|
| [10] |
|
| [11] |
|
| [12] |
|
| [13] |
[
|
| [14] |
|
| [15] |
[
|
| [16] |
|
| [17] |
|
| [18] |
[
|
| [19] |
[
|
| [20] |
|
| [21] |
|
| [22] |
[
|
| [23] |
[
|
| [24] |
|
| [25] |
|
| [26] |
普拉提·莫合塔尔, 海米提·依米提. 土地利用变化下的生态系统服务敏感性研究: 以克里雅绿洲为例. 自然资源学报, 2014, 29(11): 1849-1858.
[
|
| [27] |
|
| [28] |
|
| [29] |
|
| [30] |
|
| [31] |
|
| [32] |
|
| [33] |
|
| [34] |
|
| [35] |
[
|
| [36] |
|
/
| 〈 |
|
〉 |