
中国区域机会空间分异及其对人口迁移的影响
|
朱佩娟(1974- ),女,湖南岳阳人,博士,教授,研究方向为城市地理与城乡规划。E-mail: mrs-zhu@163.com |
收稿日期: 2024-05-13
修回日期: 2025-01-20
网络出版日期: 2025-06-20
基金资助
国家自然科学基金项目(42171202)
Spatial differentiation of regional opportunities in China and its impact on population migration
Received date: 2024-05-13
Revised date: 2025-01-20
Online published: 2025-06-20
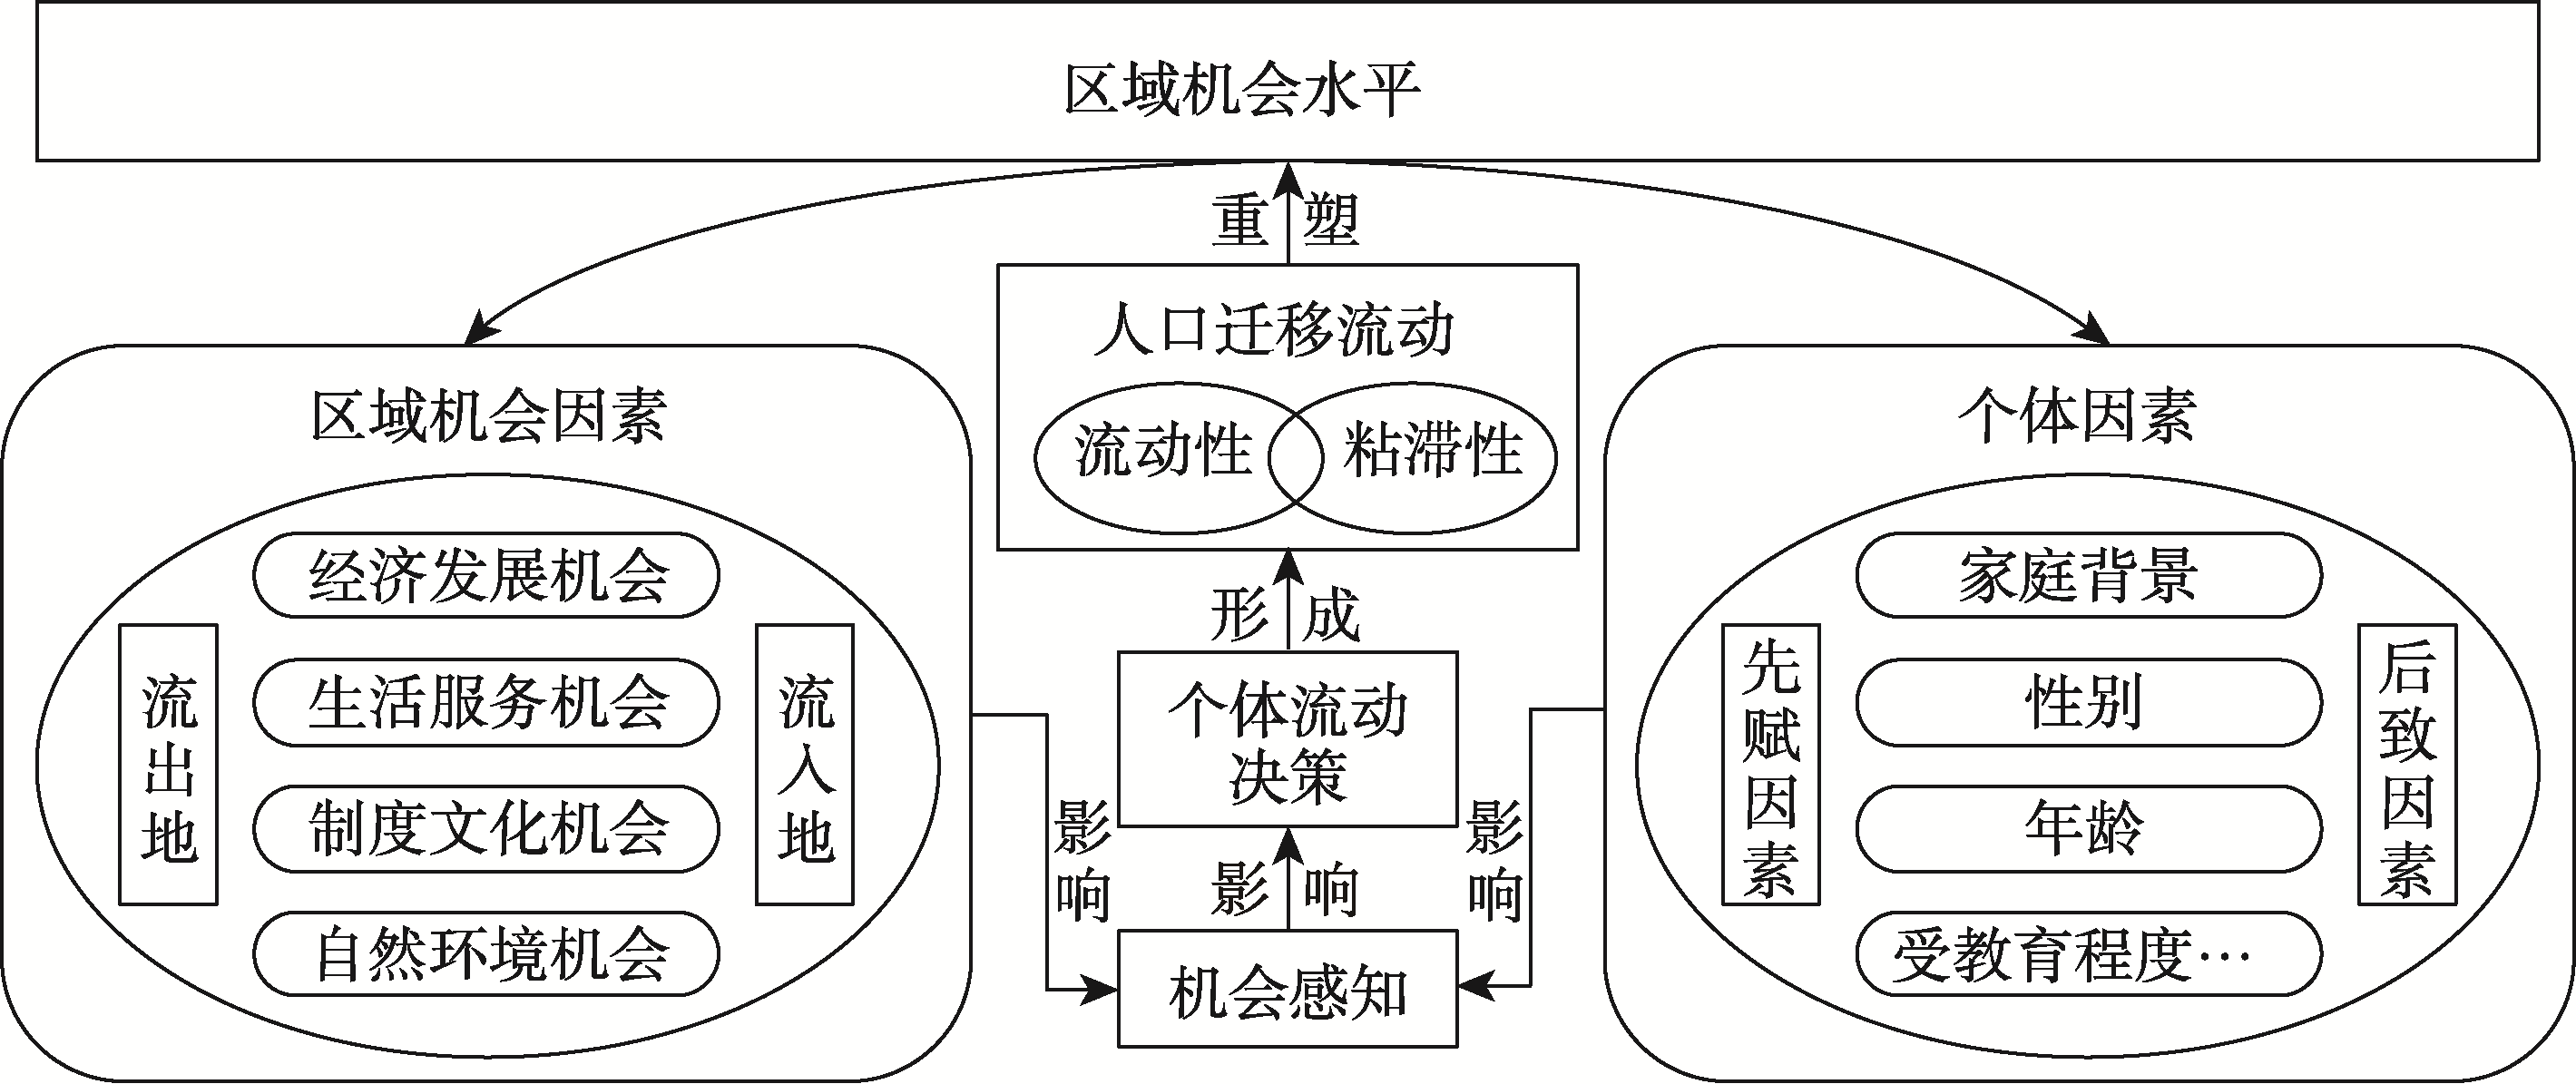
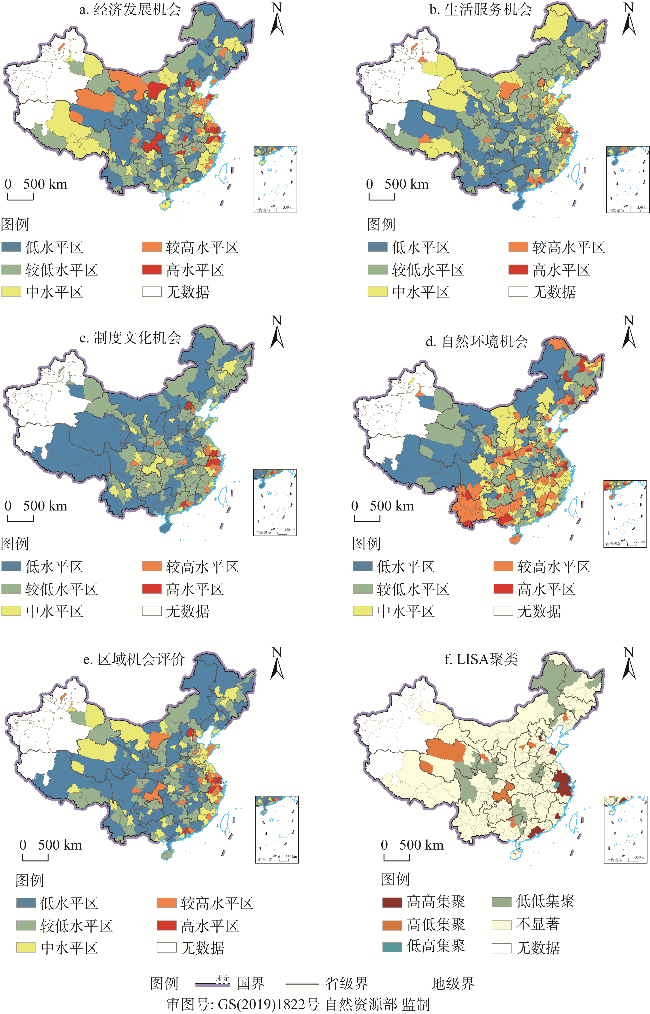
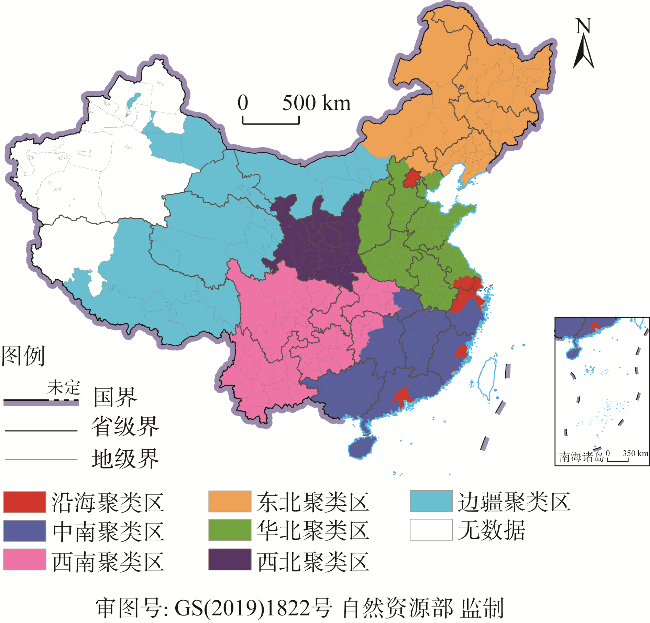
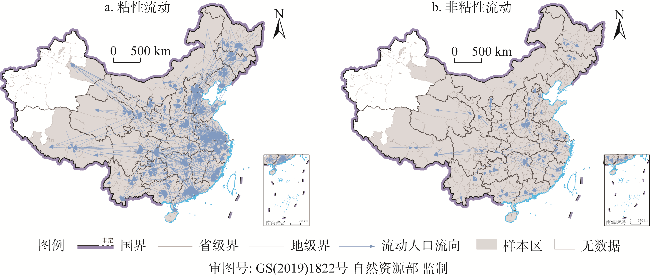
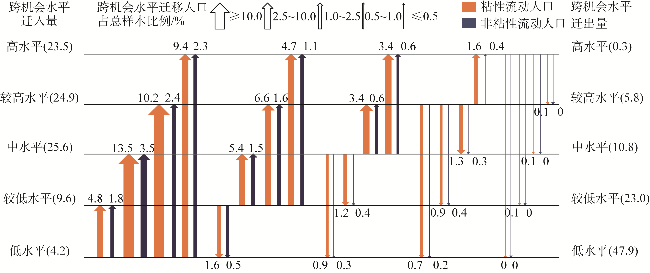
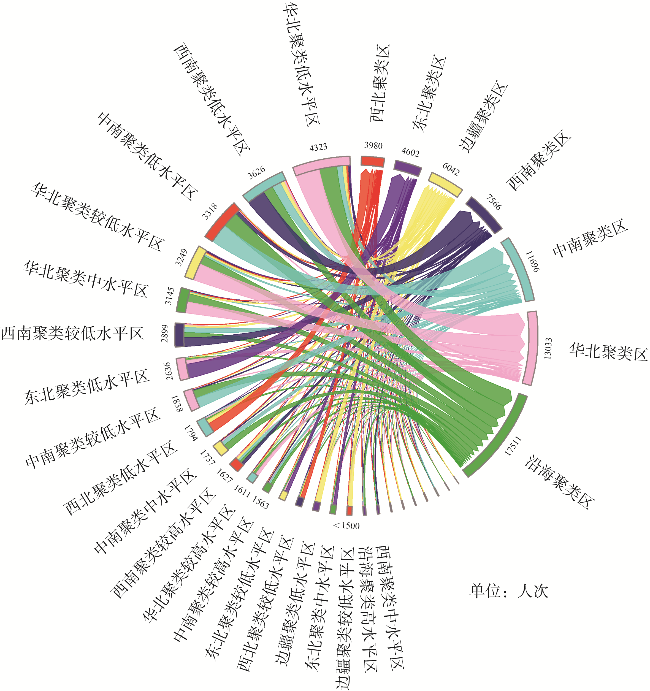
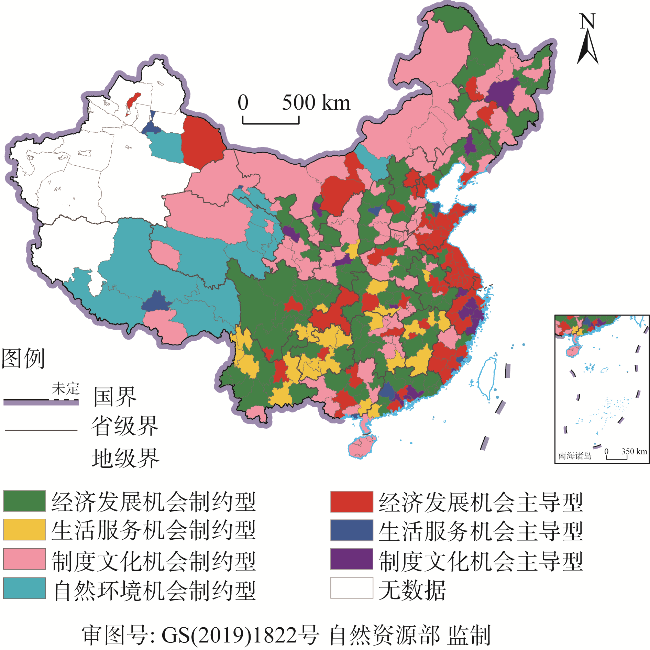
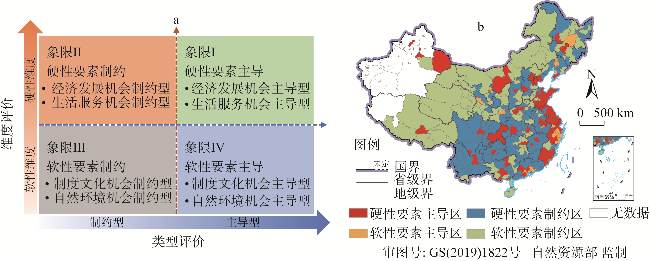
随着城镇化发展模式和社会主要矛盾的变化,中国人口迁移呈现新特征。探究影响人口迁移的区域机会因素,对于把握人口迁移的动力机制具有重要意义。基于区域机会结构理论框架构建评价体系,运用熵权法、决策试验和评价试验法、自组织映射神经网络技术,对中国地级市进行区域机会水平评价与分区;利用CMDS 2017数据,探讨区域机会水平对人口迁移流动性与粘滞性的影响。研究发现:(1)将地理学的“区域机会”视角与人口迁移研究相结合,基于经济发展机会、生活服务机会、制度文化机会、自然环境机会四个维度,可构建区域机会空间分异对人口迁移影响研究的“流动性—粘滞性”分析框架。(2)中国区域机会水平总体与地区经济发展水平相一致,可划分7种聚类分区。(3)人口迁移目的地以主要城市群和省会城市为主。从流动性来看,经济机会仍是影响人口迁移的重要方面。从粘滞性来看,流向和动机差异导致人口迁移受机会维度的影响存在分异。个体因素在人口迁移中对区域机会因素起调节作用。(4)可依据中国区域机会主导制约类型结合各机会维度对人口迁移相对作用程度,识别硬性要素主导区、硬性要素制约区、软性要素主导区和软性要素制约区四种区域机会模式,并提出针对性对策。研究形成的区域机会分析框架可广泛适用于其他地区或国家,为制定相应的区域人口调控与发展政策提供参考。
朱佩娟 , 邹志坚 , 林明杰 , 欧阳佩 . 中国区域机会空间分异及其对人口迁移的影响[J]. 自然资源学报, 2025 , 40(7) : 1795 -1815 . DOI: 10.31497/zrzyxb.20250705
As urbanization dynamics transform and dominant social challenges change, population migration in China has exhibited distinct new trends. Understanding the regional opportunity factors that shape migration is crucial for uncovering the driving forces behind these changes. This study builds on the theoretical framework of regional opportunity structures, developing an evaluation system that uses the entropy weight method, the Decision-Making Trial and Evaluation Laboratory method, and self-organizing map neural network techniques to assess and categorize the regional opportunity levels of China's prefecture-level cities. Using data from CMDS 2017, the research explores how regional opportunity levels affect both the mobility-stickiness of population migration. The main findings are as follows: (1) By introducing the geographical concept of "regional opportunities" into population migration research, this study creates a "mobility-stickiness" analytical framework. This framework investigates how spatial differences in regional opportunities shape migration behavior, focusing on four key dimensions: economic development opportunities, life service opportunities, institutional and cultural opportunities, and natural environment opportunities. (2) The overall regional opportunity levels in China are generally aligned with the levels of regional economic development and can be categorized into seven distinct clusters. (3) Major urban agglomerations and provincial capital cities are the primary destinations for population migration. Economic opportunities remain a key driver of migration from a mobility perspective, while differences in migration destinations and motivations shape the diverse impacts of various opportunity dimensions from a retention perspective. Individual characteristics also play a significant role in moderating how regional opportunities impact migration decisions. (4) Based on the influence of the dominant and limiting factors of regional opportunities on population migration, the study identifies four types of regional opportunity models: hard-factor dominant zones, hard-factor constrained zones, soft-factor dominant zones, and soft-factor constrained zones. Targeted strategies are suggested to address the unique challenges and strengths of each type. The framework for analyzing regional opportunities proposed in this study offers broad applicability beyond China, providing valuable insights for designing population management and regional development policies in other contexts.
表1 变量定义与权重设置Table 1 Variable definitions and descriptive statistics |
| 变量 | 维度 | 指标 | 指标解释 | 权重 | 正负性 | |
|---|---|---|---|---|---|---|
| 被解释变量 | 人口迁移 | 流动性 | 流入地选择 | — | — | |
| 粘滞性 | 有居留意愿=1,其他=0 | — | — | |||
| 核心解释变量 | 区域机会因素 | 经济发展机会 | 发展水平 | 人均GDP/万元 | 0.166 | 正向 |
| 工资水平 | 城镇单位在岗职工平均工资/万元 | 0.068 | 正向 | |||
| 房价水平 | 房价/人均可支配收入/% | 0.013 | 负向 | |||
| 就业环境 | 城镇登记失业率/% | 0.017 | 负向 | |||
| 发展潜力 | 固定资产投资额/亿元 | 0.150 | 正向 | |||
| 生活服务机会 | 教育水平 | 每千人中小学老师数/个 | 0.018 | 正向 | ||
| 医疗水平 | 每千人执业医师数/个 | 0.051 | 正向 | |||
| 交通水平 | 人均城市道路面积/m2 | 0.029 | 正向 | |||
| 通信水平 | 宽带接入比/% | 0.063 | 正向 | |||
| 制度文化机会 | 落户门槛 | 普通就业落户门槛指数 | 0.008 | 负向 | ||
| 创新氛围 | 每千人专利授权量/个 | 0.359 | 正向 | |||
| 文化邻近 | 语言距离 | 0.013 | 负向 | |||
| 地理距离 | 公路距离/km | 0.004 | 负向 | |||
| 自然环境机会 | 绿化环境 | 人均绿地面积/m2 | 0.032 | 正向 | ||
| 空气质量 | 年均PM2.5浓度/(μg/m3) | 0.003 | 负向 | |||
| 气候环境 | 一月平均气温/℃ | 0.006 | 正向 | |||
| 个体调节变量 | 个体因素 | 性别 | 1=女性;2=男性 | — | — | |
| 年龄 | 1=青年期;2=成熟期;3=稳健期;4=调整期;5=老龄期 | — | — | |||
| 学历水平 | 1=未上过学;2=小学;3=初中;4=高中/中专;5=本科/专科;6=研究生 | — | — | |||
| 户口类型 | 1=农业户口;2=非农业户口 | — | — | |||
表2 区域机会对人口迁移流动性的影响Table 2 The impact of regional opportunities on the mobility of population migration |
| 变量类型 | 变量名称 | 系数 | 稳健标准误 |
|---|---|---|---|
| 经济发展机会 | 发展水平 | -0.022*** | 0.002 |
| 工资水平 | 0.022*** | 0.000 | |
| 房价水平 | 0.193*** | 0.027 | |
| 就业环境 | -0.074*** | 0.008 | |
| 发展潜力 | 0.000*** | 0.000 | |
| 生活服务机会 | 教育水平 | -0.018*** | 0.001 |
| 医疗水平 | 0.657*** | 0.007 | |
| 交通水平 | -0.015*** | 0.001 | |
| 通信水平 | 0.003 | 0.012 | |
| 制度文化机会 | 落户门槛 | 0.906*** | 0.054 |
| 创新氛围 | -0.001*** | 0.000 | |
| 文化邻近 | -0.166*** | 0.006 | |
| 地理距离 | -0.002*** | 0.000 | |
| 自然环境机会 | 绿化环境 | 0.024*** | 0.001 |
| 空气质量 | -0.025*** | 0.001 | |
| 气候环境 | -0.01*** | 0.002 |
注:***表示在0.01水平下显著,下同。N=64430;Wald chi2(16)=31769.95;Prob>chi2=0;Log likelihood= -275511。 |
表3 区域机会对人口迁移粘滞性的影响Table 3 The impact of regional opportunities on the stickiness of population migration |
| 变量 名称 | 粘性流动人口(N=50907) | 非粘性流动人口(N=13523) | ||||||||
|---|---|---|---|---|---|---|---|---|---|---|
| 模型2 | 模型3 | 模型4 | 模型5 | 模型6 | 模型7 | 模型8 | 模型9 | |||
| 发展 水平 | 0.020*** (0.001) | 0.001 (0.000) | -0.012*** (0.003) | -0.013*** (0.003) | 0.008*** (0.001) | -0.003*** (0.001) | -0.037*** (0.006) | -0.025*** (0.005) | ||
| 工资 水平 | 0.005*** (0.000) | 0.003*** (0.000) | 0.021*** (0.000) | 0.016*** (0.001) | 0.002*** (0.000) | 0.002*** (0.000) | 0.02*** (0.001) | 0.019*** (0.001) | ||
| 房价 水平 | 0.524*** (0.009) | 0.301*** (0.008) | 0.339** (0.031) | 0.238*** (0.029) | 0.284*** (0.02) | 0.189*** (0.011) | 0.183*** (0.08) | 0.154** (0.07) | ||
| 就业 环境 | -0.034*** (0.002) | -0.039*** (0.001) | -0.011 (0.001) | -0.104*** (0.008) | -0.029*** (0.003) | -0.037*** (0.003) | -0.199*** (0.002) | -0.181*** (0.019) | ||
| 发展 潜力 | 0.001*** (0.000) | 0.001 (0.001) | 0.001*** (0.000) | 0.018*** (0.001) | 0.001*** (0.000) | 0.001*** (0.000) | 0.001*** (0.000) | 0.001*** (0.000) | ||
| 教育 水平 | -0.001*** (0.000) | -0.011*** (0.001) | -0.001*** (0.001) | 0.001 (0.000) | -0.006*** (0.001) | -0.022*** (0.001) | ||||
| 医疗 水平 | 0.095*** (0.003) | 0.605*** (0.007) | 0.648*** (0.008) | 0.067*** (0.005) | 0.713*** (0.018) | 0.691*** (0.018) | ||||
| 交通 水平 | 0.001*** (0.000) | 0.008*** (0.001) | -0.007*** (0.001) | 0.001* (0.000) | -0.003* (0.002) | -0.033*** (0.002) | ||||
| 通信 水平 | -0.084*** (0.004) | 0.119*** (0.013) | 0.014 (0.014) | -0.037*** (0.005) | 0.112*** (0.028) | -0.035 (0.0291) | ||||
| 落户 门槛 | 0.831*** (0.065) | 0.966*** (0.059) | -0.201 (0.149) | 0.446*** (0.13) | ||||||
| 创新 氛围 | -0.001*** (0.000) | -0.001*** (0.001) | -0.001*** (0.000) | -0.001*** (0.000) | ||||||
| 文化 邻近 | -0.185*** (0.007) | -0.175*** (0.007) | -0.141*** (0.015) | -0.148*** (0.014) | ||||||
| 地理 距离 | -0.002*** (0.000) | -0.002*** (0.000) | -0.002*** (0.000) | -0.002*** (0.001) | ||||||
| 绿化 环境 | 0.014*** (0.001) | 0.045*** (0.001) | ||||||||
| 空气 质量 | -0.025*** (0.001) | -0.025*** (0.001) | ||||||||
| 气候 环境 | -0.008*** (0.002) | -0.021*** (0.004) | ||||||||
| Wald chi2 | 3405.95 | 4024.01 | 25362.63 | 25865.78 | 221.12 | 471.80 | 6468.28 | 6624.92 | ||
| Prob>chi2 | 0.0000 | 0.0000 | 0.0000 | 0.0000 | 0.0000 | 0.0000 | 0.0000 | 0.0000 | ||
| Log likelihood | -258815 | -251212 | -215629 | -214258 | -70797 | -69024 | -61595 | -60522 | ||
注:**、*分别表示在0.05、0.1水平下显著,下同。 |
表4 人口迁移过程中个体因素对区域机会因素的调节作用Table 4 The moderating effect of individual opportunities on regional opportunities in the population migration |
| 粘滞性分类 | 调节作用 | 性别 | 年龄 | 学历水平 | 户口类型 |
|---|---|---|---|---|---|
| 粘性流动人口 (N=50907) | 房价水平×个体特征 | 0.007 (0.005) | 0.005 (0.003) | 0.023*** (0.003) | -0.003 (0.006) |
| 医疗水平×个体特征 | -0.003*** (0.001) | -0.003*** (0.001) | 0.005*** (0.001) | 0.004*** (0.001) | |
| 落户门槛×个体特征 | -0.015*** (0.006) | -0.017*** (0.003) | 0.065*** (0.004) | 0.092*** (0.008) | |
| 空气质量×个体特征 | -0.000*** (0.001) | -0.000* (0.001) | 0.001*** (0.000) | 0.001*** (0.001) | |
| 非粘性流动人口(N=13053) | 房价水平×个体特征 | 0.018** (0.007) | 0.003 (0.004) | -0.005 (0.004) | -0.006 (0.009) |
| 医疗水平×个体特征 | -0.002*** (0.001) | -0.002*** (0.001) | 0.003*** (0.000) | -0.001 (0.001) | |
| 落户门槛×个体特征 | -0.021*** (0.008) | -0.011** (0.004) | 0.037*** (0.005) | 0.022** (0.01) | |
| 空气质量×个体特征 | -0.000 (0.000) | 0.000 (0.000) | 0.001*** (0.000) | 0.001*** (0.001) |
| [1] |
席广亮, 甄峰, 钱欣彤. 流动性视角下的国土空间安全及规划应对策略. 自然资源学报, 2022, 37(8): 1935-1945.
[
|
| [2] |
段成荣, 谢东虹, 吕利丹. 中国人口的迁移转变. 人口研究, 2019, 43(2): 12-20.
[
|
| [3] |
国家统计局. 第七次全国人口普查公报(第七号), 2021.
[National Bureau of Statistics. The Seventh Population Census Bulletin (No.7), 2021.]
|
| [4] |
|
| [5] |
|
| [6] |
|
| [7] |
|
| [8] |
|
| [9] |
吕晨, 蓝修婷, 孙威. 地理探测器方法下北京市人口空间格局变化与自然因素的关系研究. 自然资源学报, 2017, 32(8): 1385-1397.
[
|
| [10] |
刘涛, 卓云霞, 王洁晶. 邻近性对人口再流动目的地选择的影响. 地理学报, 2020, 75(12): 2716-2729.
[
|
| [11] |
卓云霞, 刘涛, 古维迎. 多维邻近性与城—城流动人口的流入地选择: 基于嵌套Logit模型的实证分析. 地理科学, 2021, 41(7): 1210-1218.
[
|
| [12] |
|
| [13] |
|
| [14] |
|
| [15] |
|
| [16] |
|
| [17] |
穆学英, 崔璨, 崔军茹. 空间机会结构视角下的住房分化: 基于中国新生代流动人口的实证研究. 社会学研究, 2022, 37(2): 202-225, 230.
[
|
| [18] |
张艳茹, 喻忠磊, 胡志强, 等. 城市舒适物、经济机会、城市规模对中国高学历劳动力空间分布的影响. 热带地理, 2021, 41(2): 243-255.
[
|
| [19] |
刘建伟. 成渝城市群旅游机会图谱构建研究. 重庆: 重庆理工大学, 2022.
[
|
| [20] |
曹哲静. 公共交通对实现城市空间机会均衡的效用之辨. 城市规划学刊, 2019, (3): 33-41.
[
|
| [21] |
全恒, 毕凌岚. 机会公平视角下的公共空间使用效率研究: 以成都市金牛区为例. 中国城市规划学会, 成都市人民政府. 面向高质量发展的空间治理: 2021中国城市规划年会论文集: 07城市设计.
[
|
| [22] |
魏淑媛, 王春光. 城市非正式就业者的生存韧性与机会空间建构. 城市发展研究, 2020, 27(10): 41-46.
[
|
| [23] |
李丽梅, 陈赟. 中国超大城市流动人口的市民权获得研究: 一个流动性和非流动性的解释框架. 人文地理, 2024, 39(1): 101-112.
[
|
| [24] |
|
| [25] |
|
| [26] |
|
| [27] |
乔纳森·特纳. 社会学理论的结构. 邱泽奇, 张茂元译. 北京: 华夏出版社, 2001.
[
|
| [28] |
伏润得, 杨振山. 中国城市区域高质量发展时空分异及影响因素. 地理学报, 2024, 79(4): 819-836.
[
|
| [29] |
孙久文, 蒋治, 胡俊彦. 新时代中国城市高质量发展的时空演进格局与驱动因素. 地理研究, 2022, 41(7): 1864-1882.
[
|
| [30] |
贺小荣, 石彩霞, 周国华. 长江经济带城市规模与城市宜居性的时空演化及适配关系. 地理研究, 2024, 43(7): 1769-1789.
[
|
| [31] |
郭瑞斌, 薛东前, 暴向平, 等. 西安市主城区客观生活质量空间格局研究. 人文地理, 2015, 30(5): 43-48.
[
|
| [32] |
王毅, 苗转莹, 陆玉麒, 等. 经济发展对城市宜居性的影响: 基于中国40个大中城市的实证分析. 地理学报, 2022, 77(10): 2529-2546.
[
|
| [33] |
李雨婷, 喻忠磊, 苗长虹, 等. 多维邻近性对流动人口回流意愿的影响: 基于中国流动人口动态监测数据的实证. 地理科学进展, 2022, 41(8): 1403-1415.
[
|
| [34] |
马凌, 李丽梅, 朱竑. 中国城市舒适物评价指标体系构建与实证. 地理学报, 2018, 73(4): 755-770.
[
|
| [35] |
马睿, 张敏. 居民绿色空间接触对心理健康影响的动态地理情境: 研究进展与分析框架. 地理研究, 2024, 43(6): 1522-1538.
[
|
| [36] |
|
| [37] |
张吉鹏, 卢冲. 户籍制度改革与城市落户门槛的量化分析. 经济学(季刊), 2019, 19(4): 1509-1530.
[
|
| [38] |
刘毓芸, 徐现祥, 肖泽凯. 劳动力跨方言流动的倒U型模式. 经济研究, 2015, 50(10): 134-146, 162.
[
|
| [39] |
|
| [40] |
|
| [41] |
周扬, 郭远智, 刘彦随. 中国乡村地域类型及分区发展途径. 地理研究, 2019, 38(3): 467-481.
[
|
| [42] |
郎昱, 严婧滔, 孙荃, 等. 住房成本、人口流动与产业集群. 统计与决策, 2022, 38(22): 153-157.
[
|
| [43] |
林赛南, 冯馨, 王雨. 流动人口再流动的空间选择特征及影响因素. 地理科学, 2023, 43(9): 1537-1547.
[
|
| [44] |
李辉, 王良健. 房价、房价收入比与流动人口长期居留意愿: 来自流动人口的微观证据. 经济地理, 2019, 39(6): 86-96.
[
|
| [45] |
王焱, 王艺桥, 霍京京. 医疗保障对于流动人口居留意愿的影响: 医疗服务利用和健康水平的链式中介效应. 中国卫生政策研究, 2023, 16(5): 41-46.
[
|
| [46] |
曹广忠, 陈思创, 刘涛. 中国五大城市群人口流入的空间模式及变动趋势. 地理学报, 2021, 76(6): 1334-1349.
[
|
| [47] |
殷江滨, 张倩倩, 武文杰, 等. 多维距离对流动人口回流意愿的影响及群体异质性. 地理学报, 2022, 77(12): 3146-3161.
[
|
| [48] |
穆学英, 崔璨, 崔军茹, 等. 中国流动人口的跨等级流动及其对流入城市住房选择的影响. 地理学报, 2022, 77(2): 395-410.
[
|
| [49] |
李仲达, 林建浩, 邓虹. 跨越省际移民中的文化壁垒: 信息沟通与身份认同. 经济学(季刊), 2021, 21(5): 1691-1710.
[
|
| [50] |
刘嘉杰, 刘涛, 曹广忠. 舒适性迁移研究进展与启示. 地理科学进展, 2023, 42(6): 1216-1228.
[
|
| [51] |
|
| [52] |
祁琪, 马瑞光, 殷江滨, 等. 地方环境对流动人口回流意愿的非线性影响: 基于流入地与户籍地的比较分析. 地理科学, 2024, 44(2): 228-237.
[
|
| [53] |
曹广忠, 刘嘉杰, 刘涛. 空气质量对中国人口迁移的影响. 地理研究, 2021, 40(1): 199-212.
[
|
| [54] |
林李月, 朱宇. 流动人口城市间流动的时空结构特征及其性别差异: 基于福建省的实证研究. 地理科学, 2015, 35(6): 725-732.
[
|
| [55] |
朱峰. 就业极化、职业分割与流动人口性别工资差距. 统计与决策, 2023, 39(15): 85-88.
[
|
| [56] |
窦旺胜, 秦波, 郝美竹, 等. 中国青年流动人口城市选择的空间特征及影响因素. 地理研究, 2023, 42(5): 1234-1247.
[
|
| [57] |
高非凡, 程晗蓓, 李志刚. 超大城市老旧社区邻里环境对流动人口心理健康的影响: 以武汉市为例. 自然资源学报, 2025, 40(1): 267-282.
[
|
/
| 〈 |
|
〉 |