
大城市周边县域城镇空间结构优化的碳减排效应——基于人口空间分布的视角
|
邹璇(1973- ),男,湖南祁阳人,博士,教授,博士生导师,研究方向为空间经济学。E-mail: zouxuanlysq@aliyun.com |
收稿日期: 2024-04-01
修回日期: 2024-06-13
网络出版日期: 2025-01-23
基金资助
国家社会科学基金项目(23FJLB013)
湖南省自然科学基金项目(2022JJ30181)
Carbon emission reduction effects of optimizing the urban spatial structure of counties around large cities: From the perspective of population spatial distribution
Received date: 2024-04-01
Revised date: 2024-06-13
Online published: 2025-01-23
进入城镇化新阶段,大城市周边县域迎来了重要发展机遇,同时也面临巨大的低碳发展压力。以地处东部三大城市群中心地带的143个县域为研究对象,结合多源空间大数据考察了城镇空间结构对碳排放强度的影响。研究发现:(1)城镇空间结构分散化对碳排放强度具有促增效应,一系列稳健性检验之后核心结论依然成立。(2)影响机制在于,城镇空间结构分散化通过挤占蓝绿生态空间、刺激私人交通需求及推动产业间异速增长三条渠道导致碳排放强度提高。(3)进一步讨论发现,城镇空间结构对碳排放强度的促增效应是核心区碳减排与边缘区碳增排的“净”效应;不同演化阶段下,城镇空间结构分散化对碳排放强度的影响存在边际递增;不同城市群中,城镇空间结构的最佳优化方式存在异质性。研究结果有助于大城市周边县域在持续挖掘城镇化潜力的同时保持甚至促进低碳发展,进而对其协调“城镇化”与“双碳”两大核心战略具有一定的理论和现实意义。
邹璇 , 杨旭 . 大城市周边县域城镇空间结构优化的碳减排效应——基于人口空间分布的视角[J]. 自然资源学报, 2025 , 40(2) : 330 -349 . DOI: 10.31497/zrzyxb.20250204
Entering a new stage of urbanization, counties around large cities face significant development opportunities and immense low-carbon development pressures. This study examines 143 counties in the central areas of three major urban agglomerations in eastern China, using Landscan population distribution data, nighttime light data, and EDGAR carbon emission data. By applying the instrumental variable method, we investigate the impact of urban spatial structure on carbon emission intensity and its optimization directions. The study reveals that: (1) Decentralization of urban spatial structure increases carbon emission intensity. For every 0.01 unit increase in decentralization, carbon emissions increase by about 0.13 thousand tons per billion GDP. This core conclusion holds after a series of robustness tests. Economically, compared to 2007, the decentralization of urban spatial structure in 2019 led to an additional 62.07 million tons of carbon emissions, accounting for 8.69% of the total carbon emissions. (2) The study verifies the impact mechanisms from the dimensions of land, transportation, and industry. Specifically, decentralization increases carbon emission intensity through the encroachment on blue-green ecological spaces, stimulation of private transportation demand, and driving inter-industry growth through heteroscale effects. (3) Further discussion reveals that the promoting effect of urban spatial structure on carbon emission intensity results from the "net" effect of carbon reduction in core areas and an increase in peripheral areas. The impact of decentralization on carbon emission intensity shows marginal growth at different evolutionary stages. The optimal optimization methods for urban spatial structure vary among different urban agglomerations: counties in the Beijing-Tianjin-Hebei region should leverage the leading role of core areas, counties in the Yangtze River Delta should moderately control peripheral expansion, and counties in the Guangdong-Hong Kong-Macao Greater Bay Area should synergize carbon reduction efforts from both core and peripheral areas. This study helps counties around large cities tap into urbanization potential while maintaining or promoting low-carbon development, offering theoretical and practical significance for balancing the core strategies of "urbanization" and "dual carbon" goals.
表1 主要变量的描述性统计Table 1 Descriptive statistics of main variables |
| 名称 | 符号 | 单位 | 样本量/个 | 均值 | 标准差 | 最小值 | 最大值 |
|---|---|---|---|---|---|---|---|
| 碳排放强度 | Ci | 万t/亿元 | 1859 | 2.397 | 1.700 | 0.108 | 17.394 |
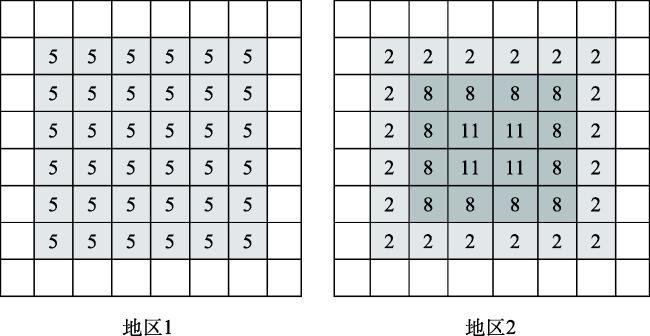
| 城镇空间结构 | Struc | — | 1859 | 0.518 | 0.057 | 0.331 | 0.709 |
| 历史城镇空间结构 | Struc1985 | — | 1859 | 1138.027 | 25.403 | 1037.602 | 1159.981 |
| 城镇化水平 | Urban | — | 1859 | 0.414 | 0.234 | 0.044 | 0.874 |
| 经济水平 | Rgdp | 万元 | 1859 | 5.467 | 4.602 | 0.737 | 23.725 |
| 工业水平 | Industy | — | 1859 | 0.493 | 0.108 | 0.204 | 0.710 |
| 外商投资 | Fdi | — | 1859 | 0 | 0.002 | 0 | 0.065 |
| 财政压力 | Fiscal | — | 1859 | 2.409 | 1.616 | 0.620 | 17.696 |
| 金融支持 | Loan | — | 1859 | 0.710 | 0.384 | 0.041 | 3.158 |
| 居民储蓄 | Save | — | 1859 | 0.737 | 0.315 | 0.041 | 2.426 |
| 粮食产量 | Agricul | 万t | 1859 | 28.986 | 24.950 | 0.010 | 142.527 |
| 行政类型 | Admin | — | 1859 | 0.392 | 0.488 | 0 | 1.000 |
| 气候特征 | Temper | ℃ | 1859 | -2.581 | 3.873 | -13.226 | 8.612 |
| 文化特征 | Culture | 个 | 1859 | 38.839 | 74.578 | 1.000 | 587 |
| 区位特征 | Time | 小时 | 1859 | 2.491 | 1.543 | 0.627 | 7.650 |
表2 基准回归结果Table 2 Baseline regression results |
| (1) Ci OLS | (2) Ci OLS | (3) Ci OLS | (4) Ci IV | (5) Ci IV | (6) Ci IV | |
|---|---|---|---|---|---|---|
| Struc | 10.317*** (1.094) | 7.051*** (1.101) | 4.191*** (1.248) | 15.588*** (4.223) | 15.596*** (5.462) | 13.102** (6.512) |
| 控制变量 | 是 | 是 | 是 | 是 | 是 | 是 |
| 县域特征 | 否 | 是 | 是 | 否 | 是 | 是 |
| 城市群固定 | 否 | 否 | 是 | 否 | 否 | 是 |
| 时间固定 | 否 | 否 | 是 | 否 | 否 | 是 |
| 第一阶段系数 | 0.001*** (0.000) | 0.001*** (0.000) | 0.001*** (0.000) | |||
| Kleibergen-Paap rk LM | 17.878*** (0.000) | 18.677*** (0.000) | 11.183*** (0.000) | |||
| 第一阶段F值 | 15.353 | 20.291 | 14.347 | |||
| Obs/个 | 1823 | 1823 | 1823 | 1823 | 1823 | 1823 |
| R2 | 0.600 | 0.651 | 0.702 | 0.561 | 0.574 | 0.305 |
注:***、**分别表示回归系数在1%、5%的水平上显著;括号内是聚类到县域层面的稳健标准误;Kleibergen-Paap rk LM统计量的括号内为P值。下同。 |
表3 核心变量的稳健性Table 3 Robustness of core variables |
| (1) Ci | (2) Ci | (3) lnRemss | (4) CiCEADs | |
|---|---|---|---|---|
| lnPPD | -1.627* (0.887) | |||
| HHI | -5.808** (2.750) | |||
| Struc | 4.419** (2.075) | 28.208** (10.316) | ||
| 控制变量 | 是 | 是 | 是 | 是 |
| 县域特征 | 是 | 是 | 是 | 是 |
| 城市群固定 | 是 | 是 | 是 | 是 |
| 时间固定 | 是 | 是 | 是 | 是 |
| Kleibergen-Paap rk LM | 9.723*** (0.001) | 16.432*** (0.000) | 9.641*** (0.008) | 11.223*** (0.001) |
| 第一阶段F值 | 15.555 | 20.671 | 11.859 | 13.715 |
| Obs/个 | 1823 | 1823 | 1823 | 1784 |
注:控制变量及县域特征变量与基准回归一致;*表示回归系数在10%的水平上显著。下同。 |
表4 挤占蓝绿生态空间机制Table 4 Mechanism of crowding out blue-green ecological spaces |
| (1) Impervious | (2) Ecology | (3) NDVI | (4) lnSeques | |
|---|---|---|---|---|
| Struc | 1.921*** (0.593) | -13.172*** (3.619) | -4.184*** (1.388) | -20.098*** (4.996) |
| 控制变量 | 是 | 是 | 是 | 是 |
| 县域特征 | 是 | 是 | 是 | 是 |
| 城市群固定 | 是 | 是 | 是 | 是 |
| 时间固定 | 是 | 是 | 是 | 是 |
| Kleibergen-Paap rk LM | 9.641*** (0.002) | 7.046*** (0.008) | 9.641*** (0.002) | 7.046*** (0.008) |
| 第一阶段F值 | 11.859 | 32.565 | 11.859 | 32.565 |
| Obs/个 | 1859 | 1859 | 1859 | 1859 |
表5 刺激私人交通需求机制Table 5 Mechanism stimulating private transportation demand |
| (1) Road_NET | (2) Road_PER | (3) Car_PER | (4) lnCommute_TIME | |
|---|---|---|---|---|
| Struc | 18.627** (7.106) | 246.940** (96.272) | 1.112* (0.615) | 1.344* (0.862) |
| 控制变量 | 是 | 是 | 是 | 是 |
| 县域特征 | 是 | 是 | 是 | 是 |
| 城市群固定 | 是 | 是 | 是 | 是 |
| 时间固定 | 是 | 是 | 是 | 否(截面数据) |
| Kleibergen-Paap rk LM | 8.820* (0.093) | 9.710*** (0.002) | 29.973*** (0.000) | |
| 第一阶段F值 | 9.232 | 12.126 | 14.193 | |
| Obs/个 | 1248 | 515 | 1140 | 136 |
表6 推动产业间异速增长机制Table 6 Mechanism promoting allometric growth among industries |
| (1) Allometry_VA | (2) Allometry_EP | (3) Power_PER | |
|---|---|---|---|
| Struc | -0.766** (0.264) | -1.893** (0.946) | 14.654* (7.910) |
| 控制变量 | 是 | 是 | 是 |
| 县域特征 | 是 | 是 | 是 |
| 城市群固定 | 是 | 是 | 是 |
| 时间固定 | 是 | 是 | 是 |
| Kleibergen-Paap rk LM | 9.907*** (0.007) | 12.919*** (0.001) | 9.641*** (0.002) |
| 第一阶段F值 | 12.372 | 12.095 | 11.859 |
| Obs/个 | 1823 | 881 | 1859 |
表7 核心区集聚与边缘区扩张的异质性Table 7 Heterogeneity of agglomeration in core areas and expansion in peripheral areas |
| (1) Ci | (2) Ci | (3) Ci | (4) Ci | (5) Ci | (6) Ci | |
|---|---|---|---|---|---|---|
| 标准识别条件 | 提高识别条件 | 降低识别条件 | ||||
| lnAgg_center | -4.333** (2.023) | -4.369** (2.000) | -4.049** (1.951) | |||
| lnExp_edge | 2.717*** (0.739) | 2.782*** (0.773) | 2.305*** (0.608) | |||
| 控制变量 | 是 | 是 | 是 | 是 | 是 | 是 |
| 县域特征 | 是 | 是 | 是 | 是 | 是 | 是 |
| 城市群固定 | 是 | 是 | 是 | 是 | 是 | 是 |
| 时间固定 | 是 | 是 | 是 | 是 | 是 | 是 |
| Kleibergen-Paap rk LM | 9.739* (0.053) | 11.474*** (0.001) | 9.973** (0.046) | 11.522*** (0.001) | 9.675* (0.055) | 12.753*** (0.000) |
| 第一阶段F值 | 12.779 | 13.731 | 13.131 | 14.264 | 12.729 | 14.816 |
| Obs/个 | 1704 | 1823 | 1716 | 1823 | 1692 | 1823 |
表8 城镇空间结构演化阶段的异质性Table 8 Heterogeneity in stages of urban spatial structure evolution |
| (1) Ci | (2) Ci | (3) Ci | (4) Ci | (5) Ci | (6) Ci | |||
|---|---|---|---|---|---|---|---|---|
| 标准识别条件 | 提高识别条件 | 降低识别条件 | ||||||
| Struc (核心区主导) | 11.219*** (3.987) | 21.178*** (6.117) | 18.433*** (5.952) | |||||
| Struc (边缘区主导) | 27.585*** (7.120) | 35.286*** (12.587) | 23.356*** (7.601) | |||||
| 控制变量 | 是 | 是 | 是 | 是 | 是 | 是 | ||
| 县域特征 | 是 | 是 | 是 | 是 | 是 | 是 | ||
| 城市群固定 | 是 | 是 | 是 | 是 | 是 | 是 | ||
| 时间固定 | 是 | 是 | 是 | 是 | 是 | 是 | ||
| Kleibergen-Paap rk LM | 12.264*** (0.000) | 17.431*** (0.000) | 13.663*** (0.001) | 16.805*** (0.000) | 12.322*** (0.000) | 18.774*** (0.000) | ||
| 第一阶段F值 | 13.543 | 16.153 | 14.560 | 15.602 | 12.928 | 16.817 | ||
| Obs/个 | 660 | 1163 | 949 | 874 | 525 | 1298 | ||
表9 城镇空间结构优化方式的异质性Table 9 Heterogeneity in methods of optimizing urban spatial structure |
| (1) Ci 京津冀 | (2) Ci 长三角 | (3) Ci 珠三角 | (4) Ci 京津冀 | (5) Ci 长三角 | (6) Ci 珠三角 | |
|---|---|---|---|---|---|---|
| lnAgg_center | -4.143** (1.729) | -5.494 (11.566) | -7.188** (2.912) | |||
| lnExp_edge | 0.547 (3.083) | 0.519* (0.267) | 1.572*** (0.352) | |||
| 控制变量 | 是 | 是 | 是 | 是 | 是 | 是 |
| 县域特征 | 是 | 是 | 是 | 是 | 是 | 是 |
| 城市群固定 | 否 | 否 | 否 | 否 | 否 | 否 |
| 时间固定 | 是 | 是 | 是 | 是 | 是 | 是 |
| Kleibergen-Paap rk LM | 5.998*** (0.000) | 10.298*** (0.004) | 3.410* (0.065) | 6.873** (0.027) | 22.758*** (0.000) | 3.534* (0.060) |
| 第一阶段F值 | 9.217 | 13.827 | 9.035 | 10.611 | 36.470 | 11.365 |
| Obs/个 | 290 | 1258 | 156 | 333 | 1334 | 156 |
| [1] |
陆铭, 李鹏飞. 区位与分工: 论统一大市场建设下的县域城镇化. 农业经济问题, 2023, 44(1): 18-28.
[
|
| [2] |
王少剑, 谢紫寒, 王泽宏. 中国县域碳排放的时空演变及影响因素. 地理学报, 2021, 76(12): 3103-3118.
[
|
| [3] |
|
| [4] |
|
| [5] |
|
| [6] |
毛其智, 龙瀛, 吴康. 中国人口密度时空演变与城镇化空间格局初探: 从2000年到2010年. 城市规划, 2015, 39(2): 38-43.
[
|
| [7] |
|
| [8] |
江曼琦, 席强敏. 中国主要城市化地区测度: 基于人口聚集视角. 中国社会科学, 2015, (8): 26-46, 204-205.
[
|
| [9] |
李顺成,
[
|
| [10] |
梁昌一, 刘修岩, 李松林. 城市空间发展模式与雾霾污染: 基于人口密度分布的视角. 经济学动态, 2021, (2): 80-94.
[
|
| [11] |
梁若冰, 蓝天. 行政区扩张、土地出让依赖与城市发展质量: 基于卫星灯光数据的准实验研究. 经济学(季刊), 2023, 23(3): 1019-1034.
[
|
| [12] |
郭峰, 熊云军, 石庆玲, 等. 数字经济与行政边界地区经济发展再考察: 来自卫星灯光数据的证据. 管理世界, 2023, 39(4): 16-33.
[
|
| [13] |
|
| [14] |
|
| [15] |
田成诗, 张亚兵. 中国多中心城市空间结构与能源效率关系. 自然资源学报, 2022, 37(1): 135-148.
[
|
| [16] |
韩帅帅, 苗长虹, 李奕灿. 黄河流域城市多中心空间结构对碳排放的影响研究. 地理研究, 2023, 42(4): 936-954.
[
|
| [17] |
王田雨, 岳文泽. 面向碳增汇的国土空间格局优化: 理论框架与行动逻辑. 自然资源学报, 2024, 39(5): 1008-1021.
[
|
| [18] |
钟顺昌, 汪文竹, 闫程莉. 碳减排目标下中国省域城市建设用地空间配置响应研究. 自然资源学报, 2023, 38(7): 1896-1918.
[
|
| [19] |
汪宗顺, 张海鹏, 岳超, 等. 造林增汇是实现碳中和的成本有效途径吗? 以西北地区为例. 自然资源学报, 2024, 39(3): 731-748.
[
|
| [20] |
李治国, 王杰, 车帅. 土地城市化推进的空间减排效应: 内在机制与中国经验. 统计研究, 2021, 38(12): 89-104.
[
|
| [21] |
林伯强, 杜之利. 中国城市车辆耗能与公共交通效率研究. 经济研究, 2018, 53(6): 142-156.
[
|
| [22] |
孙传旺, 罗源, 姚昕. 交通基础设施与城市空气污染: 来自中国的经验证据. 经济研究, 2019, 54(8): 136-151.
[
|
| [23] |
姚洪江, 王昆仑. 中国的低碳交通建设: 整合性治理框架下的减碳实践. 世界经济, 2023, 46(6): 132-157.
[
|
| [24] |
钟粤俊, 奚锡灿, 陆铭. 城市间要素配置: 空间一般均衡下的结构与增长. 经济研究, 2024, 59(2): 59-77.
[
|
| [25] |
陈姝兴, 付文强, 吴康. 城市收缩对土地价格的影响及其空间溢出效应. 资源科学, 2024, 46(2): 308-320.
[
|
| [26] |
席强敏, 梅林. 工业用地价格、选择效应与工业效率. 经济研究, 2019, 54(2): 102-118.
[
|
| [27] |
冯晨, 朱星姝, 吴丰华, 等. 工业用地出让价格对企业投资的影响: 基于“以地引资” 的视角. 数量经济技术经济研究, 2023, 40(11): 180-201.
[
|
| [28] |
邵帅, 范美婷, 杨莉莉. 经济结构调整、绿色技术进步与中国低碳转型发展: 基于总体技术前沿和空间溢出效应视角的经验考察. 管理世界, 2022, 38(2): 46-69, 4-10.
[
|
| [29] |
林伯强. 碳中和进程中的中国经济高质量增长. 经济研究, 2022, 57(1): 56-71.
[
|
| [30] |
兰秀娟, 张卫国, 裴璇. 我国中心—外围城市经济发展差异及收敛性研究. 数量经济技术经济研究, 2021, 38(6): 45-65.
[
|
| [31] |
刘修岩, 杜聪, 盛雪绒. 容积率规制与中国城市空间结构. 经济学(季刊), 2022, 22(4): 1447-1466.
[
|
| [32] |
龙瀛, 吴康. 中国城市化的几个现实问题: 空间扩张、人口收缩、低密度人类活动与城市范围界定. 城市规划学刊, 2016, (2): 72-77.
[
|
| [33] |
|
| [34] |
王峤, 刘修岩, 李迎成. 空间结构、城市规模与中国城市的创新绩效. 中国工业经济, 2021, (5): 114-132.
[
|
| [35] |
|
| [36] |
孙浩, 郭劲光. 地方经济增长目标管理对碳排放效率的影响. 自然资源学报, 2024, 39(1): 186-205.
[
|
| [37] |
|
| [38] |
|
| [39] |
郭旭, 孙晓华, 翟钰. 地区产业结构升级速度的测算及时空演变分析. 数量经济技术经济研究, 2021, 38(9): 98-116.
[
|
| [40] |
|
/
| 〈 |
|
〉 |