
中国城镇化与碳排放机制分析及实证研究——基于经济发展、人口转移和城镇扩张视角
|
陈姜全(2000- ),男,四川巴中人,博士研究生,主要从事资源环境经济与碳排放研究。E-mail: 1515730957@qq.com |
收稿日期: 2023-07-09
修回日期: 2024-03-19
网络出版日期: 2024-06-11
基金资助
国家自然科学基金项目(71874192)
中央高校基本科研业务重大项目培育专项基金(2020ZDPY0219)
中央高校基本科研业务重大项目培育专项基金(2022ZDPYSK08)
中国人民大学教育基金会林增杰土地科学发展基金优秀学术论文资助项目(2023)
Mechanism analysis and empirical research on urbanization and carbon emissions in China: Based on the perspective of economic development, population transfer, and urban expansion
Received date: 2023-07-09
Revised date: 2024-03-19
Online published: 2024-06-11
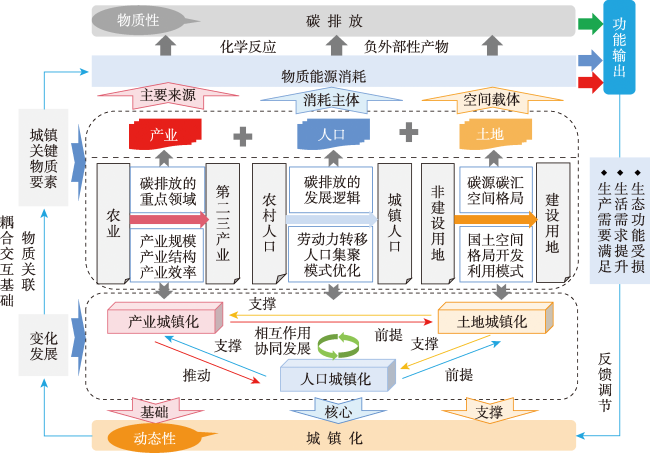
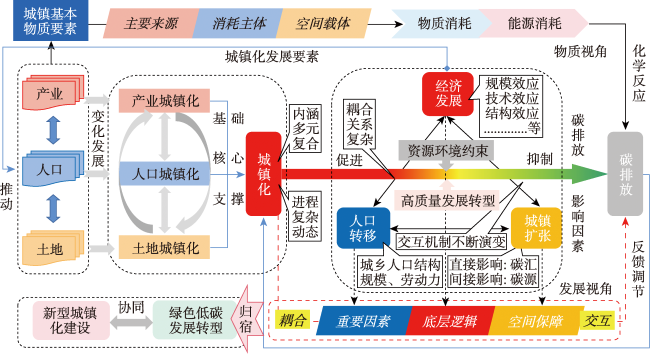
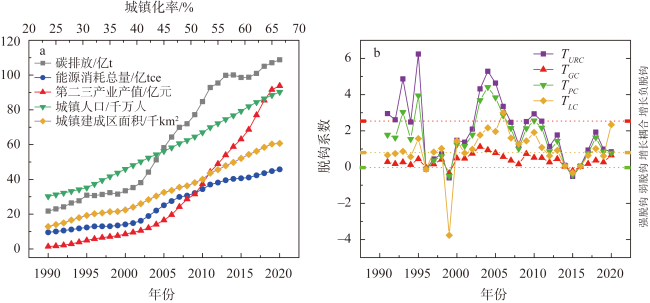
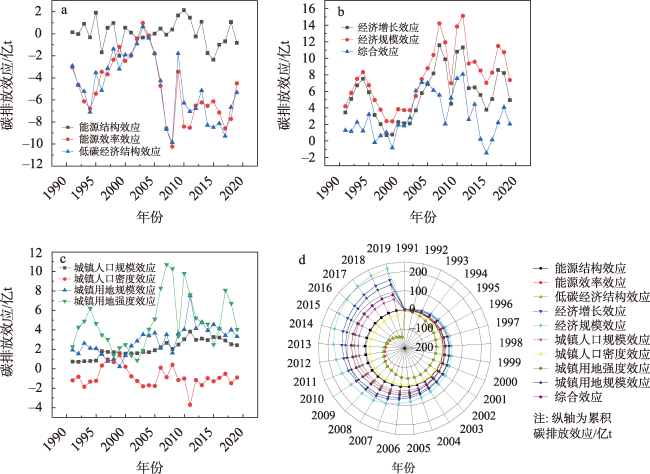
城镇化与碳排放都是国家关注重点、学界研究热点和政策治理难点。基于经济发展、人口转移和城镇扩张视角,从“产业—人口—土地”多维度分析城镇化与碳排放机制,并综合运用脱钩分析、Kaya-LMDI因素分解和STIRPAT-LSDV模型,实证研究中国城镇化与碳排放机制。结果发现:(1)产业、人口和土地是城镇化的关键物质要素,其交互演变构成碳排放变化的逻辑起点。经济发展、人口转移和城镇扩张是城镇化与碳排放耦合交互的底层逻辑、重要因素和空间保障。(2)加入WTO以来,中国工业化进程加快,城镇化与碳排放耦合关系从弱脱钩转变为增长耦合乃至增长负脱钩。迈入高质量发展阶段后,产业、人口和土地城镇化对碳排放的促进作用逐渐衰竭。(3)1990—2020年,伴随城镇化快速推进,中国能源结构、能源效率、低碳经济结构、人均经济水平、经济规模、城镇人口规模、城镇人口密度、城镇用地规模、城镇用地强度的变动,对碳排放的作用效应分别为1.37亿t、-139.98亿t、-138.61亿t、163.53亿t、223.95亿t、60.41亿t、-25.24亿t、85.66亿t、138.29亿t。(4)2003—2020年,中国能源结构、能源效率、第二三产业占比、城镇人口、城镇建成区面积分别提升1%,碳排放相应增长1.111%、-0.560%、0.771%、0.477%、0.488%,并且城镇化与碳排放交互机制具有时空异质性。研究结果能够为新型城镇化和“双碳”战略实施提供科学依据与决策参考。
陈姜全 , 李效顺 , 耿艺伟 , 刘希朝 , 李光亮 . 中国城镇化与碳排放机制分析及实证研究——基于经济发展、人口转移和城镇扩张视角[J]. 自然资源学报, 2024 , 39(6) : 1399 -1417 . DOI: 10.31497/zrzyxb.20240609
Urbanization and carbon emissions are both national focuses, academic research hotspots, and policy governance difficulties. Based on the perspectives of economic development, population transfer, and urban expansion, this paper analyzes the mechanisms of urbanization and carbon emissions from the multi-dimensional perspective of "industry-population-land", and uses decoupling analysis, Kaya-LMDI factor decomposition, and STIRPAT-LSDV model to empirically study the mechanisms of urbanization and carbon emissions in China. The study indicates that: (1) The material elements of urbanization, namely industry, population, and land, play a crucial role in the evolution of urbanization, and their changes are the logical starting point for changes in carbon emissions. The underlying logic, important factors, and spatial guarantee of the coupling interaction between urbanization and carbon emissions are economic development, population transfer, and urban expansion. (2) Since China acceded to the WTO, industrialization has accelerated. The relationship between urbanization and carbon emissions has changed from weak decoupling to growth coupling and even negative decoupling. As China enters the stage of high-quality economic development, the role of industry, population, and land urbanization in promoting carbon emissions has gradually diminished. (3) From 1990 to 2020, the effects of China's energy structure, energy efficiency, low-carbon economic structure, per capita economic level, economic scale, urban population size, urban population density, urban land size, and urban land use intensity on carbon emissions in the process of urbanization were 1.37, -139.98, -138.61, 163.53, 223.95, 60.41, -25.24, 85.66, and 138.29 billion tons, respectively. (4) Between 2003 and 2020, China's energy structure, energy efficiency, proportion of output value of the secondary and tertiary industries, urban population, and urban built-up area increased by 1% respectively, and carbon emissions correspondingly increased by 1.111%, -0.560%, 0.771%, 0.477%, and 0.488%, respectively. The interaction mechanism between urbanization and carbon emissions has spatial and temporal heterogeneity. The research results can provide scientific basis and decision-making reference for the implementation of new urbanization and the "Carbon Peaking and Carbon Neutrality Goals" strategy.
表1 城镇化对碳排放作用效应的分解说明Table 1 The interpretation for the decomposition of the effect of urbanization on carbon emissions |
| 作用效应 | |||||
|---|---|---|---|---|---|
| 指标解释 | 能源结构 | 能源效率 | 低碳经济结构 | 人均经济水平 | 经济规模 |
| 效应是否复合 | 复合 | 复合 | |||
| 效应来源 | 经济发展 | 经济发展、人口转移、城镇扩张 | |||
| 作用效应 | + | + | |||
| 指标解释 | 城镇人口规模 | 城镇人口密度 | 城镇用地规模 | 城镇用地强度 | 综合效应 |
| 效应是否复合 | 复合 | 复合 | 复合 | ||
| 效应来源 | 人口转移 | 人口转移、 城镇扩张 | 城镇扩张 | 城镇扩张、 经济发展 | 经济发展、人口转移、城镇扩张 |
表2 经济区域和发展阶段划分Table 2 Division of economic regions and development stages |
| 经济区域划分 | 发展阶段划分 | ||
|---|---|---|---|
| 东部地区 | 北京、天津、河北、辽宁、上海、江苏、浙江、福建、山东、广东、海南 | 2003—2016年 | 经济快速发展阶段 |
| 中部地区 | 山西、吉林、黑龙江、安徽、江西、河南、湖北、湖南 | 2017—2020年 | 经济高质量发展转型阶段 |
| 西部地区 | 四川、重庆、贵州、云南、陕西、甘肃、青海、宁夏、新疆、广西、内蒙古 | ||
表3 城镇化对碳排放作用效应分解结果Table 3 The decomposition results of the effect of urbanization on carbon emissions |
| 分解指标 | |||||
|---|---|---|---|---|---|
| 指标解释 | 能源结构 | 能源效率 | 低碳经济结构 | 人均经济水平 | 经济规模 |
| 贡献量/亿t | 1.37 | -139.98 | -138.61 | 163.53 | 223.95 |
| 贡献率/% | 1.60 | -164.03 | -162.43 | 191.63 | 262.42 |
| 分解指标 | + | + | |||
| 指标解释 | 城镇人口规模 | 城镇人口密度 | 城镇用地规模 | 城镇建用地强度 | 碳排放 |
| 贡献量/亿t | 60.41 | -25.24 | 85.66 | 138.29 | 85.34 |
| 贡献率/% | 70.79 | -29.58 | 100.37 | 162.05 | 100.00 |
表4 中国城镇化与碳排放交互机制考察:回归分析结果Table 4 Investigation on the interaction mechanism between urbanization and carbon emissions in China: Regression analysis results |
| 变量 | (1)lnC | (2)lnC | (3)lnC | (4)lnC | (5)lnC | (6)lnC | (7)lnC | (8)lnC |
|---|---|---|---|---|---|---|---|---|
| lnCE | 1.230*** | 1.252*** | 1.111*** | 1.063*** | 1.071*** | 1.115*** | 1.096*** | 1.114*** |
| (25.27) | (24.60) | (22.19) | (21.81) | (18.85) | (23.13) | (19.91) | (24.92) | |
| lnEG | -0.392*** | -0.265*** | -0.560*** | -0.555*** | -0.572*** | -0.558*** | -0.546*** | -0.528*** |
| (-16.41) | (-7.15) | (-7.34) | (-7.64) | (-6.37) | (-7.60) | (-7.13) | (-6.36) | |
| lngdp23_r | 2.835*** | 0.733*** | 0.771*** | 0.944*** | 0.763*** | 0.844*** | 0.881*** | |
| (15.45) | (4.80) | (3.29) | (4.05) | (3.27) | (3.77) | (3.78) | ||
| lngdp2_r | 0.509*** | |||||||
| (4.83) | ||||||||
| lngdp3_r | -0.002 | |||||||
| (-0.02) | ||||||||
| lnu_pop | 0.432*** | 1.047*** | 0.477** | 0.529** | 0.471** | 0.529** | ||
| (9.31) | (10.15) | (2.56) | (2.72) | (2.57) | (2.61) | |||
| lnr_pop | 0.062 | |||||||
| (0.72) | ||||||||
| lnur_r | 0.230* | |||||||
| (1.73) | ||||||||
| lnlabor23 | 0.167* | |||||||
| (1.86) | ||||||||
| lnland | 0.487*** | 0.635*** | 0.488*** | 0.290*** | 0.522*** | 0.506*** | 0.561*** | |
| (10.55) | (9.53) | (5.83) | (3.11) | (5.74) | (5.11) | (7.80) | ||
| L.lnland | 0.415*** | |||||||
| (4.59) | ||||||||
| Constant | 2.679*** | -3.274*** | 1.577 | 2.828** | 4.012*** | 1.032 | 3.456*** | 1.879 |
| (15.29) | (-5.63) | (1.51) | (2.07) | (8.31) | (0.76) | (4.72) | (1.66) | |
| 省份固定效应 | 否 | 是 | 是 | 是 | 是 | 是 | 是 | 是 |
| 时间固定效应 | 否 | 否 | 是 | 是 | 是 | 是 | 是 | 是 |
| Observations/个 | 540 | 540 | 540 | 540 | 540 | 540 | 540 | 510 |
| R-squared | 0.896 | 0.868 | 0.959 | 0.965 | 0.956 | 0.959 | 0.957 | 0.951 |
| Adj R2 | 0.895 | 0.859 | 0.958 | 0.963 | 0.954 | 0.958 | 0.956 | 0.949 |
| F | 780.4 | 661.7 | 309.1 | 732.4 | 356.9 | 294.4 | 256.6 | 691.3 |
| Num of prov/个 | 30 | 30 | 30 | 30 | 30 | 30 | 30 |
注:***为p<0.01,**为p<0.05,*为p<0.1,下同。 |
表5 中国城镇化与碳排放交互机制考察:异质性分析结果Table 5 Investigation on the interaction mechanism between urbanization and carbon emissions in China: Results of heterogeneity analysis |
| 变量 | (1)全样本 lnC | (2)东部 lnC | (3)中部 lnC | (4)西部 lnC | (5)2003—2016年lnC | (6)2017—2020年lnC |
|---|---|---|---|---|---|---|
| lnCE | 1.111*** | 1.127*** | 0.699*** | 1.142*** | 1.307*** | 1.060*** |
| (22.19) | (22.11) | (6.20) | (33.30) | (19.92) | (38.98) | |
| lnEG | -0.560*** | -0.107* | -0.401*** | -0.646*** | -0.233*** | -0.170*** |
| (-7.34) | (-1.92) | (-5.58) | (-18.58) | (-5.14) | (-2.78) | |
| lngdp23_r | 0.771*** | 0.304** | 0.624*** | 0.817*** | 0.403*** | 0.055 |
| (3.29) | (2.23) | (2.75) | (4.61) | (2.65) | (0.12) | |
| lnu_pop | 0.477** | 0.246** | 0.649*** | 0.538*** | 1.161*** | 0.520*** |
| (2.56) | (2.38) | (5.56) | (3.71) | (9.31) | (5.26) | |
| lnland | 0.488*** | 0.663*** | 0.205*** | 0.739*** | 0.374*** | |
| (5.83) | (11.43) | (2.91) | (10.08) | (3.78) | ||
| Constant | 1.577 | 2.232*** | 0.499 | 2.753*** | -4.926*** | 2.752*** |
| (1.51) | (2.83) | (0.68) | (2.92) | (-6.50) | (3.68) | |
| 省份固定效应 | 是 | 是 | 是 | 是 | 是 | 是 |
| 时间固定效应 | 是 | 是 | 是 | 是 | 否 | 否 |
| Observations/个 | 540 | 198 | 144 | 198 | 420 | 120 |
| R-squared | 0.959 | 0.966 | 0.966 | 0.981 | 0.880 | 0.953 |
| Adj R2 | 0.958 | 0.959 | 0.957 | 0.977 | 0.869 | 0.934 |
| Num of prov/个 | 30 | 11 | 8 | 11 | 30 | 30 |
| F | 309.1 | 212.0 | 147.3 | 379.5 | 564.1 | 346.0 |
| [1] |
|
| [2] |
中共中央, 国务院. 国家新型城镇化规划(2014—2020年). 北京: 人民出版社, 2014.
[CPC Central Committee, State Council. National New Urbanization Plan (2014-2020). Beijing: People's Publishing House, 2014.]
|
| [3] |
习近平. 继往开来,开启全球应对气候变化新征程: 在气候雄心峰会上的讲话. 人民日报, 2020-12-13( 2).
[
|
| [4] |
习近平. 中国共产党第二十次全国代表大会报告. 新华社, 2022-10-16.
[
|
| [5] |
顾朝林, 管卫华, 刘合林. 中国城镇化2050: SD模型与过程模拟. 中国科学: 地球科学, 2017, 47(7): 818-832.
[
|
| [6] |
杜修立, 张昱昭. 中国城镇化率提升的动力分解与新发展阶段趋势预测: 基于国际比较的一种新方法. 统计研究, 2022, 39(2): 33-47.
[
|
| [7] |
|
| [8] |
|
| [9] |
|
| [10] |
|
| [11] |
|
| [12] |
|
| [13] |
|
| [14] |
|
| [15] |
|
| [16] |
|
| [17] |
|
| [18] |
刘婕, 魏玮. 城镇化率、要素禀赋对全要素碳减排效率的影响. 中国人口·资源与环境, 2014, 24(8): 42-48.
[
|
| [19] |
林伯强, 刘希颖. 中国城市化阶段的碳排放: 影响因素和减排策略. 经济研究, 2010, 45(8): 66-78.
[
|
| [20] |
周葵, 戴小文. 中国城市化进程与碳排放量关系的实证研究. 中国人口·资源与环境, 2013, 23(4): 41-48.
[
|
| [21] |
孙玉阳, 侯晓娜, 柳清瑞. 城镇化进程中碳排放轨迹及其传导机制. 技术经济与管理研究, 2023, (4): 78-82.
[
|
| [22] |
刘希雅, 王宇飞, 宋祺佼, 等. 城镇化过程中的碳排放来源. 中国人口·资源与环境, 2015, 25(1): 61-66.
[
|
| [23] |
张腾飞, 杨俊, 盛鹏飞. 城镇化对中国碳排放的影响及作用渠道. 中国人口·资源与环境, 2016, 26(2): 47-57.
[
|
| [24] |
王志强, 蒲春玲. 中国城镇化碳排放核算体系构建与实证. 统计与决策, 2022, 38(7): 57-61.
[
|
| [25] |
沈杨, 汪聪聪, 高超, 等. 基于城市化的浙江省湾区经济带碳排放时空分布特征及影响因素分析. 自然资源学报, 2020, 35(2): 329-342.
[
|
| [26] |
李竹, 王兆峰, 吴卫, 等. 碳中和目标下中国省域碳平衡能力与城镇化的关系. 自然资源学报, 2022, 37(12): 3136-3152.
[
|
| [27] |
李硕硕, 刘耀彬, 骆康. 环鄱阳湖县域新型城镇化对碳排放强度的空间溢出效应. 资源科学, 2022, 44(7): 1449-1462.
[
|
| [28] |
俞洁, 张勇, 李清瑶. 长三角碳排放空间关联网络结构特征及演化机制. 自然资源学报, 2024, 39(2): 372-391.
[
|
| [29] |
张莹, 雷国平, 周敏, 等. 中国人口土地产业城镇化的协同演化状况. 城市问题, 2019, (1):14-22.
[
|
| [30] |
丁明磊, 杨晓娜, 赵荣钦, 等. 碳中和目标下的国土空间格局优化: 理论框架与实践策略. 自然资源学报, 2022, 37(5): 1137-1147.
[
|
| [31] |
庄贵阳, 窦晓铭, 魏鸣昕. 碳达峰碳中和的学理阐释与路径分析. 兰州大学学报: 社会科学版, 2022, 50(1): 57-68.
[
|
| [32] |
曲福田, 卢娜, 冯淑怡. 土地利用变化对碳排放的影响. 中国人口·资源与环境, 2011, 21(10): 76-83.
[
|
| [33] |
李光亮, 李效顺, 和伟康, 等. 基于系统建模的城市土地利用碳达峰仿真研究: 以江苏省为例. 长江流域资源与环境, 2023, 32(2): 260-272.
[
|
| [34] |
李效顺, 曲福田, 郭忠兴, 等. 城乡建设用地变化的脱钩研究. 中国人口·资源与环境, 2008, 18(5):179-184.
[
|
| [35] |
|
| [36] |
|
| [37] |
卢娜, 曲福田, 冯淑怡, 等. 基于STIRPAT模型的能源消费碳足迹变化及影响因素: 以江苏省苏锡常地区为例. 自然资源学报, 2011, 26(5): 814-824.
[
|
| [38] |
IPCC. Climate Change 2007: The Fourth Assessment Report of the Inter governmental Panel on Climate Change. England: Cambridge University Press, 2007.
|
/
| 〈 |
|
〉 |