
中国城市群旅游经济韧性的动态变化及障碍因子分析
|
杨莎莎(1981- ),女,广西河池人,博士,教授,博士生导师,主要从事区域旅游可持续发展方向的研究。E-mail: yss121@126.com |
收稿日期: 2023-09-18
修回日期: 2024-01-09
网络出版日期: 2024-06-11
基金资助
国家社会科学基金重大项目(20&ZD157)
Spatiotemporal dynamic and obstacle factor analysis of tourism economic resilience in Chinese urban agglomeration
Received date: 2023-09-18
Revised date: 2024-01-09
Online published: 2024-06-11
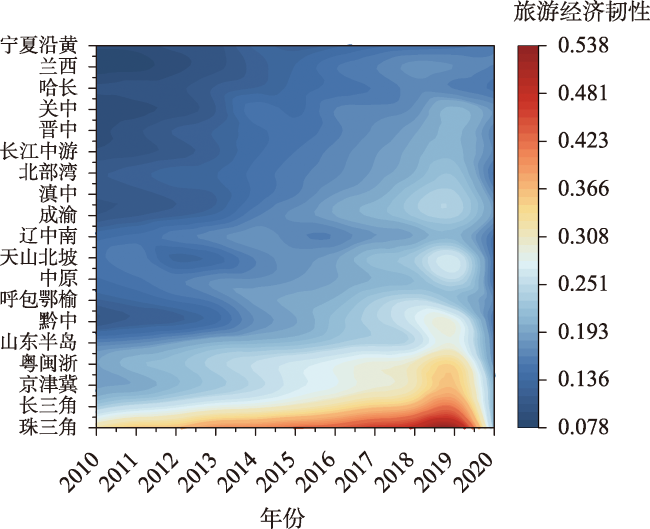
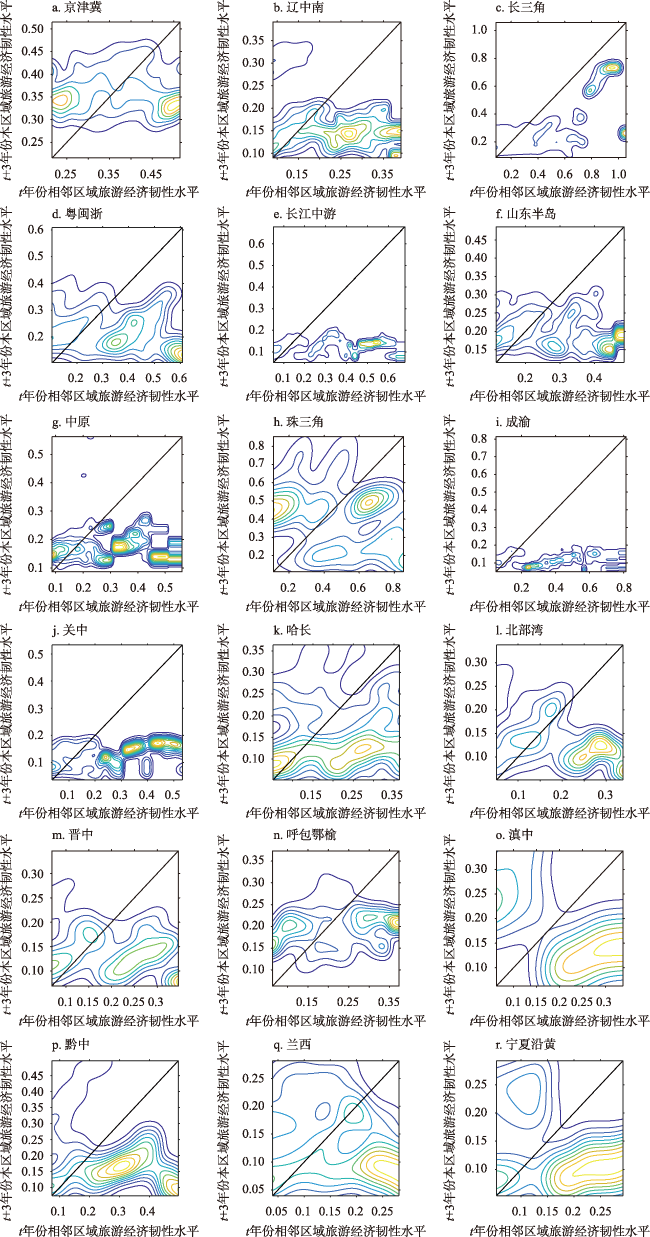
旅游经济韧性强调旅游生态系统吸收或承受扰动和其他压力的能力,使旅游产业的发展维持其结构和功能;旅游韧性管理通过合理的内外部资源利用,以最快的速度恢复旅游产品供给和旅游服务功能。在多源数据支持下,构建中国城市群旅游经济韧性评价指标体系,运用组合动态评价法对各城市群旅游经济韧性进行定量分析以及识别韧性水平层次,通过空间核密度方法对城市群旅游经济韧性的演进过程、空间分布形态进行动态分析,使用障碍度模型分析各准则层与指标层对旅游经济韧性的负面影响程度,为旅游经济韧性水平提升寻找路径支撑。结果表明:(1)大多数城市群在2010—2018年间的旅游经济韧性均呈上升趋势,但2020年受到疫情的影响,旅游经济韧性下降;(2)城市群旅游经济韧性发展与区域经济发展的空间格局及演进规律基本一致;(3)城市群内部相邻城市的发展对韧性水平的影响较小,城市群整体的旅游经济韧性水平相对独立;(4)数字化工具在旅游业中的应用对提高韧性起到了积极作用。
杨莎莎 , 黄丽露 , 段至诚 , 黄婉华 . 中国城市群旅游经济韧性的动态变化及障碍因子分析[J]. 自然资源学报, 2024 , 39(6) : 1262 -1277 . DOI: 10.31497/zrzyxb.20240602
The resilience of the tourism economy emphasizes the ability of the tourism ecosystem to absorb or withstand disturbances and other pressures, enabling the development of the tourism industry to maintain its structure and function. Good tourism resilience management can restore the supply of tourism products and the functions of tourism services at the fastest speed through reasonable utilization of internal and external resources. Supported by multi-source data, a tourism economic resilience evaluation index system for Chinese urban agglomerations was constructed. The combination dynamic evaluation method was used to quantitatively analyze the tourism economic resilience of each urban agglomeration and identify the level of resilience. The spatial kernel density method was used to dynamically simulate and analyze the evolution process and spatial distribution pattern of tourism economic resilience in urban agglomerations. An obstacle model was used to analyze the negative impact of each criterion layer and indicator layer on tourism economic resilience, in order to find path support for improving the level of tourism economic resilience. The results indicate that: (1) The tourism economic resilience of most urban agglomerations showed an upward trend from 2010 to 2018, reflecting the overall enhancement of tourism economy in different regions of China. However, due to the impact of the COVID-19 in 2020, the resilience of tourism economy declined. (2) The spatial pattern and evolution law of the resilience development of tourism economy in urban agglomerations are basically consistent with that of regional economic development. (3) The development of adjacent cities within the urban agglomeration has a relatively small impact on the resilience level, and the overall tourism economic resilience level of the urban agglomeration is relatively independent. (4) The application of digital tools in the tourism industry has a positive impact on enhancing resilience. This article proposes suggestions to strengthen resilience in responding to emergencies, promote the widespread application of digitalization and informatization in the tourism industry, optimize the infrastructure and resource allocation of the tourism market, and establish the cooperation mechanism between urban clusters, in order to enhance the overall resilience of urban clusters.
表1 旅游经济韧性指标体系Table 1 Evaluation index system of tourism resilience |
| A目标层 | B准则层 | C指标层 | D计算方法 |
|---|---|---|---|
旅游经济韧性 | 供给韧性 | 旅游业贡献率/% | 地区旅游经济收入/GDP |
| 星级饭店数量/个 | — | ||
| 住宿餐饮行业从业人员占比/% | 地区住宿餐饮行业从业人员数量/就业人员总量 | ||
| 文化娱乐行业从业人员占比/% | 地区文化娱乐行业从业人员数量/就业人员总量 | ||
| 夜间灯光强度/(Lm/m2) | — | ||
| 需求韧性 | 旅游人次规模/千人 | — | |
| 旅游消费水平/元 | 地区旅游经济收入/地区旅游人次 | ||
| 旅游收入/百万元 | — | ||
| 人口密度/(人/km2) | — | ||
| 人均社会消费品零售额/元 | 地区社会消费品零售总额/地区总人口 | ||
| 结构韧性 | 产业结构合理化指数/% | 地区第三产业产值/第二产业产值 | |
| 资金配置效率/% | 地区金融机构贷款余额/金融机构存款余额 | ||
| 数字化产业从业人员占比/% | 地区数字化产业从业人员数量/就业人员总量 | ||
| 绿色创新专利占比/% | 地区绿色创新专利数量/创新专利总量 | ||
| 互联网普及率/% | 地区互联网宽带接入用户数/总人口 | ||
| 管理韧性 | 固定资产投资总额/百万元 | — | |
| 环境规制强度/% | 地区政府报告环境相关词频/报告总词频 | ||
| 政府干预水平/% | 地区财政支出/GDP | ||
| 社保就业支出/百万元 | — | ||
| 旅游产业关注度/% | 地区政府报告旅游相关词频/报告总词频 |
表2 中国城市群旅游经济韧性等级统计Table 2 Statistics of tourism resilience in urban agglomerations |
| 城市群 | 年份 | 综合等级 | |||||
|---|---|---|---|---|---|---|---|
| 2010 | 2012 | 2014 | 2016 | 2018 | 2020 | ||
| 京津冀 | IV | IV | V | V | V | IV | V |
| 辽中南 | III | III | IV | III | IV | III | IV |
| 长三角 | IV | V | V | V | V | IV | V |
| 粤闽浙 | IV | IV | V | V | V | IV | V |
| 长江中游 | III | II | III | IV | IV | IV | III |
| 山东半岛 | III | IV | IV | IV | V | III | IV |
| 中原 | III | III | IV | IV | IV | III | IV |
| 珠三角 | V | V | V | V | V | IV | V |
| 成渝 | II | III | III | IV | IV | IV | IV |
| 关中 | II | II | III | III | IV | IV | III |
| 哈长 | II | II | III | III | IV | III | III |
| 北部湾 | II | III | III | IV | IV | III | III |
| 晋中 | II | II | III | III | IV | IV | III |
| 呼包鄂榆 | II | III | IV | IV | V | IV | IV |
| 滇中 | II | II | III | IV | IV | IV | III |
| 黔中 | II | III | IV | IV | V | III | IV |
| 兰西 | I | II | II | III | IV | III | III |
| 宁夏沿黄 | I | II | III | III | III | III | III |
| 天山北坡 | III | III | III | IV | V | III | IV |
注:I、II、III、IV、V分别表示低韧性、较低韧性、中级韧性、较高韧性、高韧性等级。 |
表3 中国城市群整体旅游经济韧性的准则层阻力要素统计Table 3 Overall obstacles record of tourism resilience in urban agglomerations |
| 年份 | 供给韧性 | 需求韧性 | 结构韧性 | 管理韧性 |
|---|---|---|---|---|
| 2010 | 0.278 | 0.263 | 0.198 | 0.261 |
| 2011 | 0.280 | 0.262 | 0.199 | 0.259 |
| 2012 | 0.281 | 0.261 | 0.200 | 0.259 |
| 2013 | 0.281 | 0.261 | 0.199 | 0.259 |
| 2014 | 0.281 | 0.262 | 0.199 | 0.258 |
| 2015 | 0.282 | 0.261 | 0.199 | 0.258 |
| 2016 | 0.284 | 0.262 | 0.198 | 0.256 |
| 2017 | 0.286 | 0.261 | 0.197 | 0.256 |
| 2018 | 0.286 | 0.261 | 0.197 | 0.256 |
| 2019 | 0.284 | 0.257 | 0.196 | 0.263 |
| 2020 | 0.289 | 0.267 | 0.199 | 0.245 |
表4 中国城市群整体旅游经济韧性的指标层阻力要素统计Table 4 Obstacles record of tourism resilience in urban agglomerations |
| 年份 | X1 | X2 | X3 | X4 | X5 | X6 | X7 | X8 | X9 | X10 |
|---|---|---|---|---|---|---|---|---|---|---|
| 2010 | 0.065 | 0.049 | 0.052 | 0.067 | 0.046 | 0.075 | 0.034 | 0.040 | 0.091 | 0.023 |
| 2011 | 0.065 | 0.048 | 0.051 | 0.068 | 0.048 | 0.075 | 0.034 | 0.040 | 0.090 | 0.023 |
| 2012 | 0.065 | 0.048 | 0.051 | 0.068 | 0.048 | 0.074 | 0.034 | 0.040 | 0.090 | 0.023 |
| 2013 | 0.066 | 0.047 | 0.051 | 0.068 | 0.049 | 0.074 | 0.034 | 0.040 | 0.090 | 0.024 |
| 2014 | 0.067 | 0.047 | 0.050 | 0.069 | 0.049 | 0.074 | 0.034 | 0.040 | 0.090 | 0.023 |
| 2015 | 0.067 | 0.046 | 0.050 | 0.069 | 0.049 | 0.074 | 0.034 | 0.040 | 0.089 | 0.023 |
| 2016 | 0.068 | 0.046 | 0.051 | 0.070 | 0.049 | 0.075 | 0.034 | 0.041 | 0.089 | 0.023 |
| 2017 | 0.069 | 0.045 | 0.050 | 0.072 | 0.050 | 0.074 | 0.034 | 0.041 | 0.089 | 0.023 |
| 2018 | 0.069 | 0.045 | 0.050 | 0.072 | 0.050 | 0.074 | 0.034 | 0.041 | 0.089 | 0.023 |
| 2019 | 0.070 | 0.042 | 0.048 | 0.073 | 0.051 | 0.073 | 0.034 | 0.041 | 0.085 | 0.024 |
| 2020 | 0.070 | 0.051 | 0.060 | 0.069 | 0.039 | 0.076 | 0.035 | 0.042 | 0.094 | 0.019 |
| 年份 | X11 | X12 | X13 | X14 | X15 | X16 | X17 | X18 | X19 | X20 |
| 2010 | 0.033 | 0.033 | 0.063 | 0.051 | 0.018 | 0.063 | 0.020 | 0.054 | 0.084 | 0.039 |
| 2011 | 0.034 | 0.033 | 0.064 | 0.050 | 0.018 | 0.063 | 0.020 | 0.054 | 0.083 | 0.038 |
| 2012 | 0.034 | 0.033 | 0.064 | 0.051 | 0.019 | 0.062 | 0.021 | 0.054 | 0.083 | 0.038 |
| 2013 | 0.033 | 0.033 | 0.064 | 0.050 | 0.019 | 0.061 | 0.021 | 0.054 | 0.083 | 0.039 |
| 2014 | 0.033 | 0.032 | 0.065 | 0.050 | 0.018 | 0.061 | 0.018 | 0.055 | 0.084 | 0.040 |
| 2015 | 0.032 | 0.032 | 0.065 | 0.050 | 0.019 | 0.061 | 0.019 | 0.055 | 0.083 | 0.040 |
| 2016 | 0.032 | 0.033 | 0.065 | 0.050 | 0.018 | 0.061 | 0.019 | 0.054 | 0.084 | 0.037 |
| 2017 | 0.031 | 0.033 | 0.067 | 0.049 | 0.018 | 0.065 | 0.019 | 0.050 | 0.084 | 0.037 |
| 2018 | 0.031 | 0.033 | 0.067 | 0.049 | 0.018 | 0.065 | 0.019 | 0.050 | 0.084 | 0.037 |
| 2019 | 0.030 | 0.033 | 0.067 | 0.047 | 0.018 | 0.065 | 0.018 | 0.057 | 0.084 | 0.039 |
| 2020 | 0.029 | 0.035 | 0.064 | 0.052 | 0.019 | 0.059 | 0.017 | 0.054 | 0.080 | 0.036 |
| [1] |
孙九霞, 张凌媛, 罗意林. 共同富裕目标下中国乡村旅游资源开发: 现状、问题与发展路径. 自然资源学报, 2023, 38(2): 318-334.
[
|
| [2] |
郭为, 王静, 李承哲, 等. 不患寡而患不均乎: 发展旅游能促进共同富裕吗? 基于CFPS(2010—2018)数据的分析. 旅游学刊, 2022, 37(10): 12-25.
[
|
| [3] |
李柏文. 新时代旅游产业体系的特征与建设. 旅游学刊, 2018, 33(10): 7-9.
[
|
| [4] |
刘雨婧, 唐健雄. 长江经济带旅游业发展质量评价及其时空演变. 经济地理, 2022, 42(4): 209-219.
[
|
| [5] |
李强. 新冠肺炎疫情下的经济发展与应对: 基于韧性经济理论的分析. 财经科学, 2020, (4): 70-79.
[
|
| [6] |
刘颖洁, 王爽. 长江经济带养老产业与旅游产业耦合协调与经济增长的关系. 经济地理, 2022, 42(8): 123-131.
[
|
| [7] |
刘佳, 刘贤明, 安珂珂, 等. 长三角城市群旅游环境承载力时空分异格局与空间效应研究. 长江流域资源与环境, 2022, 31(7): 1441-1454.
[
|
| [8] |
张圆刚, 郝亚梦, 郭英之. 共同富裕视域下乡村旅游发展的区域不平衡性: 理论内涵、关键问题与指标体系. 自然资源学报, 2023, 38(2): 403-418.
[
|
| [9] |
|
| [10] |
朱媛媛, 罗源, 陈京, 等. 资源枯竭型城市产业转型及其经济韧性: 以湖北省大冶市为例. 自然资源学报, 2023, 38(1): 73-90.
[
|
| [11] |
|
| [12] |
|
| [13] |
|
| [14] |
孙晓, 刘力钢, 陈金. 东北三省旅游经济质量的区域差异、动态演进及影响因素. 地理科学, 2021, 41(5): 832-841.
[
|
| [15] |
杨懿, 刘小迪, 时蓓蓓. 旅游依赖型地区经济发展存在的问题及建议. 宏观经济管理, 2019, (3): 84-90.
[
|
| [16] |
|
| [17] |
|
| [18] |
|
| [19] |
|
| [20] |
|
| [21] |
|
| [22] |
|
| [23] |
聂长飞, 简新华. 中国高质量发展的测度及省际现状的分析比较. 数量经济技术经济研究, 2020, 37(2): 26-47.
[
|
| [24] |
郭亚军. 一种新的动态综合评价方法. 管理科学学报, 2002, (2): 49-54.
[
|
| [25] |
刘华军, 郭立祥, 乔列成, 等. 中国物流业效率的时空格局及动态演进. 数量经济技术经济研究, 2021, 38(5): 57-74.
[
|
| [26] |
文高辉, 袁泉, 赵懿, 等. 2007—2017年洞庭湖平原耕地生态安全评价及障碍因子诊断. 水土保持通报, 2021, 41(2): 178-187.
[
|
| [27] |
王立业, 师春春, 张文信, 等. 2009—2019年山东省耕地生态安全评价及障碍因子诊断. 水土保持研究, 2022, 29(6): 138-145.
[
|
| [28] |
|
| [29] |
|
| [30] |
|
| [31] |
|
| [32] |
|
| [33] |
|
/
| 〈 |
|
〉 |