
长三角碳排放空间关联网络结构特征及演化机制
|
俞洁(1997- ),男,浙江嘉兴人,硕士,研究方向为碳计量、碳排放空间治理、双碳路径规划。E-mail: yujie66926@163.com |
收稿日期: 2023-07-03
修回日期: 2023-09-26
网络出版日期: 2024-01-24
基金资助
浙江省软科学研究计划重点项目(2020C25033)
浙江省科技计划软科学重点项目(2020C25030)
浙江省大学生科研创新活动计划资助项目(2022R409B048)
Structural characteristics and evolutionary mechanism of spatial correlation network of carbon emissions in the Yangtze River Delta
Received date: 2023-07-03
Revised date: 2023-09-26
Online published: 2024-01-24
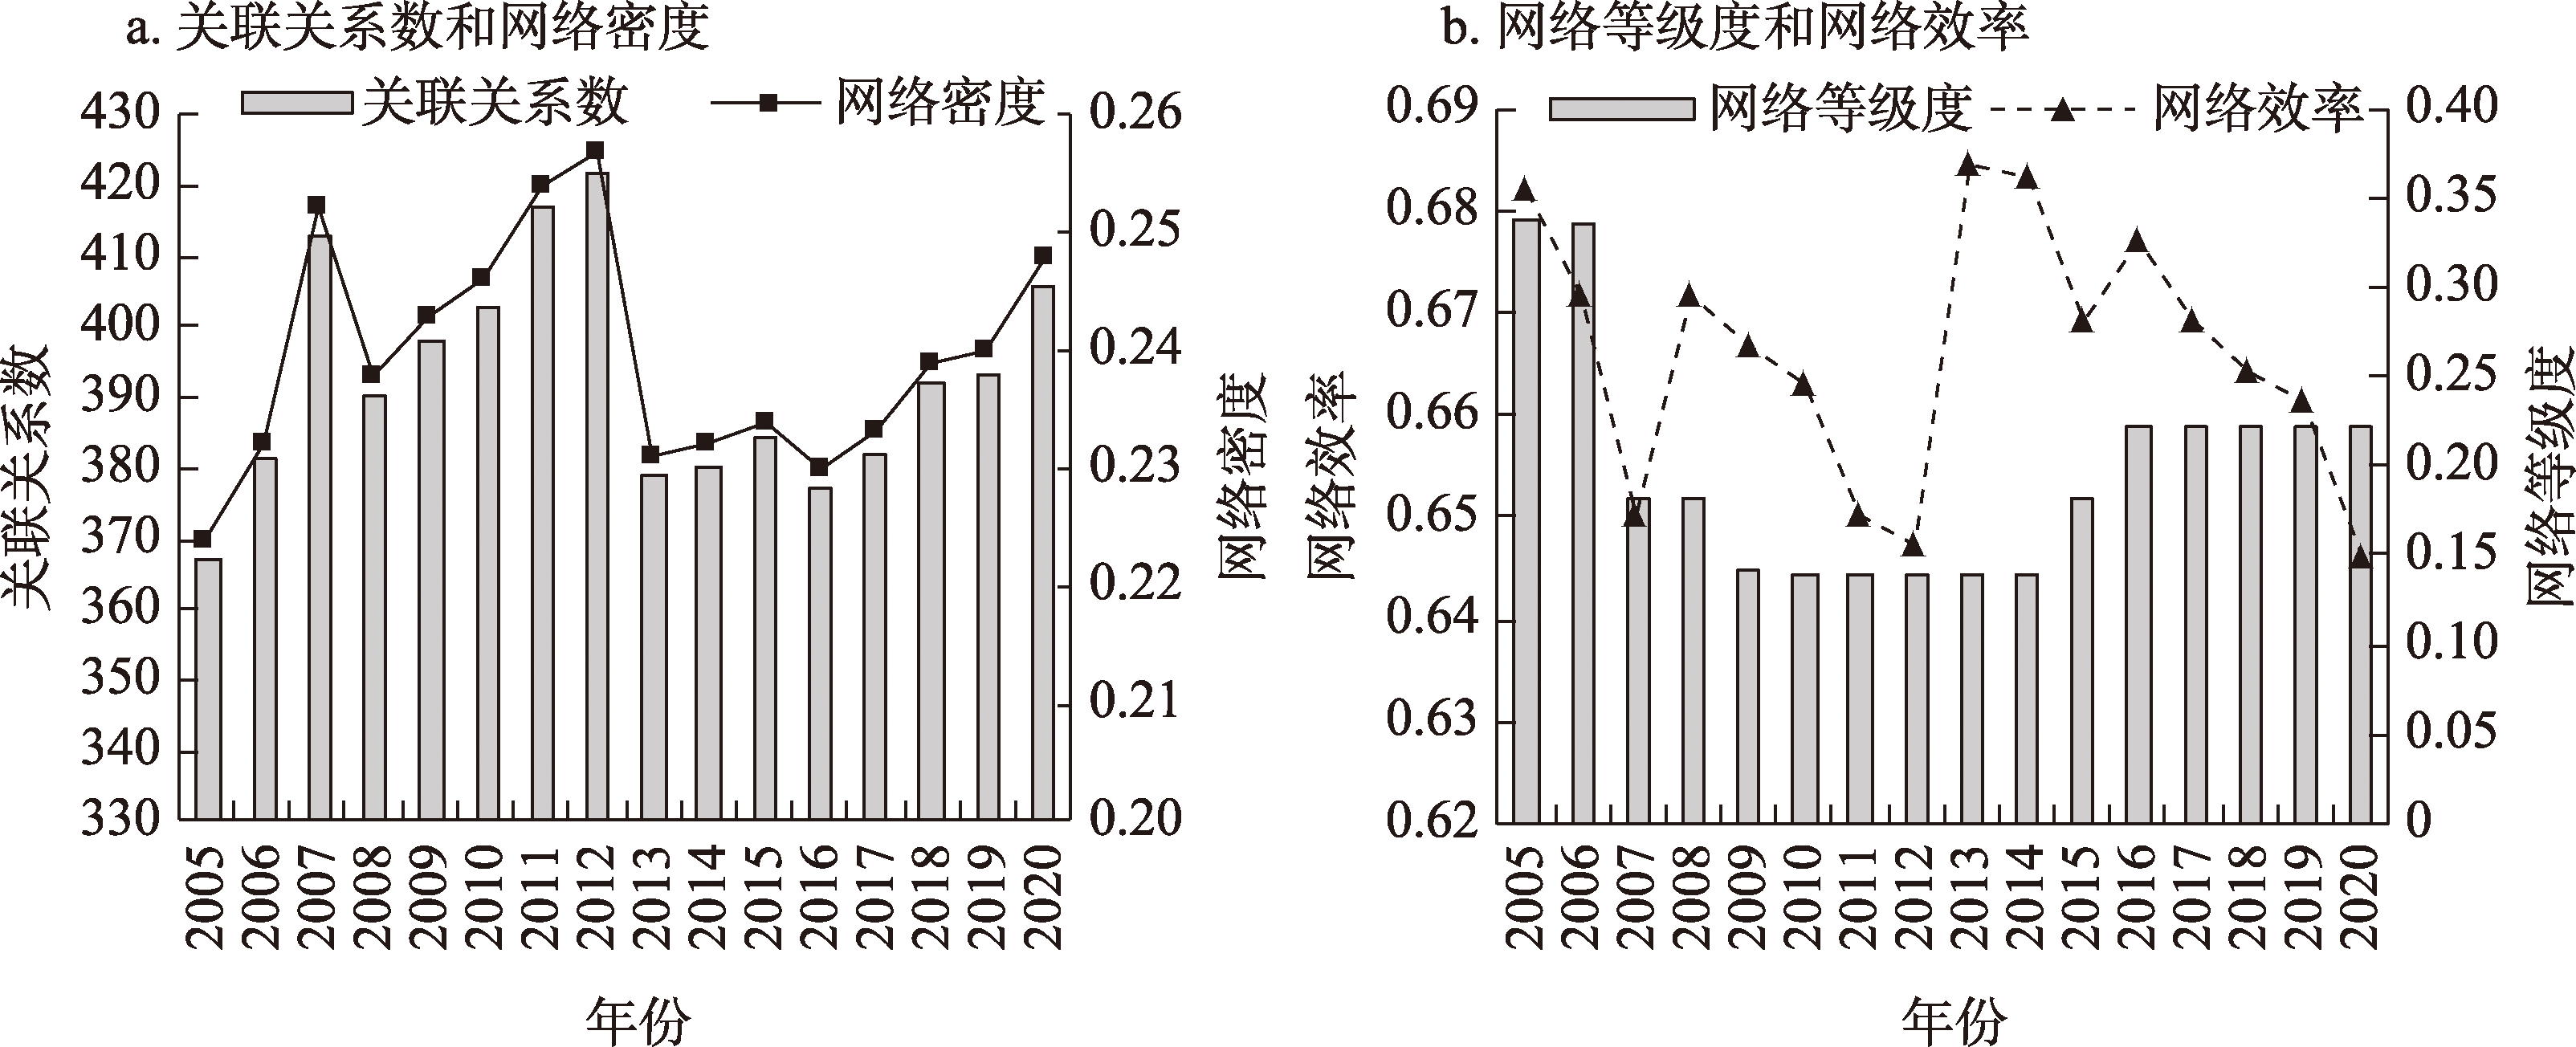
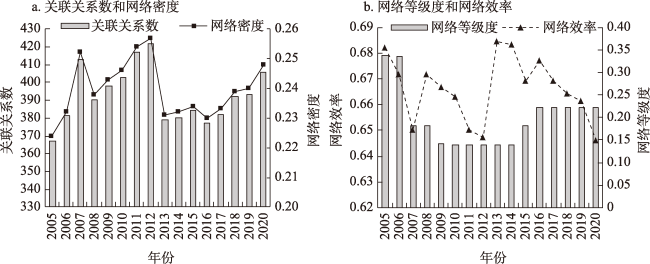
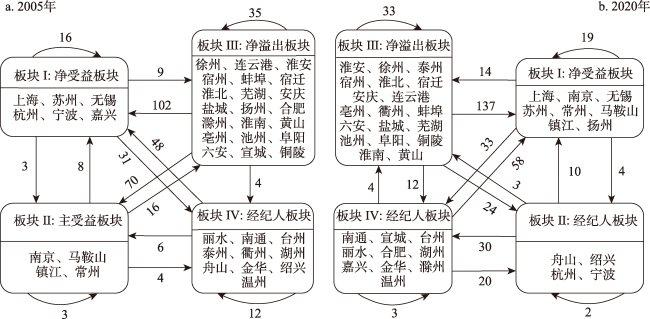
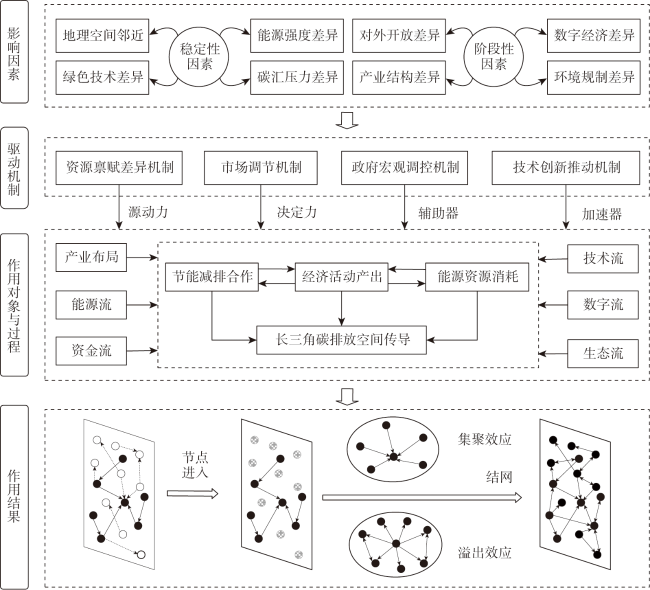
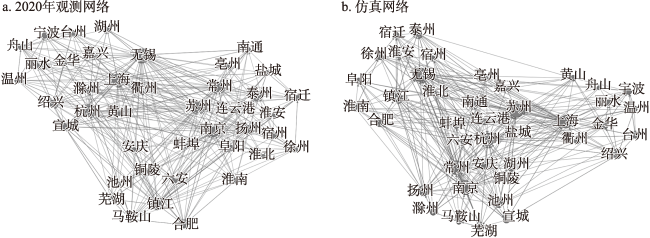
基于长三角41个城市数据,以引力模型构建长三角碳排放空间关联网络,利用社会网络分析方法和动态指数随机图模型(TERGM)识别网络的结构特征及演化机制。结果发现:(1)长三角碳排放空间关联日益密切,网络复杂性和稳定性日益提升,但仍存在较大合作潜力;(2)安徽和江苏北部城市构成净溢出板块,上海和江苏南部城市构成净受益板块,省际交界地带和浙江省内城市构成经纪人板块,板块间存在较多双向溢出渠道,且板块内存在“俱乐部”集聚现象;(3)“经纪人”连接结构和核心节点主导连接结构在网络演化中发挥了关键作用,网络演化由链式结构驱动向闭合式结构驱动发展,但城市间以邻为壑的发展策略阻碍了合作减排;(4)互惠性等内生结构有助于网络的形成,对外开放等行为者—关系能力则需通过市场调节等四种机制来促进网络演化,该网络的演化兼具路径依赖和路径创造特征。
俞洁 , 张勇 , 李清瑶 . 长三角碳排放空间关联网络结构特征及演化机制[J]. 自然资源学报, 2024 , 39(2) : 372 -391 . DOI: 10.31497/zrzyxb.20240209
Based on the data of 41 cities in the Yangtze River Delta (YRD), the gravity model is used to construct a spatial correlation network of carbon emissions. Social network analysis methods and the Temporal Exponential Random Graph Model (TERGM) are used to identify the structural characteristics and evolution mechanisms of the network. The findings are as follows: (1) The spatial association of carbon emissions in the YRD is becoming increasingly close, with enhanced network complexity and stability, yet the relatively low network density indicates significant potential for future cooperation. (2) Cities in Anhui and Northern Jiangsu constitute the net overflow plate, while Shanghai and cities in Southern Jiangsu form the net benefit plate. The interprovincial border areas and cities within Zhejiang constitute the broker plate. There are multiple bidirectional spillover channels among these plates, with evidence of "club" clustering within each plate. (3) The "broker" connectivity structure and the dominant connectivity structure of core nodes have played a crucial role in the evolution of the spatial correlation network of carbon emissions in the study area. The network evolution has transitioned from a chain-like structure driven development to a closed-loop structure driven development. However, the non-cooperative game strategy of prioritizing self-interest among cities has diminished the potential for cooperative emission reduction. (4) The endogenous structures of reciprocity, connectivity, and circularity contribute to the formation of the spatial correlation network of carbon emissions in the YRD region. The abilities of actors, such as external openness, industrial structure, green technological innovation, digital economic development, energy intensity, environmental regulations, and carbon sink pressure, require the mechanisms of resource endowment differentiation, market regulation, government macro-control, and technological innovation promotion to facilitate network evolution. The evolution of this network exhibits characteristics of both path dependence and path creation.
表1 空间关联网络板块分类标准Table 1 Classification standards for spatial association network blocks |
| 板块实际内部关系比例 (板块对内溢出关系数与总溢出关系数之比) | 板块接收关系比例 (板块接收板块外关系数与对外溢出关系数之比) | |
|---|---|---|
| ≈0 | >0 | |
| ≥(gk-1)/(G-1) | 双向溢出板块 | 净受益板块/主受益板块 |
| <(gk-1)/(G-1) | 净溢出板块 | 经纪人板块 |
注:gk表示板块中的成员个数(个),G表示网络中的成员总数(个),(gk-1)/(G-1) 表示期望内部关系比例。 |
表2 主要变量及其含义Table 2 Main variables and their meanings |
| 变量 | 格局 | 描述 | |
|---|---|---|---|
| 结构依 赖效应 | 边数(edges) | 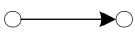 | 网络密度的间接反映,是关系形成的基准倾向 |
| 互惠性(mutual) |  | 彼此交互发出关联关系,形成互惠关系的倾向 | |
| 连通性(twopath) |  | 测度i→j且j→k类型的内生网络结构变量对网络形成的影响 | |
| 循环性(ctriple) | 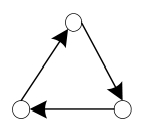 | 测度i→j、j→k且k→i类型的内生网络结构变量对网络形成的影响 | |
| 时间依 赖效应 | 稳定性(stability) | 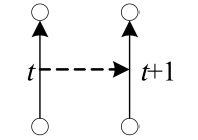 | t期整体网络格局在t+1期保持稳定的趋势 |
| 变异性(variability) |  | t期的整体网络格局在t+1期发生变异的趋势,即关系的新增或消失 | |
| 行为者— 关系效应 | 发送者效应(nodeocov) |  | 测度节点城市的某个属性(m)对城市间碳排放发出关系的影响 |
| 接收者效应(nodeicov) |  | 测度节点城市的某个属性(m)对城市间碳排放接收关系的影响 | |
| 异配性(absdiff) |  | 测度节点城市间某个属性(m)的差异对网络形成的影响 | |
| 网络嵌 入效应 | 协网络(edgecov) |  | 测度某个外部环境因素(n)对网络形成的影响 |
表3 行为者—关系效应解释变量Table 3 Explanatory variables of actor-relation effects |
| 变量 | 影响路径 | 衡量方式 |
|---|---|---|
| 对外开放(FDI) | 污染天堂[35]:对外开放→高碳产业转移→邻近地区碳排放增长→碳关联 污染光环[36]:对外开放→技术溢出→抑制区域间碳排放→碳关联 | 当年实际使用外资金额占GDP比例 |
| 产业结构(sind) | 产业结构差异→区域间产业转移[20]/贸易活动[26]→碳关联 | 工业增加值占GDP比例 |
| 绿色技术创新(ln_tech) | 绿色技术创新合作→碳排放联控→空间溢出效应[37]→碳关联 | 绿色专利产出数量,参考文献 [38] |
| 数字经济发展(digital) | 数字化→强化要素流动和环境治理联系→降低本地和邻地碳排放[39]→碳关联 | 主成分分析法,参考文献 [40] |
| 能源强度(energy) | 碳排放强度不均衡[41]→区域协调发展措施→节能减排合作→碳关联 | 夜间灯光数据模拟测度,参考文献 [42] |
| 环境规制(reg) | 环境规制差异→污染企业转向低环境规制地区排污[43]→碳关联 | 熵值法,参考文献 [44] |
| 碳汇压力(sink) | 碳汇空间分布→地区碳排放压力→高碳产业转移到碳汇丰富地区→碳关联 碳汇交易→高碳排放地区向碳汇丰富地区进行自愿减排→碳关联 | 单位建成区面积承载的植被碳固存量的倒数,参考文献[45] |
表4 长三角碳排放空间关联板块溢出效应Table 4 Spillover effects of the spatial correlation network of carbon emissions in the Yangtze River Delta |
| 板块类型 | 2005年 | 2020年 | ||||||||
|---|---|---|---|---|---|---|---|---|---|---|
| 板块Ⅰ | 板块Ⅱ | 板块Ⅲ | 板块Ⅳ | 板块Ⅰ | 板块Ⅱ | 板块Ⅲ | 板块Ⅳ | |||
| 总溢出关系个数/个 | 板块内部 | 16 | 3 | 35 | 12 | 19 | 2 | 33 | 3 | |
| 板块外部 | 43 | 28 | 176 | 54 | 51 | 43 | 173 | 82 | ||
| 总接收关系个数/个 | 板块内部 | 16 | 3 | 35 | 12 | 19 | 2 | 33 | 3 | |
| 板块外部 | 158 | 79 | 25 | 39 | 205 | 48 | 21 | 75 | ||
| 期望内部关系比例/% | 12.50 | 7.50 | 50.00 | 22.50 | 17.50 | 7.50 | 45.00 | 22.50 | ||
| 实际内部关系比例/% | 27.12 | 9.68 | 16.59 | 18.18 | 27.14 | 4.44 | 16.02 | 3.53 | ||
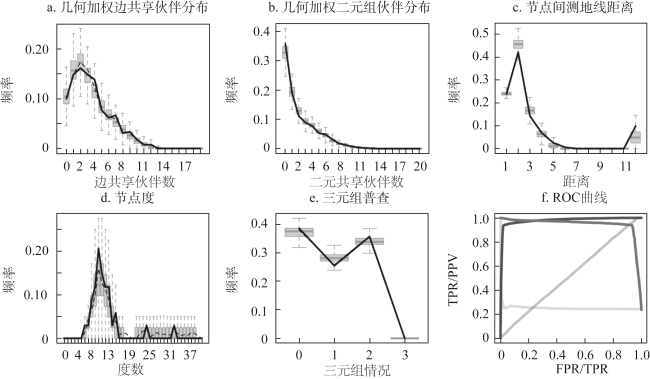
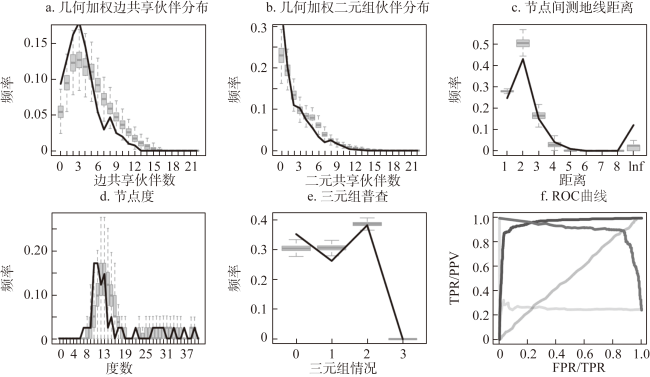
表5 2005—2020年长三角碳排放空间关联网络模体分析Table 5 Analysis of motif in the spatial correlation network of carbon emissions in the Yangtze River Delta from 2005 to 2020 |
| 结构 | 2005年 | 2010年 | 2015年 | 2019年 | 2020年 | ||||||||||||||
|---|---|---|---|---|---|---|---|---|---|---|---|---|---|---|---|---|---|---|---|
| 编号 | 模体 | 频次/% | 编号 | 模体 | 频次/% | 编号 | 模体 | 频次/% | 编号 | 模体 | 频次/% | 编号 | 模体 | 频次/% | |||||
| 三元结构 | 164 |  | 28.05 | 164 |  | 29.07 | 164 |  | 27.08 | 166 |  | 7.22 | 6 |  | 9.67 | ||||
| 6 |  | 8.11 | 6 |  | 7.89 | 166 |  | 5.64 | 46 |  | 2.60 | 14 |  | 5.46 | |||||
| 46 |  | 2.63 | 46 |  | 3.66 | 46 |  | 3.00 | 238 |  | 1.35 | 12 |  | 2.22 | |||||
| 12 |  | 2.03 | 12 |  | 1.47 | 238 |  | 1.02 | 12 |  | 0.58 | 238 |  | 1.04 | |||||
| 238 |  | 0.80 | 238 |  | 0.95 | 12 |  | 0.37 | / | / | / | / | / | / | |||||
| 四元结构 | 18568 |  | 19.76 | 18568 |  | 17.06 | 18568 |  | 19.28 | 18636 |  | 4.01 | 2184 |  | 16.68 | ||||
| 4380 |  | 6.32 | 4380 |  | 6.78 | 2202 |  | 3.82 | 2202 |  | 3.51 | 204 |  | 4.30 | |||||
| 204 |  | 3.81 | 2202 |  | 3.61 | 18636 |  | 3.13 | 588 |  | 2.75 | 2202 |  | 3.04 | |||||
| 588 |  | 3.13 | 588 |  | 3.38 | 588 |  | 2.65 | 27340 |  | 1.61 | 588 |  | 2.78 | |||||
| 2202 |  | 2.78 | 204 |  | 2.27 | 18518 |  | 1.43 | 18518 |  | 1.20 | 18636 |  | 2.46 | |||||
表6 长三角碳排放空间关联网络的TERGM实证结果Table 6 Empirical results of the TERGM for the spatial correlation network of carbon emissions in the Yangtze River Delta |
| 变量 | 模型1 | 模型2 | 模型3 | 模型4 | |
|---|---|---|---|---|---|
| 结构依赖性 | edges | 8.08*[8.08; 6.46] | 5.15*[5.11; 3.60] | 7.16*[7.23; 5.71] | 3.09*[3.28; 0.19] |
| mutual | 3.03*[3.04; 2.87] | 3.42*[3.43; 3.27] | 2.62*[2.58; 2.10] | ||
| twopath | -0.00*[-0.01; -0.02] | -0.01*[-0.02; -0.04] | |||
| ctriple | -0.46*[-0.46; -0.51] | -0.32*[-0.32; -0.41] | |||
| 时间依赖性 | stability | 2.65*[2.71; 2.27] | |||
| variability | -0.09*[-0.11; -0.23] | ||||
| 发送者属性 | FDI | -9.39*[-9.54; -11.12] | -7.93*[-8.19; -11.24] | -5.87*[-6.02; -7.79] | -5.76*[-6.20; -11.04] |
| sind | -1.70*[-1.69; -2.14] | -3.12*[-3.16; -3.59] | -2.49*[-2.53; -2.97] | -1.36*[-1.42; -2.32] | |
| ln_tech | -0.19*[-0.19; -0.27] | -0.45*[-0.45; -0.55] | -0.38*[-0.37; -0.48] | -0.16*[-0.12; -0.23] | |
| digital | -0.43*[-0.43; -0.56] | -0.48*[-0.49; -0.67] | -0.42*[-0.43; -0.53] | -0.06*[-0.09; -0.35] | |
| energy | -0.10*[-0.12; -0.66] | 0.11*[0.08; -0.43] | 0.26*[0.22; -0.28] | 0.35*[0.28; -0.42] | |
| reg | 0.08*[0.07; -0.16] | -0.15*[-0.14; -0.32] | 0.48*[0.48; 0.27] | 0.10*[0.08; -0.28] | |
| sink | -2.09*[-2.15; -2.72] | -1.94*[-1.96; -2.44] | -1.29*[-1.32; -1.78] | -0.34*[-0.34; -1.47] | |
| 接收者属性 | FDI | -5.14*[-5.09; -9.48] | -3.00*[-3.11; -8.55] | -2.90*[-2.90; -8.38] | -0.64*[-0.64; -7.19] |
| sind | 4.38*[4.44; 3.82] | 5.41*[5.50; 4.73] | 4.83*[4.91; 3.97] | 2.00*[1.87; -0.26] | |
| ln_tech | 0.35*[0.36; 0.25] | 0.56*[0.57; 0.43] | 0.51*[0.52; 0.39] | 0.48*[0.52; 0.28] | |
| digital | 0.05*[0.05; -0.16] | 0.10*[0.10; -0.17] | 0.14*[0.15; -0.12] | 0.03*[0.01; -0.38] | |
| energy | -0.96*[-0.97; -1.39] | -1.14*[-1.16; -1.53] | -1.23*[-1.27; -1.80] | -0.25*[-0.31; -1.55] | |
| reg | 0.50*[0.49; 0.30] | 0.47*[0.47; 0.34] | 0.81*[0.81; 0.62] | 0.26*[0.24; -0.23] | |
| sink | -1.28*[-1.34; -1.92] | -0.52*[-0.56; -1.09] | -0.24*[-0.30; -0.88] | 0.13*[0.03; -1.32] | |
| 异配性 | FDI | 0.28*[0.44; -3.65] | 0.61*[0.58; -2.66] | -1.50*[-1.41; -5.60] | -1.42*[-1.29; -7.36] |
| sind | 0.05*[0.12; -1.13] | -0.29*[-0.29; -1.26] | -0.44*[-0.40; -1.53] | 0.22*[0.43; -1.00] | |
| ln_tech | 0.42*[0.41; 0.30] | 0.23*[0.24; 0.16] | 0.21*[0.21; 0.12] | 0.10*[0.10; -0.01] | |
| digital | 0.61*[0.65; 0.45] | 0.54*[0.55; 0.40] | 0.45*[0.47; 0.36] | -0.04*[-0.01; -0.42] | |
| energy | 1.54*[1.56; 1.17] | 1.44*[1.46; 1.14] | 1.14*[1.17; 0.80] | 0.11*[0.16; -0.59] | |
| reg | 0.36*[0.36; 0.10] | 0.34*[0.33; 0.13] | 0.05*[0.05; -0.17] | 0.07*[0.09; -0.30] | |
| sink | 2.25*[2.26; 1.63] | 1.74*[1.74; 1.25] | 1.50*[1.50; 1.02] | 1.07*[1.09; -0.63] | |
| 协网络 | mat_dist | -2.25*[-2.27; -2.37] | -1.75*[-1.76; -1.85] | -2.06*[-2.08; -2.18] | -1.03*[-1.07; -1.47] |
| N/个 | 26240 | 26240 | 26240 | 24600 | |
注:*表示0不在置信区间,括号中的数字表示在置信水平5%的置信区间,下同。 |
表7 稳健性检验Table 7 Robustness test |
| 变量 | 模型5 | 模型6 | 模型7 | 模型8 | |
|---|---|---|---|---|---|
| 结构依赖性 | edges | 3.55*[4.30; 0.62] | 5.16*[4.88; -0.97] | 3.09*[3.36; 0.43] | 3.70*[3.88; 1.51] |
| mutual | 2.80*[2.75; 2.07] | 2.83*[2.78; 2.14] | 2.62*[2.56; 2.09] | 2.74*[2.69; 2.06] | |
| twopath | -0.01*[-0.02; -0.05] | -0.02*[-0.03; -0.04] | -0.01*[-0.02; -0.05] | -0.00*[-0.01; -0.04] | |
| ctriple | -0.36*[-0.35; -0.46] | -0.36*[-0.36; -0.48] | -0.32*[-0.32; -0.41] | -0.30*[-0.29; -0.35] | |
| 时间依赖性 | stability | 2.08*[2.16; 1.72] | 1.74*[1.80; 1.54] | 2.65*[2.72; 2.29] | 2.68*[ 2.76; 2.34] |
| variability | -0.35*[-0.38; -0.72] | -0.25*[-0.44; -1.15] | -0.09*[-0.11; -0.22] | -0.07*[-0.09; -0.21] | |
| 发送者属性 | FDI | -8.02*[-7.79; -11.41] | -5.66*[-6.38; -13.05] | -5.76*[-6.18; -11.20] | -5.63*[-6.13; -12.47] |
| sind | -1.86*[-1.91; -3.02] | -1.62*[-1.56; -2.29] | -1.36*[-1.41; -2.28] | -1.12*[-1.10; -1.79] | |
| ln_tech | -0.06*[-0.06; -0.25] | -0.21*[-0.11; -0.31] | -0.16*[-0.12; -0.23] | -0.22*[-0.19; -0.31] | |
| digital | -0.26*[-0.25; -0.49] | -0.12*[-0.13; -0.42] | -0.06*[-0.07; -0.33] | -0.01*[-0.02; -0.29] | |
| energy | 0.42*[0.02; -1.97] | 0.01*[-0.08; -1.04] | 0.35*[0.27; -0.45] | 0.22*[0.16; -0.56] | |
| reg | 0.14*[0.13; -0.46] | 0.26*[0.16; -0.20] | 0.10*[0.07; -0.28] | 0.15*[0.14; -0.21] | |
| sink | -0.05*[-0.10; -1.43] | -0.44*[-0.59; -2.09] | -0.34*[-0.38; -1.50] | -0.32*[-0.30; -1.30] | |
| 接收者属性 | FDI | -5.33*[-4.07; -8.51] | -3.40*[-3.54; -18.94] | -0.64*[-0.55; -7.49] | 1.04*[1.03; -2.21] |
| sind | 2.25*[1.98; -0.34] | 3.13*[3.22; 0.63] | 2.00*[1.87; -0.18] | 0.95*[0.77; -0.85] | |
| ln_tech | 0.63*[0.65; 0.38] | 0.43*[0.56; 0.28] | 0.48*[0.50; 0.26] | 0.50*[0.52; 0.30] | |
| digital | 0.07*[0.04; -0.48] | 0.13*[0.09; -0.45] | 0.03*[0.01; -0.41] | -0.11*[-0.14; -0.46] | |
| energy | 0.58*[0.13; -2.00] | -1.22*[-1.25; -2.55] | -0.25*[-0.35; -1.55] | -0.11*[-0.14; -1.00] | |
| reg | 0.19*[0.20; -0.33] | 0.49*[0.40; 0.06] | 0.26*[0.23; -0.24] | 0.31*[0.29; -0.09] | |
| sink | 0.90*[0.62; -0.22] | -0.29*[-0.61; -2.48] | 0.13*[0.02; -1.27] | 0.56*[0.54; -0.64] | |
| 异配性 | FDI | -0.79*[-0.93; -9.25] | -4.66*[-4.45; -12.59] | -1.42*[-1.07; -7.16] | -1.00*[-0.52; -9.31] |
| sind | 0.59*[0.66; -1.60] | -0.05*[0.47; -1.82] | 0.22*[0.46; -1.04] | -0.42*[-0.12; -1.85] | |
| ln_tech | 0.13*[0.11; -0.10] | 0.10*[0.12; -0.07] | 0.10*[0.10; -0.00] | 0.05*[0.05; -0.11] | |
| digital | 0.21*[0.25; -0.32] | -0.00*[0.04; -0.58] | -0.04*[-0.04; -0.44] | -0.01*[0.01; -0.29] | |
| energy | -0.10*[0.23; -0.75] | 0.49*[0.61; -0.26] | 0.11*[0.20; -0.54] | 0.31*[0.41; -0.70] | |
| reg | 0.06*[0.06; -0.36] | -0.10*[-0.07; -0.60] | 0.07*[0.09; -0.28] | 0.10*[0.11; -0.27] | |
| sink | 0.31*[0.36; -1.54] | 1.36*[1.50; -0.63] | 1.07*[ 1.17; -0.61] | 0.97*[1.01; -0.15] | |
| 协网络 | mat_dist | -1.31*[-1.34; -1.63] | -1.19*[-1.26; -1.73] | -1.03*[-1.07; -1.49] | -1.02*[-1.06; -1.40] |
| N/个 | 11480 | 8200 | 24600 | 24600 | |
| [1] |
高国力, 文扬, 王丽, 等. 基于碳排放影响因素的城市群碳达峰研究. 经济管理, 2023, 45(2): 39-58.
[
|
| [2] |
郑长德, 刘帅. 基于空间计量经济学的碳排放与经济增长分析. 中国人口·资源与环境, 2011, 21(5): 80-86.
[
|
| [3] |
|
| [4] |
刘华军, 邵明吉, 吉元梦. 中国碳排放的空间格局及分布动态演进: 基于县域碳排放数据的实证研究. 地理科学, 2021, 41(11): 1917-1924.
[
|
| [5] |
|
| [6] |
朱泳丽, 丁利杰. 长三角城市群碳排放强度的空间效应及影响因素: 基于产业转移视角. 资源科学, 2022, 44(7): 1373-1387.
[
|
| [7] |
邱立新, 徐海涛. 中国城市群碳排放时空演变及影响因素分析. 软科学, 2018, 32(1): 109-113.
[
|
| [8] |
|
| [9] |
韦彦汀, 李思佳, 张华. 成渝城市群碳排放时空特征及其影响因素. 中国环境科学, 2022, 42(10): 4807-4816.
[
|
| [10] |
陈占明, 吴施美, 马文博, 等. 中国地级以上城市二氧化碳排放的影响因素分析: 基于扩展的STIRPAT模型. 中国人口·资源与环境, 2018, 28(10): 45-54.
[
|
| [11] |
罗栋燊, 沈维萍, 胡雷. 城镇化、消费结构升级对碳排放的影响: 基于省级面板数据的分析. 统计与决策, 2022, 38(9): 89-93.
[
|
| [12] |
余娟娟, 龚同. 全球碳转移网络的解构与影响因素分析. 中国人口·资源与环境, 2020, 30(8): 21-30.
[
|
| [13] |
|
| [14] |
韩梦瑶, 刘卫东, 杨茗月. 低碳转型下中国高耗能行业的碳风险传导解析: 基于隐含碳关联网络视角. 地理研究, 2022, 41(1): 79-91.
[
|
| [15] |
|
| [16] |
张正峰, 张栋. 基于社会网络分析的京津冀地区碳排放空间关联与碳平衡分区. 中国环境科学, 2023, 43(4): 2057-2068.
[
|
| [17] |
李爱, 王雅楠, 李梦, 等. 碳排放的空间关联网络结构特征与影响因素研究: 以中国三大城市群为例. 环境科学与技术, 2021, 44(6): 186-193.
[
|
| [18] |
郑航, 叶阿忠. 空间关联网络结构特征的减排效应: 基于城市群视角. 环境科学, 2022, 43(10): 4401-4407.
[
|
| [19] |
张帅, 袁长伟, 赵小曼. 中国交通运输碳排放空间聚类与关联网络结构分析. 经济地理, 2019, 39(1): 122-129.
[
|
| [20] |
童磊, 王运鹏. 省域碳排放的空间网络结构特征与影响因素研究: 基于产业转移视角. 经济问题, 2020, (3): 18-24.
[
|
| [21] |
孙亚男, 刘华军, 刘传明, 等. 中国省际碳排放的空间关联性及其效应研究: 基于SNA的经验考察. 上海经济研究, 2016, (2): 82-92.
[
|
| [22] |
|
| [23] |
杨桂元, 吴齐, 涂洋. 中国省际碳排放的空间关联及其影响因素研究: 基于社会网络分析方法. 商业经济与管理, 2016, (4): 56-68, 78.
[
|
| [24] |
王晓平, 冯庆, 宋金昭. 成渝城市群碳排放空间关联结构演化及影响因素. 中国环境科学, 2020, 40(9): 4123-4134.
[
|
| [25] |
|
| [26] |
邵帅, 徐俐俐, 杨莉莉. 千里“碳缘”一线牵: 中国区域碳排放空间关联网络的结构特征与形成机制. 系统工程理论与实践, 2023, 43(4): 958-983.
[
|
| [27] |
刘华军, 何礼伟. 中国省际经济增长的空间关联网络结构: 基于非线性Granger因果检验方法的再考察. 财经研究, 2016, 42(2): 97-107.
[
|
| [28] |
邵海琴, 王兆峰. 中国交通碳排放效率的空间关联网络结构及其影响因素. 中国人口·资源与环境, 2021, 31(4): 32-41.
[
|
| [29] |
|
| [30] |
|
| [31] |
方大春, 王琳琳. 我国碳排放空间关联的网络特征及其影响因素研究. 长江流域资源与环境, 2023, 32(3): 571-581.
[
|
| [32] |
魏燕茹, 陈松林. 福建省土地利用碳排放空间关联性与碳平衡分区. 生态学报, 2021, 41(14): 5814-5824.
[
|
| [33] |
|
| [34] |
王悦, 张福琴, 史文秀. 区域创新产出空间异质性及关联网络分析. 科技进步与对策, 2019, 36(9): 43-50.
[
|
| [35] |
|
| [36] |
|
| [37] |
|
| [38] |
董直庆, 王辉. 环境规制的“本地—邻地”绿色技术进步效应. 中国工业经济, 2019, (1): 100-118.
[
|
| [39] |
常皓亮, 夏飞龙. 数字经济赋能低碳发展: 机制识别与空间溢出. 科技进步与对策, 2023, 40(10): 48-57.
[
|
| [40] |
赵涛, 张智, 梁上坤. 数字经济、创业活跃度与高质量发展: 来自中国城市的经验证据. 管理世界, 2020, 36(10): 65-76.
[
|
| [41] |
王青. 长三角都市圈工业能源消费碳排放强度区域差异及动态演进. 人民论坛·学术前沿, 2022, (22): 52-61.
[
|
| [42] |
史丹, 李少林. 排污权交易制度与能源利用效率: 对地级及以上城市的测度与实证. 中国工业经济, 2020, (9): 5-23.
[
|
| [43] |
张德钢, 陆远权. 中国碳排放的空间关联及其解释: 基于社会网络分析法. 软科学, 2017, 31(4): 15-18.
[
|
| [44] |
赵霄伟. 环境规制、环境规制竞争与地区工业经济增长: 基于空间Durbin面板模型的实证研究. 国际贸易问题, 2014, (7): 82-92.
[
|
| [45] |
李咏华, 高欣芸, 姚松, 等. 长三角城市群核心地区碳平衡压力与新型城镇化脱钩关系. 经济地理, 2022, 42(12): 72-81.
[
|
| [46] |
|
| [47] |
赵林, 曹乃刚, 韩增林, 等. 中国生态福利绩效空间关联网络演变特征与形成机制. 自然资源学报, 2022, 37(12): 3183-3200.
[
|
| [48] |
唐晓彬, 崔茂生. “一带一路”货物贸易网络结构动态变化及其影响机制. 财经研究, 2020, 46(7): 138-153.
[
|
| [49] |
刘林青, 闫小斐, 杨理斯, 等. 国际贸易依赖网络的演化及内生机制研究. 中国工业经济, 2021, (2): 98-116.
[
|
| [50] |
吉雪强, 张跃松. 长江经济带种植业碳排放效率空间关联网络结构及动因. 自然资源学报, 2023, 38(3): 675-693.
[
|
| [51] |
刘华军, 孙亚男, 陈明华. 雾霾污染的城市间动态关联及其成因研究. 中国人口·资源与环境, 2017, 27(3): 74-81.
[
|
| [52] |
蔡秀亭, 吕洁华, 王成齐. 中国森林生态安全空间关联的网络特征及其驱动机制. 自然资源学报, 2022, 37(8): 2137-2152.
[
|
| [53] |
吉雪强, 刘慧敏, 张跃松. 中国省际土地利用碳排放空间关联网络结构演化及驱动因素. 经济地理, 2023, 43(2): 190-200.
[
|
| [54] |
甘畅, 王凯. 中国省际服务业碳排放空间网络结构及其驱动因素. 环境科学研究, 2022, 35(10): 2264-2272.
[
|
/
| 〈 |
|
〉 |