
中国区域碳中和的技术溢出与能源回弹:机理、实证及启示
|
刘平阔(1989- ),男,内蒙古赤峰人,博士,副教授,硕士生导师,研究方向为能源转型与产业发展动力机制、能源数字化转型与优化决策。E-mail: pingoforever@sina.com |
收稿日期: 2023-06-12
修回日期: 2023-09-11
网络出版日期: 2023-12-12
基金资助
国家自然科学基金项目(72103128)
Technology spillover and energy rebound of carbon neutrality in eight regions of China: Theory, empirical analysis and enlightenment
Received date: 2023-06-12
Revised date: 2023-09-11
Online published: 2023-12-12
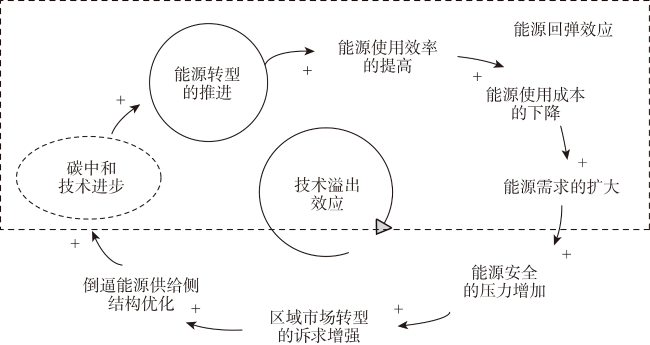
构建能源回弹的优化测算模型和影响因素评估模型,对2007—2022年全国整体以及八大综合经济区的能源回弹趋势进行分析。研究表明:(1)在碳中和情境中,区域短、长期能源回弹在考虑技术溢出的条件下均呈现“逆反效应”,而非传统意义上的“完全回弹”或“部分回弹”;(2)碳中和技术创新的节能降耗效果在区域层面会因能源需求增长被部分或全部抵消,且各区域能源回弹对技术溢出的敏感性存在明显差异,局部能源安全与能源转型的压力加剧;(3)相较于正向影响因素,产业结构、低碳化水平、碳排放绩效压力和劳动力基数等负向影响因素才是破除供给侧能源转型与能源安全长期压力的有效“抓手”,而环境治理可在一定程度上释放能源需求侧的转型压力。
关键词: 碳中和; 生产函数的重构与改进; 技术溢出效应; 能源回弹效应; 优化测算模型
刘平阔 , 桂俊卿 . 中国区域碳中和的技术溢出与能源回弹:机理、实证及启示[J]. 自然资源学报, 2023 , 38(12) : 3003 -3023 . DOI: 10.31497/zrzyxb.20231205
If the technology spillover in the carbon neutrality is ignored, the energy rebound effect will be measured in a seriously biased way, which is misleading the policy design and institutional arrangement for the energy transition & energy security. Hence at the regional level, there are two key issues need to be addressed: Will the energy transformation driven by carbon neutrality exacerbate the effect of such an "energy rebound"? How to correctly identify this "energy rebound" and scientifically analyze the externalities of technological innovation in the carbon neutrality process based on regional "technology spillovers"? Based on the logical structure and normative analysis on studying the relationship between energy rebound and technology spillover in terms of carbon neutrality, tentatively the production function is now being well reconstructed and optimized from multiple perspectives which include the production factors, the efficiency internalization, as well as the institutional performance. In our improved production function, the energy efficiency is internalized as an important factor, and the comprehensive performance (as the dependent variable) is composed of both the expected output and the unexpected output. The improved calculation model is explored for measuring the energy rebound, whilst the impact factor assessment model is built too. Then a dynamic comparative analysis of the energy rebound trend for both China and its eight comprehensive economic regions is conducted by using the panel data from 2007 to 2022. The results show that: (1) In the specific context of carbon neutrality, the regional short- and long-term energy rebound considering the technology spillovers is proven as a "Backfire Effect" rather than a "Full Rebound Effect" or a "Partial Rebound Effect". (2) The energy-saving and consumption-reducing effects of the technological innovations oriented by carbon neutrality are partially or fully offset by the energy demand growth at the regional level, and the sensitivity of energy rebound to technological spillovers varies significantly across regions, increasing the pressure on the local energy security and energy transformation. (3) Compared to the positive influences, those negative influences, such as industrial structure, decarbonization, carbon performance pressure and/or labor force base, are the effective tools to reduce the long-term energy consumption pressure on the energy transition & energy security oriented by carbon neutrality, and the environmental governance can partly release the transformation pressure on the energy consumption side. Thus, policy recommendations are proposed.
表1 能源回弹优化测算模型的变量描述性统计Table1 Descriptive statistics of variables in improved energy rebound calculation model |
| 统计指标 | 区域生产总值 GDP/亿元 | 区域环境治理成本 GoCo/亿元 | 区域资本存量 K/亿元 | 区域劳动力数量 L/万人 | 区域能源消费量 E/万tce |
|---|---|---|---|---|---|
| 均值 | 23747.6509 | 281.1353 | 45010.1257 | 2677.3420 | 14606.3202 |
| 中位数 | 17200.6650 | 207.3000 | 37259.7660 | 2213.0000 | 11721.0000 |
| 最小值 | 720.0600 | 10.6000 | 1925.4400 | 275.0000 | 1057.0000 |
| 最大值 | 129118.5800 | 2141.1000 | 186872.6900 | 7150.2500 | 47395.2000 |
| 标准差 | 21755.5698 | 252.0268 | 36433.0290 | 1732.6480 | 9098.5859 |
表2 影响因素评估模型选取变量的含义Table 2 The meaning of variables selected in the impact factor assessment model |
| 符号 | 名称 | 含义 | 类型 | |
|---|---|---|---|---|
| 被解释变量 | RE | 能源回弹效应 | 实际能源消费量与预期的回弹值 | 能源现象 |
| 解释变量 | TE | 碳中和技术创新 | 绿色专利数量 | 技术性因素 |
| 控制变量 | X1 | 产业结构 | 第二产业产值/GDP | 制度性因素 |
| X2 | 环境治理 | 环境污染治理投资 | 政策性因素 | |
| X3 | 能源消费低碳化 | 1/碳排放系数 | 结构性因素 | |
| X4 | 碳排放绩效压力 | 碳排放总量 | 社会性因素 | |
| X5 | 能源消费基数 | 能源消费总量(折标准煤) | 社会性因素 | |
| X6 | 劳动力基数 | 就业总人数 | 社会性因素 | |
| X7 | 国际技术转移 | 外商直接投资 | 技术性因素 |
表3 影响因素评估模型的变量描述性统计Table 3 Descriptive statistics of variables in the impact factor assessment model |
| 统计 指标 | RS/% | RL/% | TE/万件 | X1/% | X2/万亿 | X3/1 | X4/亿t | X5/亿tce | X6/亿人 | X7/万亿 |
|---|---|---|---|---|---|---|---|---|---|---|
| 均值 | 104.7290 | 109.4443 | 13.1934 | 42.5750 | 0.7683 | 45.4112 | 93.3513 | 42.4223 | 7.5772 | 1.2689 |
| 中位数 | 104.4417 | 108.8705 | 9.7158 | 41.9500 | 0.8662 | 46.2143 | 98.1680 | 43.1224 | 7.5943 | 1.3969 |
| 最小值 | 101.8500 | 103.6900 | 1.4500 | 37.8000 | 0.2800 | 40.7900 | 66.2400 | 31.1400 | 7.4700 | 0.7500 |
| 最大值 | 111.8000 | 123.5600 | 33.6100 | 47.0000 | 1.0600 | 50.6600 | 104.3500 | 52.4000 | 7.6300 | 1.6000 |
| 标准差 | 2.3925 | 4.7779 | 10.6526 | 3.4218 | 0.2365 | 2.9888 | 12.5458 | 6.7267 | 0.0559 | 0.2706 |
表4 能源回弹优化测算模型面板数据单位根检验的结果Table 4 Results of unity root test of panel data of improved energy rebound calculation model |
| 变量 | 检验方法 | ||||
|---|---|---|---|---|---|
| LLC | Ips | Fisher-ADF | Fisher-PP | ||
| 因变量 | lnY | -3.6782[0.0001] | -0.8220[0.2056] | 109.2846[0.0001] | 340.9255[0.0000] |
| ΔlnY | -6.9988[0.0000] | 41.4047[0.9510] | 191.9847[0.0000] | ||
| Δ2lnY | 444.3038[0.0000] | 878.2402[0.0000] | |||
| 自变量 | lnK | -12.1967[0.0000] | 0.4657[0.6793] | 450.9880[0.0000] | 1332.9507[0.0000] |
| ΔlnK | -2.2596[0.0119] | 40.7841[0.9580] | 29.4214[0.9994] | ||
| Δ2lnK | 219.9802[0.0000] | 324.2873[0.0000] | |||
| lnL | -26.1763[0.0000] | 3.9448[1.0000] | 57.5487[0.4920] | 46.6563[0.8572] | |
| ΔlnL | -6.9435[0.0000] | 118.1647[0.0000] | 190.0136[0.0000] | ||
| Δ2lnL | 328.6262[0.0000] | 823.0178[0.0000] | |||
| lnE | -3.6402[0.0001] | -0.6864[0.2462] | 78.8433[0.0357] | 123.8697[0.0000] | |
| ΔlnE | -8.2352[0.0000] | 73.3268[0.0846] | 147.3459[0.0000] | ||
| Δ2lnE | 219.1799[0.0000] | 681.5431[0.0000] | |||
注:Δ表示变量的一阶差分;方括号内为统计量的P值。 |
表5 能源回弹优化测算模型面板数据的协整检验结果Table 5 Cointegration test results of panel data of improved energy rebound calculation model |
| Test statistic | Dickey-Fuller critical value | |||
|---|---|---|---|---|
| 1% | 5% | 10% | ||
| Z(t) | -27.203 | -3.443 | -2.872 | -2.570 |
表6 影响因素评估模型稳健性检验结果Table 6 Results of the robustness test of impact factor assessment model |
| 变量 | 基准回归1 | 基准回归2 | 替换核心解释变量绿色实用新型专利授权数 | |
|---|---|---|---|---|
| 回归1 | 回归2 | |||
| TE | 0.4181978** | 0.8351783** | 0.0046164** | 0.0092193** |
| X1 | -1.044685** | -2.086323** | -0.111858** | -0.0223391** |
| X2 | 0.8300856 | 1.65776 | 0.0140388 | 0.0280367 |
| X3 | -7.161681*** | -14.30249*** | -0.0721027*** | -0.1439952*** |
| X4 | -2.536008*** | -5.064626*** | -0.025666*** | -0.0512571*** |
| X5 | 3.936543** | 7.861615** | 0.0398673** | 0.0796182** |
| X6 | -100.7552** | -201.2166** | -1.024511*** | -2.046036*** |
| X7 | 16.72649** | 33.40421** | 0.1735963** | 0.3466862** |
注:***和**分别表示在1%和5%的显著性水平下成立。 |
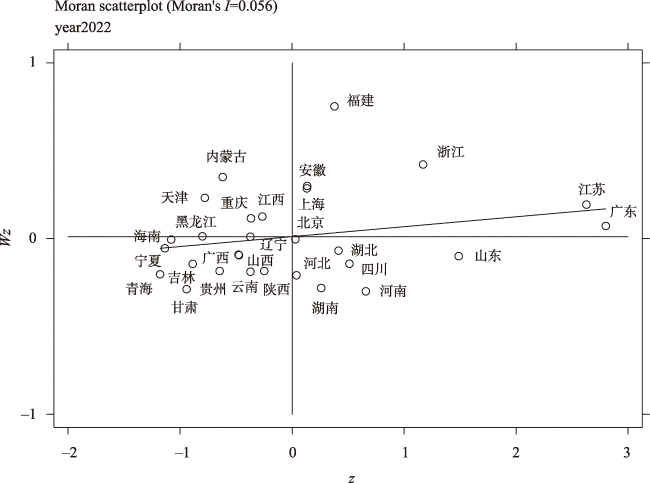
表7 制度绩效水平的莫兰指数Table 7 Moran's I of institutional performance level |
| 年份 | Moran's I | Z统计量 | P值 |
|---|---|---|---|
| 2007 | 0.005 | 1.682 | 0.046 |
| 2008 | 0.044 | 1.569 | 0.058 |
| 2009 | 0.049 | 1.650 | 0.049 |
| 2010 | 0.049 | 1.644 | 0.050 |
| 2011 | 0.044 | 1.561 | 0.059 |
| 2012 | 0.042 | 1.518 | 0.064 |
| 2013 | 0.042 | 1.515 | 0.065 |
| 2014 | 0.043 | 1.530 | 0.063 |
| 2015 | 0.043 | 1.543 | 0.061 |
| 2016 | 0.045 | 1.592 | 0.056 |
| 2017 | 0.048 | 1.645 | 0.050 |
| 2018 | 0.052 | 1.724 | 0.042 |
| 2019 | 0.052 | 1.709 | 0.044 |
| 2020 | 0.050 | 1.677 | 0.047 |
| 2021 | 0.053 | 1.747 | 0.040 |
| 2022 | 0.056 | 1.802 | 0.036 |
表8 能源回弹测算结果Table 8 Energy rebound calculation results (%) |
| 年份 | 短期能源回弹RS | 长期能源回弹RL | 年份 | 短期能源回弹RS | 长期能源回弹RL |
|---|---|---|---|---|---|
| 2007 | 104.3304 | 108.6482 | 2015 | 102.4734 | 104.9396 |
| 2008 | 101.8485 | 103.6915 | 2016 | 102.3907 | 104.7744 |
| 2009 | 106.8214 | 113.6228 | 2017 | 103.2022 | 106.3950 |
| 2010 | 104.7656 | 109.5172 | 2018 | 104.0795 | 108.1472 |
| 2011 | 104.8186 | 109.6232 | 2019 | 105.1630 | 110.3109 |
| 2012 | 104.0961 | 108.1803 | 2020 | 111.7980 | 123.5616 |
| 2013 | 104.5531 | 109.0929 | 2021 | 104.5543 | 109.0954 |
| 2014 | 103.3572 | 106.7047 | 2022 | 107.4127 | 114.8038 |
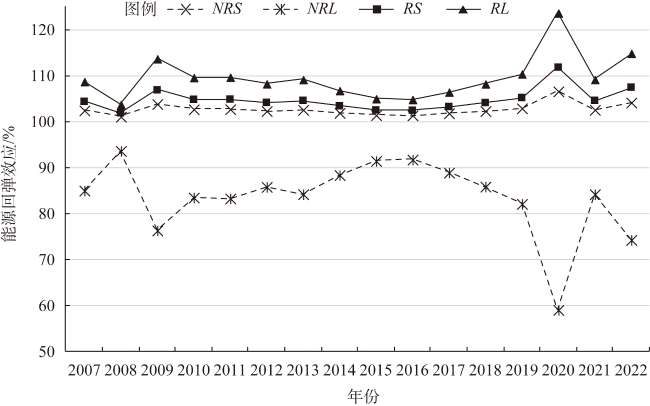
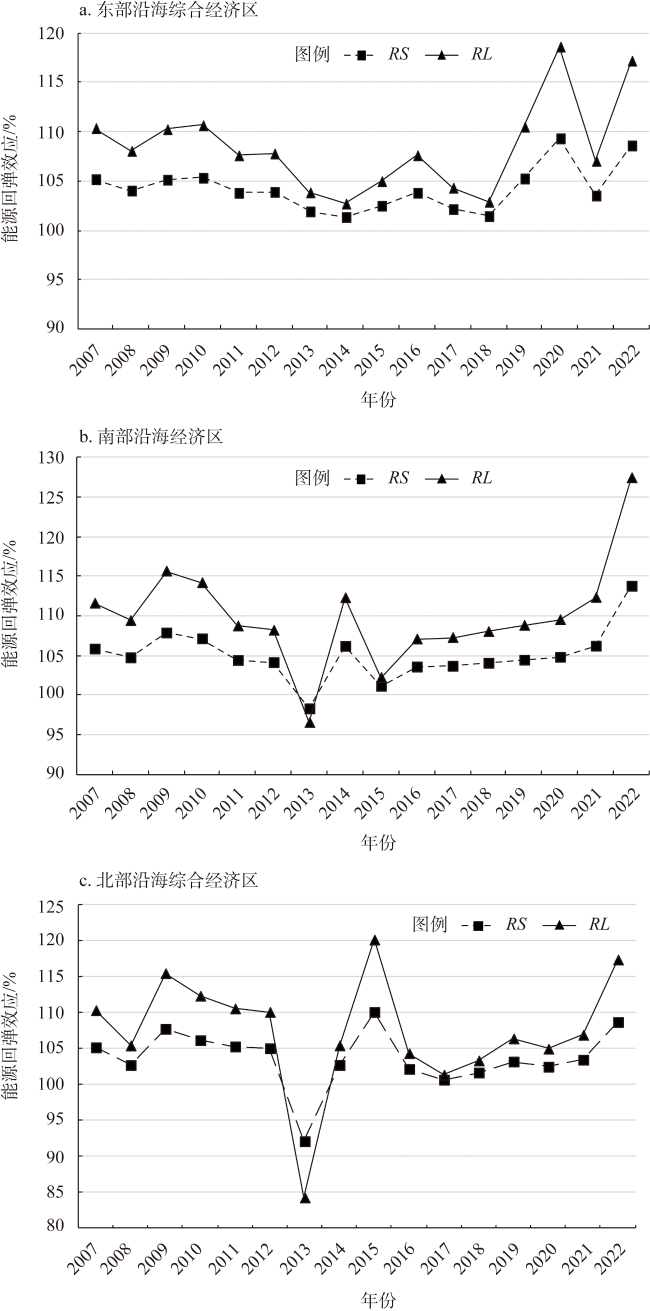
图5 经济发达地区能源回弹的时间趋势对比Fig. 5 Comparison of time trends of energy rebound in economically developed regions |
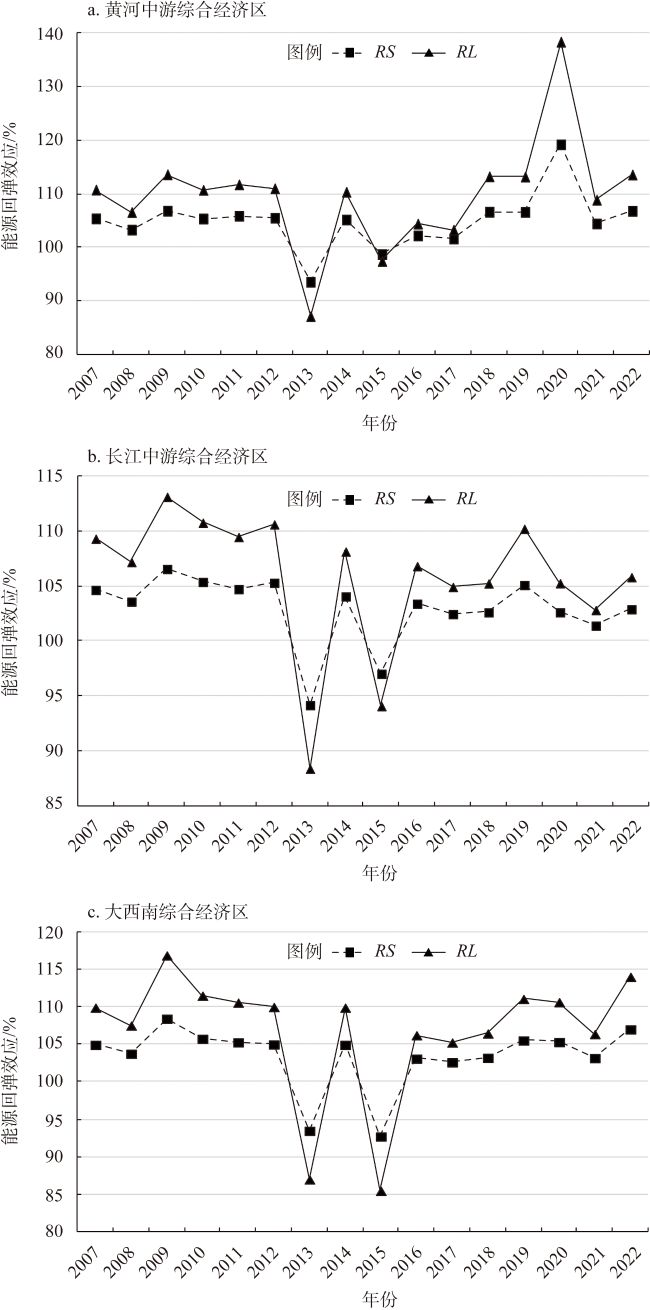
图6 经济过渡地区能源回弹的时间趋势对比Fig. 6 Comparison of time trends of energy rebound in economic transition regions |
表9 短期能源回弹的因素评估结果Table 9 Assessment results of factors for short-term energy rebound |
| RS | 系数 | P检验值 |
|---|---|---|
| TE | 0.4181978 | 0.015 |
| X1 | -1.044685 | 0.023 |
| X2 | 0.8300856 | 0.891 |
| X3 | -7.161681 | 0.004 |
| X4 | -2.536008 | 0.009 |
| X5 | 3.936543 | 0.023 |
| X6 | -100.7552 | 0.010 |
| X7 | 16.72649 | 0.035 |
表10 长期能源回弹的因素评估结果Table 10 Assessment results of factors for long-term energy rebound |
| RL | 系数 | P检验值 |
|---|---|---|
| TE | 0.8351783 | 0.015 |
| X1 | -2.086323 | 0.023 |
| X2 | 1.65776 | 0.891 |
| X3 | -14.30249 | 0.004 |
| X4 | -5.064626 | 0.009 |
| X5 | 7.861615 | 0.023 |
| X6 | -201.2166 | 0.010 |
| X7 | 33.40421 | 0.035 |
| [1] |
邓祥征, 蒋思坚, 刘冰, 等. 全球二氧化碳浓度非均匀分布条件下碳排放与升温关系的统计分析. 自然资源学报, 2021, 36(4): 934-947.
[
|
| [2] |
许光清, 张文丹, 刘海博. 中国居民能源消费的间接回弹效应分析及双碳目标下的政策启示. 自然资源学报, 2023, 38(3): 658-674.
[
|
| [3] |
田云, 林子娟. 巴黎协定下中国碳排放权省域分配及减排潜力评估研究. 自然资源学报, 2021, 36(4): 921-933.
[
|
| [4] |
范秋芳, 邢相飞. 可再生能源政策对碳排放的影响研究. 华东经济管理, 2022, 36(8): 63-73.
[
|
| [5] |
朱彤. 能源安全新风险与新逻辑: 系统韧性的视角: 兼论新逻辑下我国能源安全问题与战略思路. 技术经济, 2023, 42(2): 1-10.
[
|
| [6] |
邵帅, 杨莉莉, 黄涛. 能源回弹效应的理论模型与中国经验. 经济研究, 2013, 48(2): 96-109.
[
|
| [7] |
|
| [8] |
|
| [9] |
|
| [10] |
汪克亮, 赵斌, 许如玉. 创新要素流动对能源效率的影响. 统计研究, 2023, 40(4): 88-97.
[
|
| [11] |
|
| [12] |
|
| [13] |
|
| [14] |
|
| [15] |
|
| [16] |
|
| [17] |
范英, 衣博文. 能源转型的规律、驱动机制与中国路径. 管理世界, 2021, 37(8): 95-105.
[
|
| [18] |
|
| [19] |
周勇, 林源源. 技术进步对能源消费回报效应的估算. 经济学家, 2007, (2): 45-52.
[
|
| [20] |
冯烽, 叶阿忠. 技术溢出视角下技术进步对能源消费的回弹效应研究: 基于空间面板数据模型. 财经研究, 2012, 38(9): 123-133.
[
|
| [21] |
|
| [22] |
|
| [23] |
乐无穹. 中国分行业、分区域能源回弹效应实证研究. 上海: 复旦大学, 2014.
[
|
| [24] |
|
| [25] |
|
| [26] |
刘华军, 石印, 郭立祥, 等. 新时代的中国能源革命: 历程、成就与展望. 管理世界, 2022, 38(7): 6-24.
[
|
| [27] |
张希良, 黄晓丹, 张达, 等. 碳中和目标下的能源经济转型路径与政策研究. 管理世界, 2022, 38(1): 35-66.
[
|
| [28] |
陈诗一. 低碳经济. 经济研究, 2022, 57(6): 12-18.
[
|
| [29] |
刘元春, 郝大鹏, 霍晓霖. 碳中和经济学研究新进展. 经济学家, 2022, (6): 5-15.
[
|
| [30] |
|
| [31] |
|
| [32] |
刘维林, 程倩, 余泳泽. 双循环技术溢出视角下中国产业技术进步的网络效应研究: 基于全球生产网络下的全要素生产率增长与传导测算. 管理世界, 2023, 39(5): 38-59.
[
|
| [33] |
|
| [34] |
|
| [35] |
张乾志, 王文涛, 陈文颖. 欧盟及英国能源与气候政策及启示. 中国人口·资源与环境, 2023, 33(2): 81-91.
[
|
| [36] |
|
| [37] |
|
| [38] |
|
| [39] |
胡东兰, 申颢, 刘自敏. 中国城市能源回弹效应的时空演变与形成机制研究. 中国软科学, 2019, (11): 96-108.
[
|
| [40] |
邵帅, 李欣, 曹建华, 等. 中国雾霾污染治理的经济政策选择: 基于空间溢出效应的视角. 经济研究, 2016, 51(9): 73-88.
[
|
| [41] |
张济建, 万安位, 宋雅静. 能源回弹效应下高碳产业低碳转型过程中的技术突变性. 科技进步与对策, 2020, 37(18): 60-69.
[
|
| [42] |
|
| [43] |
刘平阔, 卢存禹. 中国能源转型路径选择的影响因素: 理论检验与实证分析. 中国软科学, 2022, (6): 51-61.
[
|
| [44] |
单豪杰. 中国资本存量K的再估算: 1952—2006年. 数量经济技术经济研究, 2008, 25(10): 17-31.
[
|
| [45] |
陈强. 高级计量经济学及Stata应用(第二版). 北京: 高等教育出版社, 2014: 644.
[
|
| [46] |
|
| [47] |
|
/
| 〈 |
|
〉 |