
国家和产业尺度下南海周边国家地缘经济关系演变与启示
|
马腾(1990- ),男,江西吉安人,博士,讲师,研究方向为全球化与地缘经济。E-mail: mateng0119@163.com |
收稿日期: 2023-05-04
修回日期: 2023-07-31
网络出版日期: 2023-11-06
基金资助
国家社会科学基金重大项目(20&ZD138)
教育部人文社会科学研究青年基金项目(22YJCZH126)
浙江省高校人文社科重大攻关青年重点项目(2023QN009)
Analysis and inspiration of geo-economic relations among nations surrounding the South China Sea on the national and industrial scales
Received date: 2023-05-04
Revised date: 2023-07-31
Online published: 2023-11-06
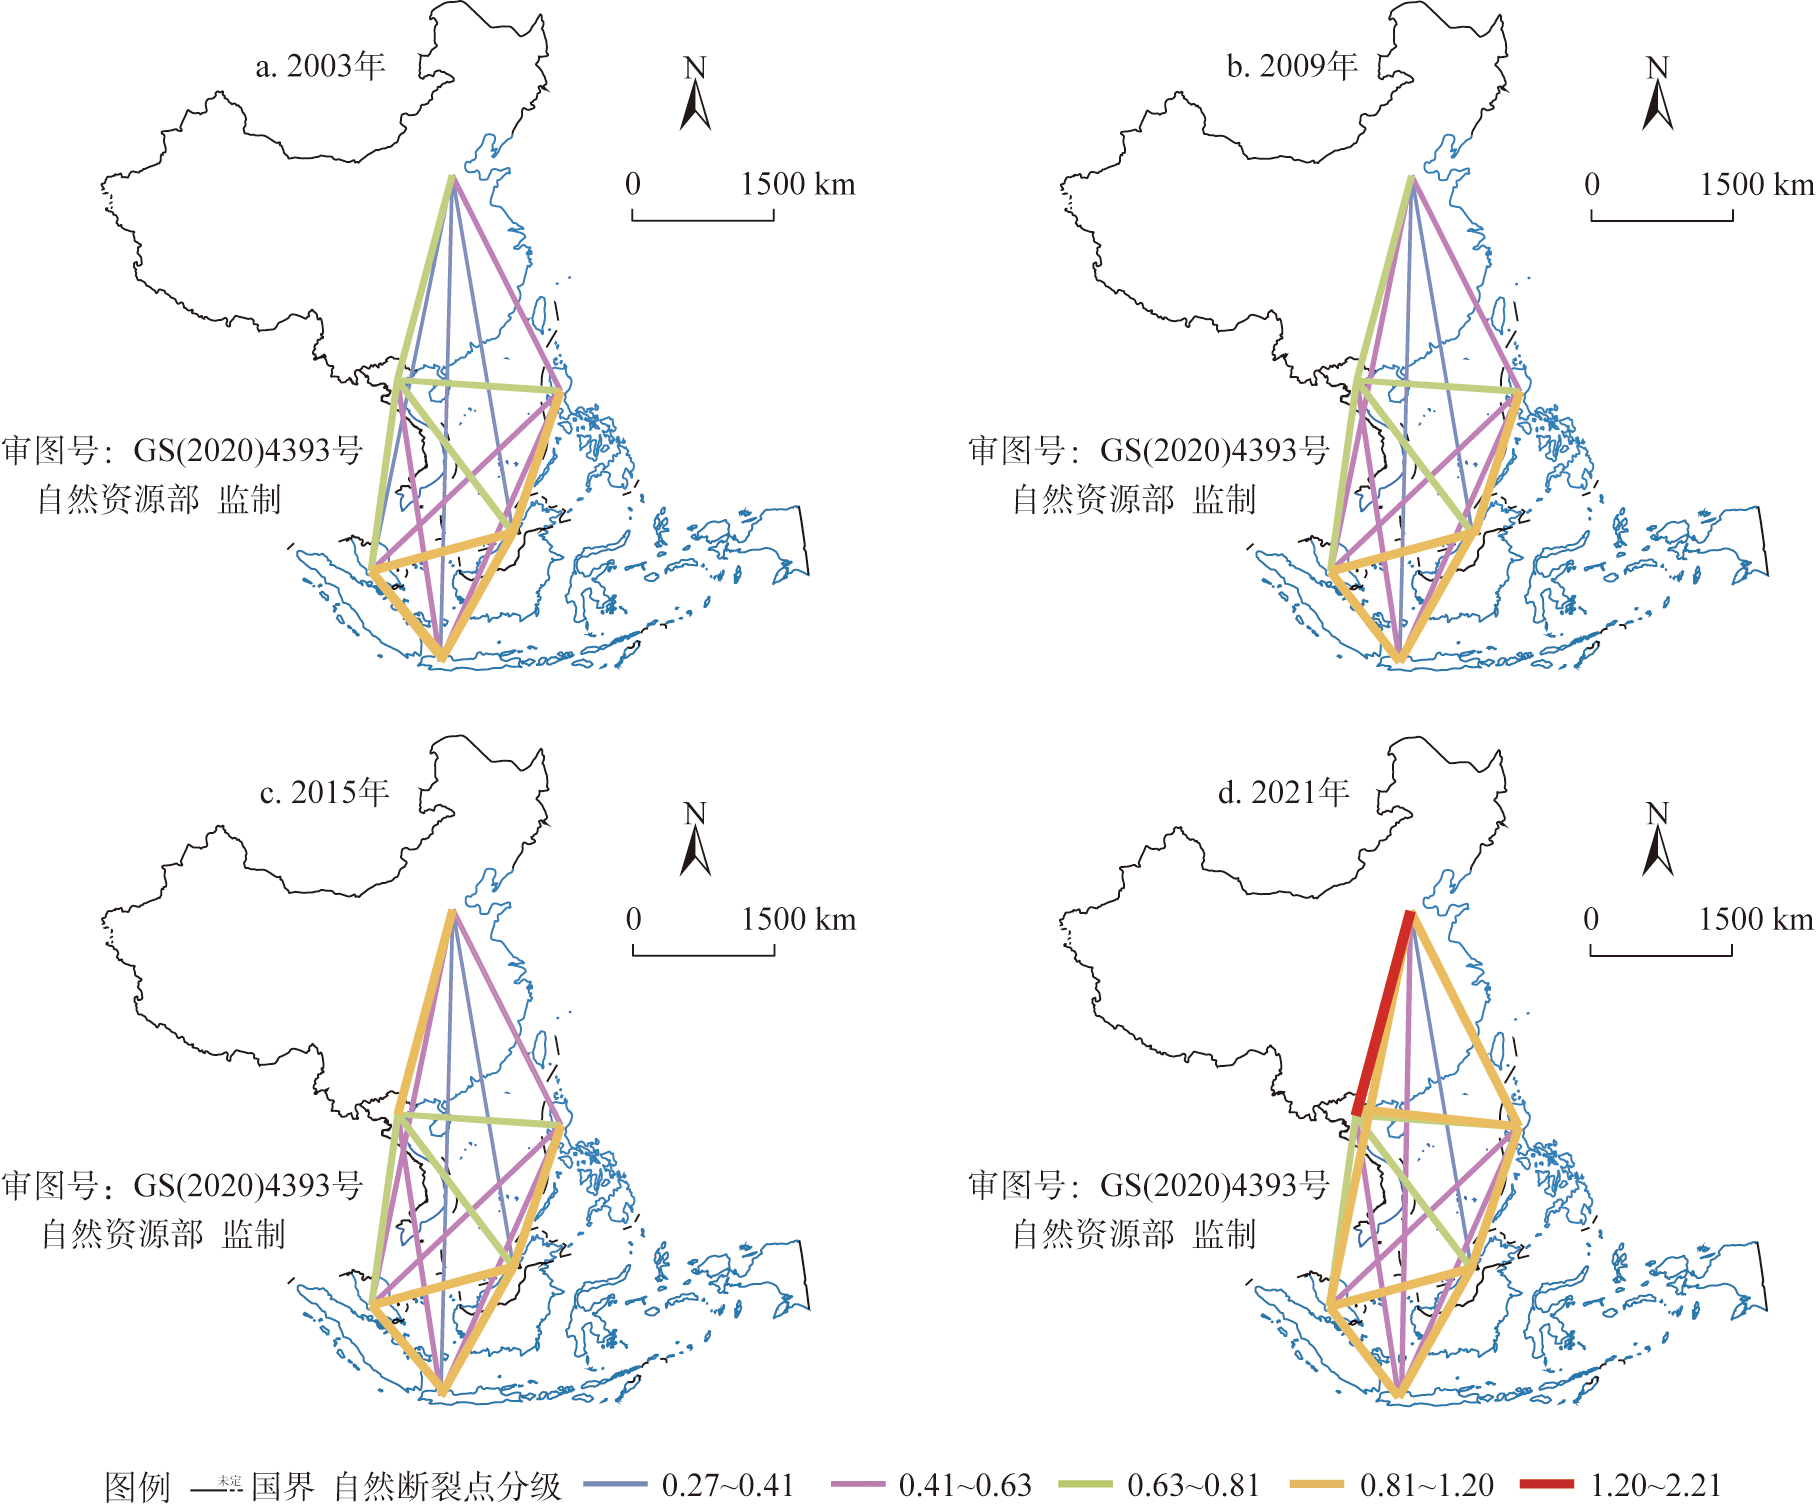
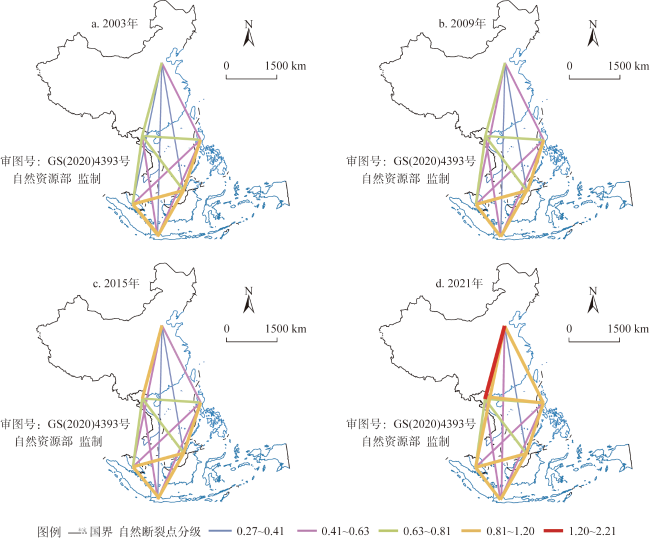
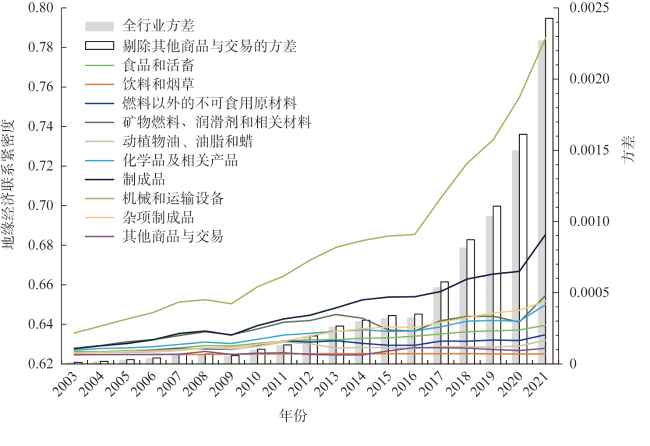
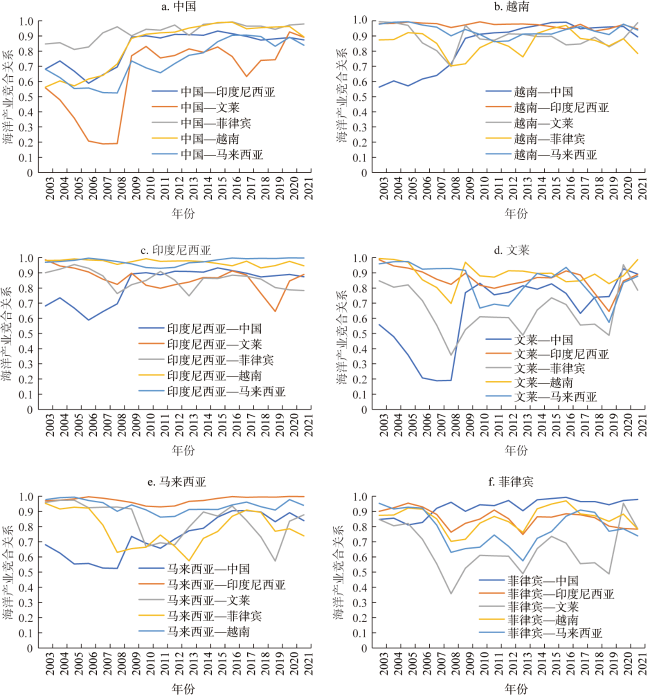
以南海周边国家为研究对象,采用国家间的贸易数据,基于地缘经济联系紧密度模型与产业结构相似系数模型,分析2003—2021年国家与产业尺度下地缘经济关系,讨论潜在的影响因素,结果表明:(1)地缘经济联系紧密度上,国家尺度呈上升趋势,核心区域由南向北转移;产业尺度整体呈上升趋势,不同行业的增速差异显著;海洋产业呈现南北东相互制衡的三核心局面。(2)产业竞合关系上,国家尺度呈现多极化发展趋势,国别差异明显;行业内竞合关系稳定,但行业间差距扩大;海洋产业国别差异显著,整体竞争大于合作。(3)空间因素、自然禀赋因素、文化因素和制度环境在不同的尺度与行业对地缘经济联系紧密度和产业竞合关系的影响存在明显差异。
马腾 , 李一杰 , 杜德斌 , 胡志丁 . 国家和产业尺度下南海周边国家地缘经济关系演变与启示[J]. 自然资源学报, 2023 , 38(11) : 2722 -2740 . DOI: 10.31497/zrzyxb.20231103
The analysis of geo-economic relations from an industrial scale provides valuable insights into comprehending the formation of the prevailing international industrial division of labor pattern and the distribution of interests among nations. Therefore, it becomes imperative to introduce a more microscopic industrial scale into geo-economic analysis to gain a deeper understanding of these dynamics. Taking the nations surrounding the South China Sea as the research object, using national trade data, based on the geo-economic tightness model and the industrial structure similarity coefficient model, this paper calculates the geo-economic connection tightness and industrial coopetition relationship on the national and industrial scales of the nations surrounding the South China Sea from 2003 to 2021, and uses the fixed-effect model to analyze the potential influencing factors. The results reveal several significant findings. Firstly, the overall geo-economic tightness among the nations surrounding the South China Sea exhibits an upward trend, accompanied by a gradual shift in the core area from the southern to the northern region. Within the context of the industrial scale, the tightness of geo-economic relations displays an overall growth trajectory; however, notable variations in growth rates are observed across different industries. Notably, the machinery and transport equipment industry experiences a substantially higher growth rate compared to other sectors. Moreover, the geo-economic tightness within the marine industry presents a three-core pattern, characterized by opposing dynamics between the northern, southern, and eastern regions. Secondly, the industrial competition and cooperation relationship between nations surrounding the South China Sea demonstrates a multipolar development trend, with significant disparities observed among nations. The coopetition relationships across various industries exhibit relative stability on the whole, lacking any evident trend towards competition or cooperation. Nevertheless, there exists an upward trend in the disparities among industries. Furthermore, the coopetition relationship within the marine industry displays notable variations among nations, with the overall level remaining relatively high; however, the scope for geo-economic cooperation remains limited. Finally, this paper emphasizes the influence of spatial factors, natural endowment factors, institutional factors, and cultural factors on geo-economic tightness and industrial coopetition relationships across different scales and industries. It is important to note that these factors exhibit distinct variations and exert varying degrees of impact in different contexts.
表1 南海周边国家的经济及占世界比例Table 1 The economies of the nations surrounding the South China Sea and the share of the world |
| 指标 | 衡量 | 2000年 | 2010年 | 2020年 | 2021年 |
|---|---|---|---|---|---|
| 人口 | 总量/亿人 | 16.57 | 17.93 | 19.25 | 19.31 |
| 世界同期占比/% | 26.97 | 25.72 | 24.62 | 24.49 | |
| GDP (现价美元) | 总量/亿美元 | 15910.01 | 74665.52 | 168040.73 | 200673.67 |
| 世界同期占比/% | 4.70 | 11.21 | 19.74 | 20.79 | |
| 贸易规模 (现价美元) | 总量/亿美元 | 9141.79 | 41612.45 | 66373.20 | 85648.09 |
| 世界同期占比/% | 5.74 | 11.02 | 15.00 | 15.62 |
注:以南海周边六国相关数据求和进行计算,包括中国、越南、马来西亚、印度尼西亚、文莱、菲律宾六国。数据来自世界银行数据(WB, https://databank.worldbank.org/source/world-development-indicators)。 |
表2 SITC 1位数行业分类Table 2 Standard International Trade Classification in digit 1 |
| SITC 1位数行业 | 行业名称 | 翻译 |
|---|---|---|
| SITC 0 | Food and live animals | 食品和活畜 |
| SITC 1 | Beverages and tobacco | 饮料和烟草 |
| SITC 2 | Crude materials, inedible, except fuels | 燃料以外的不可食用原材料 |
| SITC 3 | Mineral fuels, lubricants and related materials | 矿物燃料、润滑剂和相关材料 |
| SITC 4 | Animal and vegetable oils, fats and waxes | 动植物油、油脂和蜡 |
| SITC 5 | Chemicals and related products, n.e.s. | 化学品及相关产品 |
| SITC 6 | Manufactured goods | 制成品 |
| SITC 7 | Machinery and transport equipment | 机械和运输设备 |
| SITC 8 | Miscellaneous manufactured articles | 杂项制成品 |
| SITC 9 | Commodities and transactions, n.e.s. | 其他商品与交易 |
表3 2003—2021年南海周边国家间产业内竞合关系演变Table 3 The evolution of industrial coopetition of the nations surrounding the South China Sea in different industries in 2003-2021 |
| 年份 | 产业竞合关系 | 方差 | |||||||||||
|---|---|---|---|---|---|---|---|---|---|---|---|---|---|
| SITC 0 | SITC 1 | SITC 2 | SITC 3 | SITC 4 | SITC 5 | SITC 6 | SITC 7 | SITC 8 | SITC 9 | 全行业 | 剔除SITC 9 | ||
| 2003 | 0.540 | 0.598 | 0.276 | 0.528 | 0.565 | 0.437 | 0.386 | 0.430 | 0.562 | 0.707 | 0.015 | 0.011 | |
| 2004 | 0.553 | 0.615 | 0.283 | 0.542 | 0.589 | 0.487 | 0.378 | 0.474 | 0.569 | 0.680 | 0.014 | 0.012 | |
| 2005 | 0.510 | 0.605 | 0.262 | 0.598 | 0.513 | 0.497 | 0.424 | 0.489 | 0.557 | 0.754 | 0.016 | 0.011 | |
| 2006 | 0.468 | 0.653 | 0.273 | 0.572 | 0.491 | 0.436 | 0.398 | 0.487 | 0.559 | 0.692 | 0.015 | 0.012 | |
| 2007 | 0.451 | 0.630 | 0.261 | 0.551 | 0.565 | 0.426 | 0.411 | 0.488 | 0.557 | 0.523 | 0.011 | 0.012 | |
| 2008 | 0.405 | 0.635 | 0.293 | 0.519 | 0.541 | 0.504 | 0.411 | 0.469 | 0.541 | 0.515 | 0.009 | 0.010 | |
| 2009 | 0.486 | 0.618 | 0.256 | 0.562 | 0.509 | 0.500 | 0.395 | 0.446 | 0.525 | 0.548 | 0.010 | 0.011 | |
| 2010 | 0.497 | 0.613 | 0.271 | 0.580 | 0.537 | 0.463 | 0.421 | 0.492 | 0.491 | 0.910 | 0.027 | 0.010 | |
| 2011 | 0.476 | 0.620 | 0.282 | 0.553 | 0.656 | 0.469 | 0.391 | 0.474 | 0.502 | 0.996 | 0.037 | 0.013 | |
| 2012 | 0.491 | 0.653 | 0.264 | 0.545 | 0.658 | 0.492 | 0.402 | 0.500 | 0.474 | 0.963 | 0.035 | 0.015 | |
| 2013 | 0.491 | 0.612 | 0.259 | 0.512 | 0.679 | 0.515 | 0.372 | 0.456 | 0.488 | 0.998 | 0.039 | 0.015 | |
| 2014 | 0.468 | 0.625 | 0.243 | 0.499 | 0.525 | 0.492 | 0.389 | 0.429 | 0.516 | 0.610 | 0.012 | 0.011 | |
| 2015 | 0.535 | 0.636 | 0.223 | 0.503 | 0.687 | 0.511 | 0.394 | 0.385 | 0.488 | 1.000 | 0.044 | 0.019 | |
| 2016 | 0.499 | 0.646 | 0.215 | 0.467 | 0.738 | 0.539 | 0.381 | 0.434 | 0.481 | 1.000 | 0.046 | 0.022 | |
| 2017 | 0.506 | 0.640 | 0.226 | 0.491 | 0.585 | 0.520 | 0.425 | 0.392 | 0.419 | 1.000 | 0.041 | 0.015 | |
| 2018 | 0.499 | 0.615 | 0.236 | 0.500 | 0.746 | 0.522 | 0.404 | 0.416 | 0.492 | 1.000 | 0.044 | 0.020 | |
| 2019 | 0.494 | 0.583 | 0.242 | 0.457 | 0.746 | 0.568 | 0.410 | 0.395 | 0.494 | 1.000 | 0.044 | 0.020 | |
| 2020 | 0.536 | 0.547 | 0.243 | 0.518 | 0.751 | 0.499 | 0.337 | 0.435 | 0.512 | 1.000 | 0.044 | 0.020 | |
| 2021 | 0.528 | 0.531 | 0.231 | 0.401 | 0.728 | 0.500 | 0.362 | 0.416 | 0.465 | 1.000 | 0.046 | 0.019 | |
表4 影响因素分析的回归结果Table 4 Regression results of influencing factors |
| 变量 | 地缘经济联系紧密度 | 产业竞合关系 | |||||
|---|---|---|---|---|---|---|---|
| 整体 | 分行业 | 海洋产业 | 整体 | 分行业 | 海洋产业 | ||
| 空间因素 | -0.663***(0.037) | -0.574***(0.013) | -0.663***(0.034) | 0.483*(0.251) | 0.044(0.041) | -0.009(0.060) | |
| 自然禀赋因素 | 0.007**(0.002) | 0.003***(0.001) | 0.005**(0.002) | -0.025(0.016) | -0.006**(0.003) | -0.009*(0.005) | |
| 文化因素 | 0.893***(0.161) | 0.222***(0.046) | 0.373***(0.125) | 1.276**(0.483) | -0.335**(0.157) | -0.474(0.353) | |
| 制度环境 | -0.183***(0.051) | -0.005(0.019) | -0.066*(0.036) | 0.036(0.259) | -0.059(0.052) | 0.061(0.078) | |
| 常数项 | 5.618***(0.273) | 4.991***(0.099) | 5.687***(0.267) | -3.265*(1.716) | 0.365(0.303) | 1.133**(0.422) | |
| 样本量/个 | 570 | 5700 | 570 | 570 | 5620 | 570 | |
| Adj_R2 | 0.867 | 0.965 | 0.929 | 0.250 | 0.566 | 0.594 | |
| 国家i×年份 | 已控制 | 未控制 | 已控制 | 已控制 | 未控制 | 已控制 | |
| 国家j×年份 | 已控制 | 未控制 | 已控制 | 已控制 | 未控制 | 已控制 | |
| 国家i×行业×年份 | 未控制 | 已控制 | 未控制 | 未控制 | 已控制 | 未控制 | |
| 国家j×行业×年份 | 未控制 | 已控制 | 未控制 | 未控制 | 已控制 | 未控制 | |
注:*、**、***分别表示10%、5%、1%显著性水平,括号内为聚类标准误。 |
| [1] |
|
| [2] |
|
| [3] |
陆大道, 杜德斌. 关于加强地缘政治地缘经济研究的思考. 地理学报, 2013, 68(6): 723-727.
[
|
| [4] |
毛汉英. 中国周边地缘政治与地缘经济格局和对策. 地理科学进展, 2014, 33(3): 289-302.
[
|
| [5] |
|
| [6] |
|
| [7] |
|
| [8] |
|
| [9] |
杨文龙, 史文天, 杜德斌. 全球地缘经济合作的空间模式与空间机理: 基于商品贸易规模的实证研究. 地理科学, 2021, 41(11): 1875-1883.
[
|
| [10] |
熊理然, 杜雯慧, 张一方, 等. 东南亚地缘经济空间的多重分割及其对RCEP的影响研究: 基于区域经济合作推拉模型的分析. 经济问题探索, 2022, 39(1): 181-190.
[
|
| [11] |
杜德斌, 段德忠, 刘承良, 等. 1990年以来中国地理学之地缘政治学研究进展. 地理研究, 2015, 34(2): 199-212.
[
|
| [12] |
宋涛. 地缘经济视角下的边境地理学研究框架. 科技导报, 2018, 36(3): 49-54.
[
|
| [13] |
叶恺臻, 刘建忠, 张晶. 地缘经济视角下中日韩对东盟出口竞争性分析. 地域研究与开发, 2018, 37(1): 41-45.
[
|
| [14] |
汪亚青. 地缘经济新格局下战略性新兴产业国际竞争力塑造: 新常态下“一带一路”战略带来的机遇、挑战与应对策略. 西部论坛, 2015, 25(5): 50-62.
[
|
| [15] |
|
| [16] |
|
| [17] |
马腾, 李一杰, 潘娴, 等. 中、美、俄与中东欧国家地缘经济关系的时空演变. 经济地理, 2022, 42(6): 1-12.
[
|
| [18] |
马腾, 葛岳静, 黄宇, 等. 基于流量数据的中美两国与东北亚地缘经济关系研究. 地理学报, 2020, 75(10): 2076-2091.
[
|
| [19] |
杨文武, 黎思琦. 基于时空邻里效应的南亚地缘经济产业格局演化及趋势分析. 南亚研究季刊, 2021, (2): 97- 117, 158-159.
[
|
| [20] |
贺灿飞, 余昌达. 多维邻近性、贸易壁垒与中国: 世界市场的产业联系动态演化. 地理学报, 2022, 77(2): 275-294.
[
|
| [21] |
黄宇, 葛岳静, 刘晓凤. 基于库仑引力模型的中美日地缘经济关系测算. 地理学报, 2019, 74(2): 285-296.
[
|
| [22] |
彭水军, 吴腊梅. RCEP的贸易和福利效应: 基于全球价值链的考察. 经济研究, 2022, 57(8): 98-115.
[
|
| [23] |
|
| [24] |
毕华. 南海地理. 广西: 广西师范大学出版社, 2011.
[
|
| [25] |
刘玄宇, 刘云刚. 中国南海海洋国土开发与管控研究展望. 自然资源学报, 2021, 36(9): 2205-2218.
[
|
| [26] |
王武青. RCEP成员国产业发展水平研究. 亚太经济, 2021, (3): 62-73.
[
|
| [27] |
李加林, 沈满洪, 马仁锋, 等. 海洋生态文明建设背景下的海洋资源经济与海洋战略. 自然资源学报, 2022, 37(4): 829-849.
[
|
| [28] |
王鑫静, 姜炎鹏, 马仁锋. 域外国家与南海周边地缘经济联系强度演化与态势评估. 地理研究, 2022, 41(3): 681-697.
[
|
| [29] |
秦奇, 吴良, 李飞, 等. 基于社会网络分析的东南亚地缘关系研究. 地理学报, 2018, 73(10): 2014-2030.
[
|
| [30] |
梁甲瑞. 美国重返亚太及中国的战略应对: 基于南海海上战略通道的视角. 世界地理研究, 2017, 26(1): 12-21.
[
|
| [31] |
|
| [32] |
林志锋. “一带一路”倡议下我国南海海洋战略的思路与探讨. 中国市场, 2020, (12): 86-87.
[
|
| [33] |
贾秀冬. 南海不容搅局者破坏,美日澳究竟有何盘算?. 人民日报海外版, http://paper.people.com.cn/rmrbhwb/html/2017-08/11/content_1797257.htm, 2017-08-11(1).
[
|
| [34] |
陆俊元. 中国安全环境结构: 一个地缘政治分析框架. 人文地理, 2010, 25(2): 140-143.
[
|
| [35] |
莫杰. 海洋地学前缘. 山东: 中国海洋出版社, 2004.
[
|
| [36] |
潘建纲. 南海油气资源及其开发展望. 海洋开发与管理, 2002, (3): 39-49.
[
|
| [37] |
刘玮宁, 张炜哲. 中国南海探明石油资源储量. 西部资源, 2012, 48(3): 29.
[
|
| [38] |
中华人民共和国自然资源部. 2016年中国海洋环境状况公报, http://gc.mnr.gov.cn/201806/t20180619_1797645.html, 2017-03-22.
[Ministry of Natural Resources of the People's Republic of China. Communiqué on the state of the marine environment in China in 2016, http://gc.mnr.gov.cn/201806/t20180619_1797645.html, 2017-03-22.]
|
| [39] |
|
| [40] |
马草原, 朱玉飞, 李廷瑞. 地方政府竞争下的区域产业布局. 经济研究, 2021, 56(2): 141-156.
[
|
| [41] |
唐为. 要素市场一体化与城市群经济的发展: 基于微观企业数据的分析. 经济学(季刊), 2021, 21(1): 1-22.
[
|
| [42] |
胡志丁, 杜德斌. 日本德川幕府时期的地缘环境分析: 兼论国别地缘环境分析框架. 地理学报, 2020, 75(10): 2047-2060.
[
|
| [43] |
韩璟, 潘子纯, 卢新海. 东南亚地区中国海外耕地投资项目的空间分布及影响因素分析. 自然资源学报, 2021, 36(6): 1521-1534.
[
|
| [44] |
王惠文, 葛岳静, 马腾. 地缘位势与中国: 中亚地缘关系初探. 经济地理, 2018, 38(9): 10-21.
[
|
| [45] |
黄新飞, 关楠, 翟爱梅. 遗传距离对跨国收入差距的影响研究: 理论和中国的实证分析. 经济学(季刊), 2014, 13(3): 1127-1146.
[
|
| [46] |
|
| [47] |
刘毓芸, 徐现祥, 肖泽凯. 劳动力跨方言流动的倒U型模式. 经济研究, 2015, 50(10): 134-146, 162.
[
|
| [48] |
|
| [49] |
|
| [50] |
傅梦孜, 刘兰芬. 全球海洋经济: 认知差异、比较研究与中国的机遇. 太平洋学报, 2022, 30(1): 78-91.
[
|
| [51] |
|
| [52] |
杨文龙, 游小珺, 杜德斌. 商品贸易网络视角下地缘经济系统的属性与功能演进. 地理研究, 2021, 40(2): 356-372.
[
|
/
| 〈 |
|
〉 |