
中国城市水资源短缺类型与发展轨迹识别——以32个主要城市为例
|
赵孝威(1999- ),男,河南驻马店人,硕士,研究方向为水文学及水资源。E-mail: 2021129020@chd.edu.cn |
收稿日期: 2023-04-10
修回日期: 2023-07-19
网络出版日期: 2023-10-13
基金资助
国家自然科学基金项目(51979005)
长安大学中央高校基本科研业务费专项资金项目(300102293201)
陕西省自然科学基础研究计划(2022JQ-341)
Types identification and development tracking of urban water scarcity in China: A case study of 32 major cities
Received date: 2023-04-10
Revised date: 2023-07-19
Online published: 2023-10-13
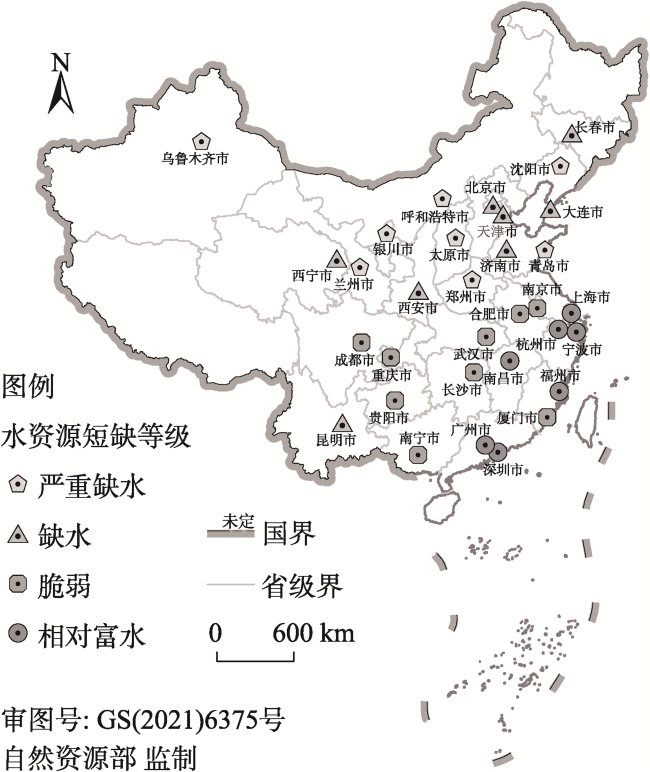
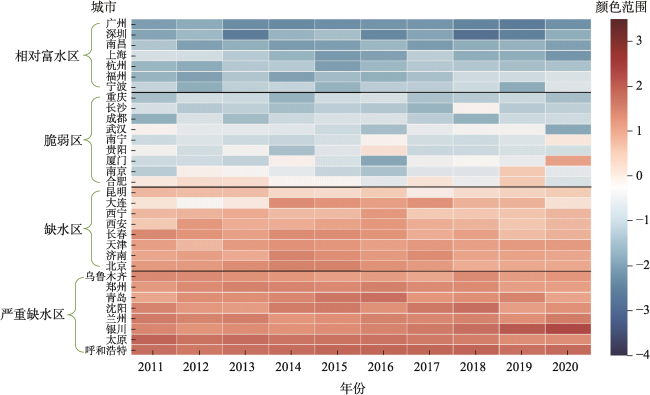
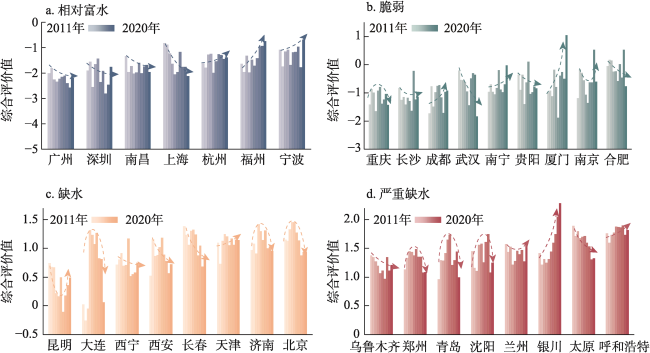
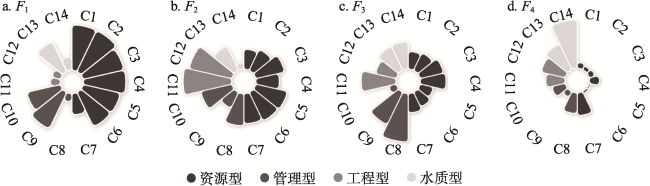
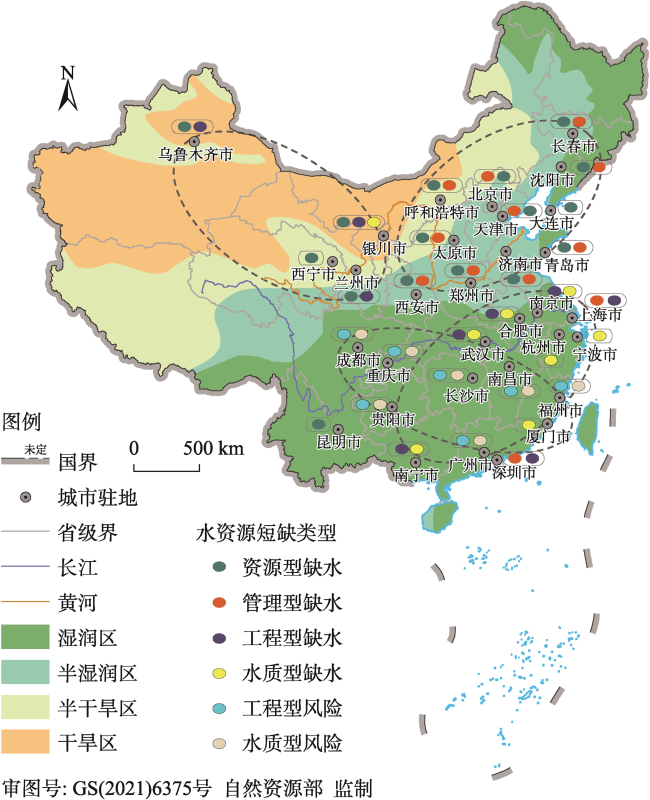
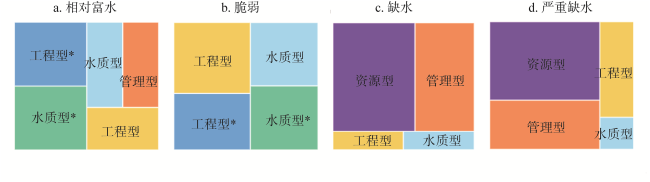
基于主成分分析法和组基多轨迹模型,对中国32个主要城市进行了水资源短缺程度评价与缺水类型识别,并探究了城市缺水类型转化以及水资源管理风险问题。研究表明:(1)中国城市的水资源短缺程度具有明显的空间分异性,主要表现为由东南向西北逐渐加深,缺水城市以北方城市为主。(2)西北片区城市以资源—工程型缺水为主导,华北与东北片区大部分属于资源型和管理型缺水,南方城市多表现为工程型和水质型缺水。(3)缺水越严重的地区,城市缺水问题亦越复杂,且驱动因素具有时变性,城市扩张和GDP增长的交织影响常引发城市缺水类型或主导位置的转换,甚至导致城市缺水风险实质性化。(4)城市规模越大、GDP总量越高,越易出现管理型缺水问题。
赵孝威 , 张洪波 , 李同方 , 冶兆霞 , 薛超伟 , 张雨柔 , 杨志芳 . 中国城市水资源短缺类型与发展轨迹识别——以32个主要城市为例[J]. 自然资源学报, 2023 , 38(10) : 2619 -2636 . DOI: 10.31497/zrzyxb.20231013
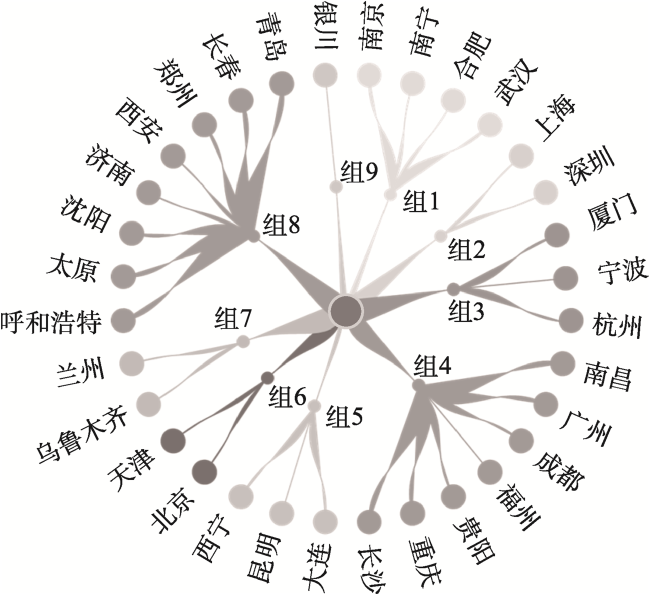
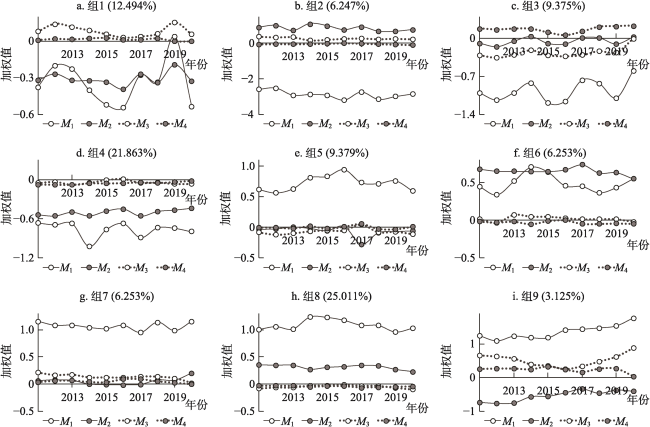
This study creates an evaluation index system for the degree of urban water scarcity based on the results of previous research and uses principal component analysis (PCA) to assess the level of water scarcity in 32 major cities in China from 2011 to 2020. The types and distribution characteristics of water scarcity are identified, along with the dominant physical meaning of the principal components, using the group-based multi-trajectory modeling (GBMTM) method. In addition, the types of scarcity and the potential risks of managing water resources during the process of urban expansion are discussed. The results showed that: (1) Significant regional variability exists in the water resource deficit, as demonstrated by the fact that it worsens gradually from the southeast to the northwest and is constrained by resource endowment. There, most cities with water scarcity are distributed in Northern China. (2) Resource-engineering coupling-constrained water scarcity is prevalent in major cities of Northwest China, resource-constrained and management-constrained water scarcity is prevalent in most parts of North and Northeast China; engineering-constrained and water-quality-constrained water scarcity is prevalent in many cities of Southern China. (3) The complexity of the urban water scarcity problem increases with the severity of the water deficit. Also, the motivating factors change over time. For instance, the intertwined impact of urban growth and GDP growth frequently results in the conversion of urban water scarcity types or the dominant position and can even cause the risk of urban water scarcity to materialize. (4) The likelihood of management-constrained water scarcity increases with the increase of city size and GDP. Also, the pace at which management-constrained water scarcity contributes to urban development is proportionate. The study also discovered that the GBMTM model can accurately distinguish separate clusters from various development trajectories. It can be utilized as a crucial tool for tracking the evolution of dynamic data in hydrology and water resources fields.
表1 城市水资源短缺程度评价指标体系Table 1 Evaluation index system of urban water scarcity |
| 目标层A | 准则层B | 指标层C | 计算公式 | 量纲 | 指标来源 |
|---|---|---|---|---|---|
| 城市水资源短缺程度评价/A | 水资源量/B1 | 降水量/C1(-) | 查阅资料 | m3/人 | [39] |
| 产水模数/C2(-) | 水资源总量/土地面积 | 万m3/km2 | [39] | ||
| 径流系数/C3(-) | 径流量/降水量 | — | [40] | ||
| 产水系数/C4(-) | 水资源总量/降水总量 | — | [40] | ||
| 社会经济状况/B2 | 人口密度/C5(+) | 总人口/土地面积 | 人/km2 | [40] | |
| GDP模数/C6(+) | GDP/土地面积 | 万元/km2 | [41] | ||
| 城镇化率/C7(+) | 城镇人口/总人口 | % | [10] | ||
| 供用水情况/B3 | 人均供水量/C8(-) | 供水总量/总人口 | m3/人 | [41] | |
| 供水模数/C9(-) | 供水总量/土地面积 | 万m3/km2 | [41] | ||
| 地下水供水比重/C10(+) | 地下水供水量/供水总量 | % | [40] | ||
| 万元GDP用水量/C11(+) | 用水总量/GDP | m3/万元 | [39] | ||
| 万元工业增加值用水量/C12(+) | 工业用水量/工业增加值 | m3/万元 | [10] | ||
| 水环境状况/B4 | 污水处理能力/C13(-) | 查阅资料 | m3/天 | [10] | |
| 人均工业废水排放量/C14(+) | 工业废水排放总量/总人口 | t/人 | [42] |
注:表中牵涉到的人口指标均为常住人口;指标层中,(+)表示正向指标,(-)表示负向指标。 |
表2 2011年主成分提取分析表Table 2 Principal component extraction analysis in 2011 |
| 成分 | 初始特征值 | 提取平方和载入 | |||||
|---|---|---|---|---|---|---|---|
| 特征值 | 贡献率/% | 累计贡献率/% | 特征值 | 贡献率/% | 累计贡献率/% | ||
| 1 | 5.649 | 40.349 | 40.349 | 5.649 | 40.349 | 40.349 | |
| 2 | 3.354 | 23.959 | 64.307 | 3.354 | 23.959 | 64.307 | |
| 3 | 1.948 | 13.917 | 78.224 | 1.948 | 13.917 | 78.224 | |
| 4 | 1.113 | 7.950 | 86.174 | 1.113 | 7.950 | 86.174 | |
| 5 | 0.538 | 3.843 | 90.017 | ||||
| 6 | 0.418 | 2.985 | 93.003 | ||||
| 7 | 0.374 | 2.672 | 95.674 | ||||
| … | … | … | … | ||||
| 12 | 0.026 | 0.186 | 99.842 | ||||
| 13 | 0.014 | 0.098 | 99.940 | ||||
| 14 | 0.008 | 0.060 | 100.000 | ||||
表3 32个主要城市2011—2020年水资源短缺程度评分均值Table 3 Water scarcity degree scoring average of 32 major cities in 2011-2020 |
| 城市 | F | 排名 | 城市 | F | 排名 | 城市 | F | 排名 |
|---|---|---|---|---|---|---|---|---|
| 呼和浩特 | 1.79 | 1 | 长春 | 1.10 | 12 | 成都 | -1.13 | 23 |
| 太原 | 1.62 | 2 | 西安 | 0.86 | 13 | 长沙 | -1.14 | 24 |
| 银川 | 1.56 | 3 | 西宁 | 0.74 | 14 | 重庆 | -1.18 | 25 |
| 兰州 | 1.42 | 4 | 大连 | 0.63 | 15 | 宁波 | -1.25 | 26 |
| 沈阳 | 1.38 | 5 | 昆明 | 0.39 | 16 | 福州 | -1.41 | 27 |
| 青岛 | 1.33 | 6 | 合肥 | -0.15 | 17 | 杭州 | -1.48 | 28 |
| 郑州 | 1.31 | 7 | 南京 | -0.60 | 18 | 上海 | -1.54 | 29 |
| 乌鲁木齐 | 1.20 | 8 | 厦门 | -0.60 | 19 | 南昌 | -1.80 | 30 |
| 北京 | 1.17 | 9 | 贵阳 | -0.72 | 20 | 深圳 | -2.04 | 31 |
| 济南 | 1.11 | 10 | 南宁 | -0.73 | 21 | 广州 | -2.20 | 32 |
| 天津 | 1.10 | 11 | 武汉 | -0.73 | 22 |
注:F表示各市10年的评分均值,F值越大,表示城市缺水程度越高。 |
表4 模型分组结果准确度检验Table 4 Accuracy test of model grouping results |
| 组别 | AvePP | Pj/% | /% | 相对误差/% |
|---|---|---|---|---|
| 组1 | 1 | 12.500 | 12.494 | -0.048 |
| 组2 | 0.999 | 6.250 | 6.247 | -0.048 |
| 组3 | 0.999 | 9.375 | 9.375 | 0.000 |
| 组4 | 1 | 21.875 | 21.863 | -0.055 |
| 组5 | 0.999 | 9.375 | 9.379 | 0.043 |
| 组6 | 1 | 6.250 | 6.253 | 0.048 |
| 组7 | 1 | 6.250 | 6.253 | 0.048 |
| 组8 | 0.998 | 25.000 | 25.011 | 0.044 |
| 组9 | 1 | 3.125 | 3.125 | 0.000 |
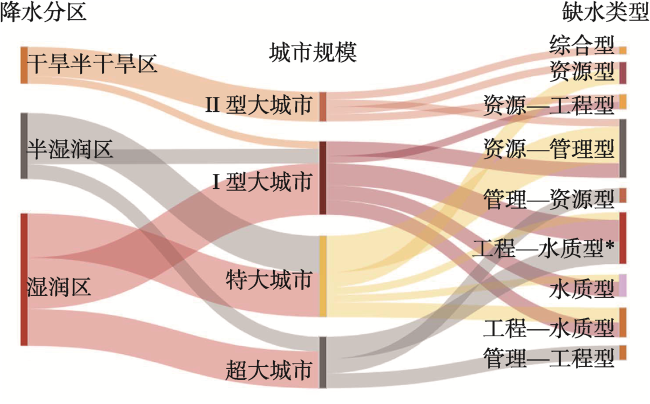
图9 降水+城市规模对城市水资源短缺类型的影响注:图中工程—水质型*表示工程—水质复合型水资源短缺风险,下同。 Fig. 9 Impact of precipitation and city size on urban water scarcity type |
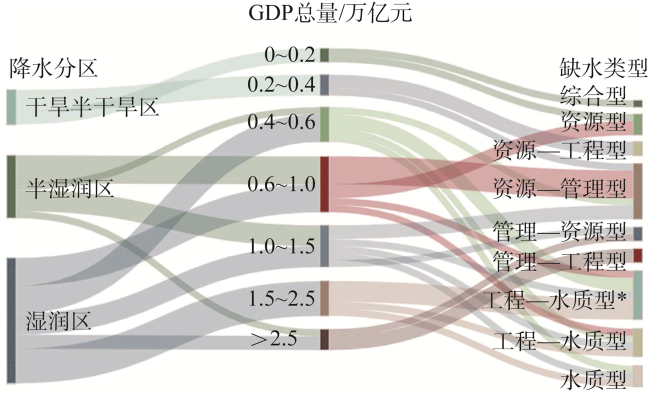
图10 降水+GDP对城市水资源短缺类型的影响Fig. 10 Impact of precipitation and GDP on urban water scarcity type |
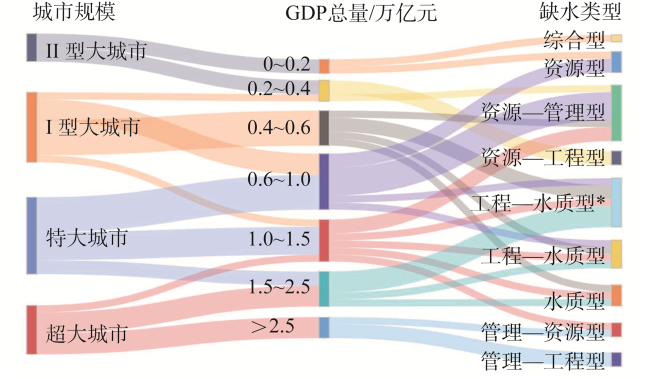
图11 城市规模+GDP对城市水资源短缺类型的影响Fig. 11 Impact of city size and GDP on urban water scarcity type |
表5 城市规模分类标准及涵盖城市Table 5 Classification standard of city size and the corresponding cities |
| 城市规模 | 城区常住人口/万人 | GDP总量/万亿元 | 涵盖城市 | 计数/个 |
|---|---|---|---|---|
| Ⅱ型大城市 | 100~300 | 0~0.2 | 西宁、银川 | 2 |
| 0.2~0.4 | 兰州、呼和浩特 | 2 | ||
| Ⅰ型大城市 | 300~500 | 0.2~0.4 | 乌鲁木齐 | 1 |
| 0.4~0.6 | 贵阳、南宁、南昌、厦门、太原 | 5 | ||
| 0.6~1.0 | 长春、福州、合肥 | 3 | ||
| 1.0~1.5 | 宁波 | 1 | ||
| 特大城市 | 500~1000 | 0.6~1.0 | 西安、济南、沈阳、昆明、大连 | 5 |
| 1.0~1.5 | 郑州、青岛、南京、长沙 | 4 | ||
| 1.5~2.5 | 杭州、武汉 | 2 | ||
| 超大城市 | >1000 | 1.0~1.5 | 天津 | 1 |
| 1.5~2.5 | 广州、重庆、成都 | 3 | ||
| >2.5 | 北京、上海、深圳 | 3 |
| [1] |
孙才志, 魏亚琼, 赵良仕. 干旱区水—能源—粮食纽带系统协同演化: 以中国西北地区为例. 自然资源学报, 2022, 37(2): 320-333.
[
|
| [2] |
韩雁, 贾绍凤, 鲁春霞, 等. 水资源与社会经济发展要素时空匹配特征: 以张家口为例. 自然资源学报, 2020, 35(6): 1392-1401.
[
|
| [3] |
丁超, 胡永江, 王振华, 等. 虚拟水社会循环视域下的水资源承载力评价. 自然资源学报, 2021, 36(2): 356-371.
[
|
| [4] |
邱国玉, 张晓楠. 21世纪中国的城市化特点及其生态环境挑战. 地球科学进展, 2019, 34(6): 640-649.
[
|
| [5] |
|
| [6] |
贾学秀, 严岩, 朱春雁, 等. 区域水资源压力分析评价方法综述. 自然资源学报, 2016, 31(10): 1783-1791.
[
|
| [7] |
|
| [8] |
赵勇, 裴源生, 陈一鸣. 我国城市缺水研究. 水科学进展, 2006, 17(3): 389-394.
[
|
| [9] |
梁媛, 许新宜, 王红瑞, 等. 基于循环修正模式的云南省水资源短缺程度分析. 自然资源学报, 2013, 28(7): 1146-1158.
[
|
| [10] |
王崴, 许新宜, 王红瑞, 等. 基于PSR与DCE综合模型的水资源短缺程度及变化趋势分析: 以北京市为例. 自然资源学报, 2015, 30(10): 1725-1734.
[
|
| [11] |
刘俊国, 赵丹丹. “量—质—生” 三维水资源短缺评价: 评述及展望. 科学通报, 2020, 65(36): 4251-4261.
[
|
| [12] |
许新宜, 王韶伟, 庞博, 等. 水资源紧缺类型及其对策分析研究. 北京师范大学学报: 自然科学版, 2009, 45(1): 86-90.
[
|
| [13] |
王晓青. 中国水资源短缺地域差异研究. 自然资源学报, 2001, 16(6): 516-520.
[
|
| [14] |
童绍玉, 周振宇, 彭海英. 中国水资源短缺的空间格局及缺水类型. 生态经济, 2016, 32(7): 168-173.
[
|
| [15] |
李想, 郭丹红, 刘家宏, 等. 京津冀协同发展背景下的县域水资源安全诊断. 水利水电技术: 中英文, 2021, 52(10): 59-71.
[
|
| [16] |
|
| [17] |
|
| [18] |
|
| [19] |
|
| [20] |
|
| [21] |
|
| [22] |
张兵兵. 中国用水结构优化研究. 杭州: 浙江大学, 2017.
[
|
| [23] |
|
| [24] |
范琳琳, 王红瑞, 刘凤丽, 等. 基于WEI+的流域水资源短缺分析. 长江科学院院报, 2017, 34(4): 9-14.
[
|
| [25] |
孙思奥, 任宇飞, 张蔷. 多尺度视角下的青藏高原水资源短缺估算及空间格局. 地球信息科学学报, 2019, 21(9): 1308-1317.
[
|
| [26] |
刘佳旭, 李九一, 李丽娟, 等. 昆明市水资源短缺空间格局综合分析. 长江科学院院报, 2017, 34(8): 6-10, 17.
[
|
| [27] |
操信春, 刘喆, 吴梦洋, 等. 水足迹分析中国耕地水资源短缺时空格局及驱动机制. 农业工程学报, 2019, 35(18): 94-100.
[
|
| [28] |
崔晨曦, 孟凡浩, 罗敏, 等. 基于地理探测器的内蒙古耕地水资源短缺时空变化特征及驱动力分析. 中国农业资源与区划, 2023, 44(1): 150-161.
[
|
| [29] |
|
| [30] |
|
| [31] |
|
| [32] |
张晨旭, 谢峰, 林振, 等. 基于组轨迹模型及其研究进展. 中国卫生统计, 2020, 37(6): 946-949.
[
|
| [33] |
|
| [34] |
朱建平. 应用多元统计分析. 北京: 科学出版社, 2016: 109-110.
[
|
| [35] |
陈鹏宇. 线性无量纲化方法对比及反向指标正向化方法. 运筹与管理, 2021, 30(10): 95-101.
[
|
| [36] |
|
| [37] |
|
| [38] |
彭张林, 张爱萍, 王素凤, 等. 综合评价指标体系的设计原则与构建流程. 科研管理, 2017, 38(s1): 209-215.
[
|
| [39] |
刘庆芳, 王小坤, 朱青, 等. 基于“三生”功能的西藏自治区水资源承载力系统耦合关系. 自然资源学报, 2023, 38(6): 1618-1631.
[
|
| [40] |
杜剑. 山东省三大流域水资源紧缺程度研究. 济南: 山东师范大学, 2010.
[
|
| [41] |
丁竹英, 陈瀛洲, 胡陈静. 中国水资源短缺程度及缺水类型研究. 特区经济, 2018, (9): 47-50.
[
|
| [42] |
卢开东, 王健健, 马燮铫, 等. 基于DPSIR模型的芜湖市水生态承载力研究与建议. 环境工程技术学报, 2022, 12(2): 538-545.
[
|
| [43] |
|
| [44] |
赵琳, 何萍, 闫桃, 等. 昆明市近50 a降水变化特征分析. 云南地理环境研究, 2017, 29(6): 54-61.
[
|
| [45] |
吕文康. 滇中引水工程将改写昆明缺水史. 昆明日报, 2022-04-06( 1).
[
|
| [46] |
|
/
| 〈 |
|
〉 |