
成都都市圈生态与社会经济系统耦合协调动态演化、多情景模拟及其政策启示
|
刘轶(2000- ),女,湖南岳阳人,硕士,研究方向为风景园林规划与设计、新能源景观。E-mail: 1575124783@qq.com |
收稿日期: 2023-05-15
修回日期: 2023-06-30
网络出版日期: 2023-10-13
基金资助
国家自然科学基金项目(31500581)
成都市科技项目(2019-RK00-00261-ZF)
Dynamic evolution and multi-scenario simulation of ecosystem and socio-economic system coupling coordination in Chengdu Metropolitan Area and its policy implications
Received date: 2023-05-15
Revised date: 2023-06-30
Online published: 2023-10-13
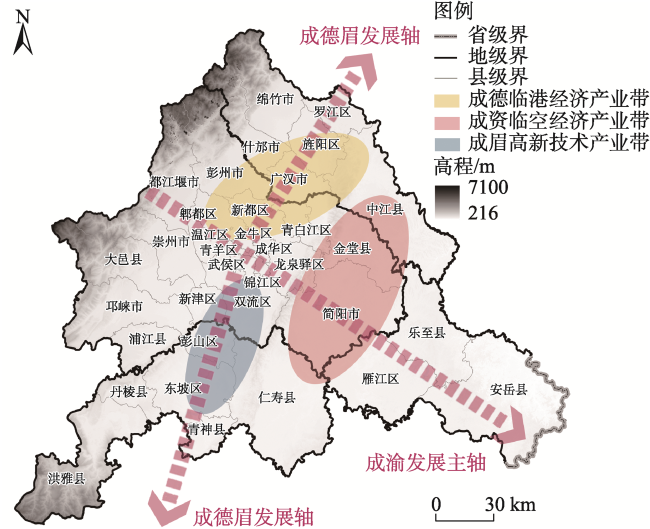
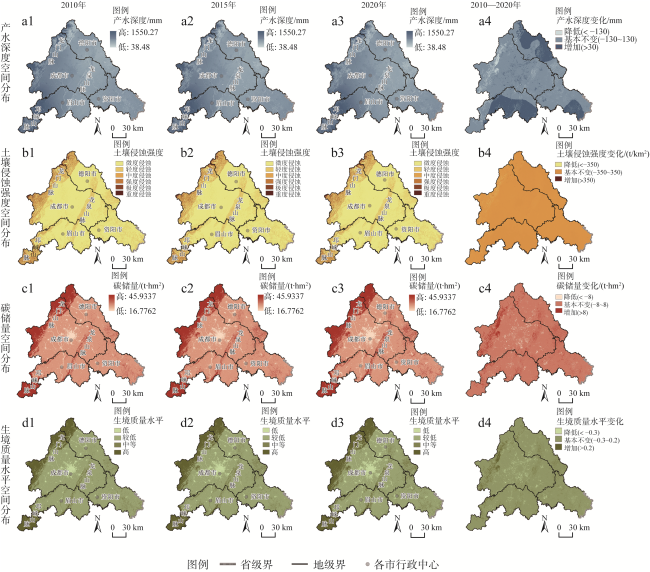
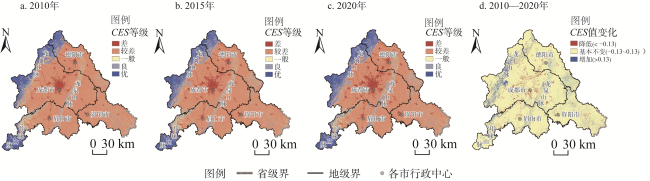
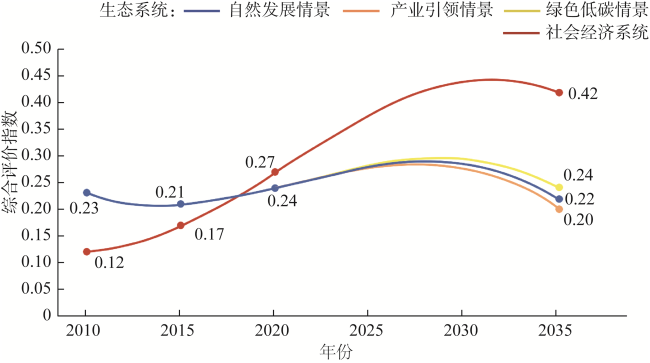
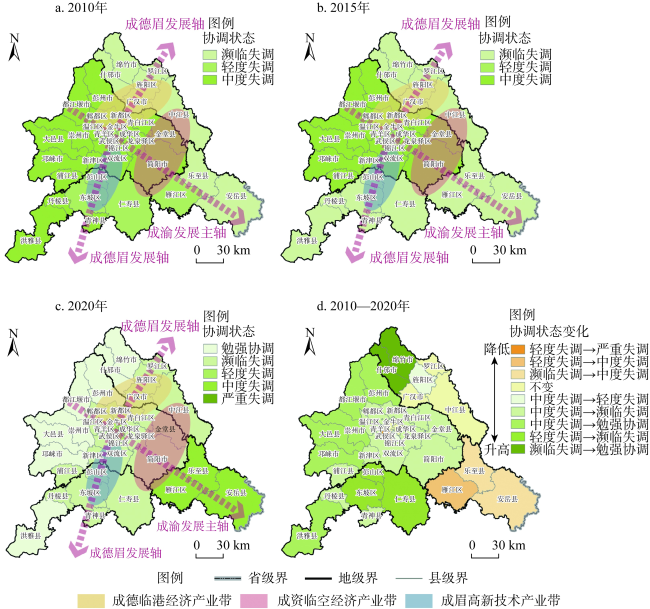
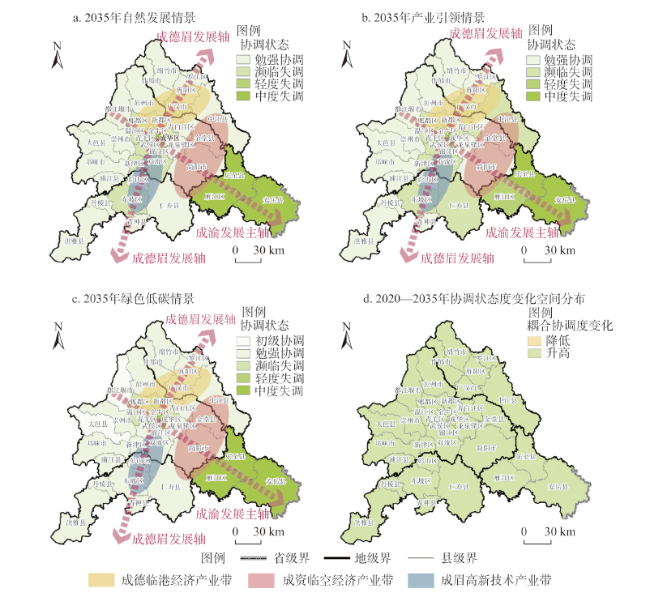
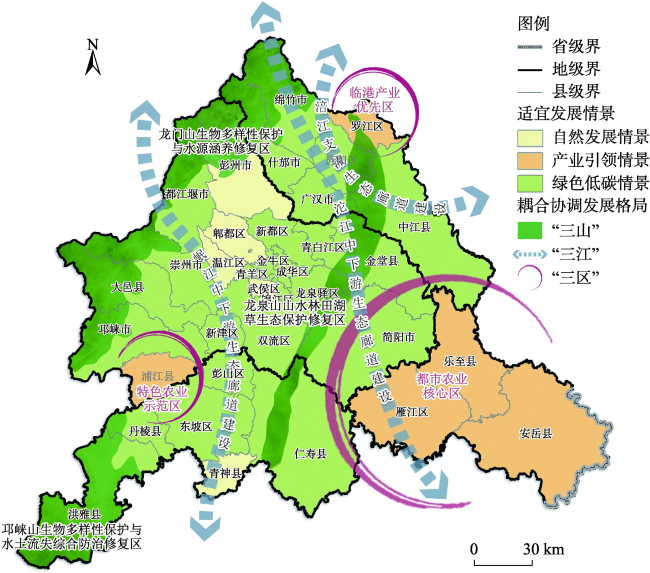
成都都市圈作为长江上游重要的生态屏障区和经济中心,开展生态—社会经济耦合协调研究对其可持续发展具有重要意义。利用InVEST模型分析研究区2010年、2015年、2020年生态系统服务功能变化,通过耦合协调度模型分析其与社会经济系统的耦合协调动态演化过程,基于InVEST—PLUS模型模拟分析2035年自然发展、产业引领、绿色低碳三种情景下生态与社会经济系统的耦合协调变化趋势。结果表明:(1)2010年、2015年、2020年生态系统综合服务指数平均值分别为0.43、0.41、0.44,总体处于一般等级,空间分布无较大差异,整体呈“西部优于东部、中部最低”的特点;(2)2010—2020年,两系统间耦合协调度由0.29上升至0.36,实现了由中度失调向轻度失调状态的转变,但空间分布不平衡,整体格局由“东部优于西部”转为“西部优于东部”;(3)2020—2035年,两系统间耦合协调水平持续改善,三种情景耦合协调度由大到小依次为:绿色低碳情景>自然发展情景>产业引领情景,表明修复治理措施力度的加大有利于改善研究区大部分区域的协调状态。根据研究结果提出筑屏“三山”、涵养“三江”、协同“三区”三点政策启示,可为成都都市圈可持续协调发展提供科学依据和支撑,亦可为其他都市圈提供参考和样本。
刘轶 , 王倩娜 , 廖奕晴 . 成都都市圈生态与社会经济系统耦合协调动态演化、多情景模拟及其政策启示[J]. 自然资源学报, 2023 , 38(10) : 2599 -2618 . DOI: 10.31497/zrzyxb.20231012
Chengdu Metropolitan Area in China serves as an important ecological screen area and economic center in the upstream Yangtze River, and it is of great significance to conduct research on ecosystem and socio-economic system coupling and coordination for reginal sustainable development. Firstly, based on InVEST model, this study analyzes the changes in ecosystem service functions in the study area in 2010, 2015, and 2020. Furthermore, the coupling coordination degree model is applied to analyze the dynamic evolution process of its coupling coordination with the socio-economic system. Finally, based on InVEST-PLUS model and with the consideration of land use changes, this study simulates and analyzes the coupling coordination change trends of ecosystem and socio-economic system under three scenarios: natural development, industry-led, and low-carbon in 2035. The results show the following conclusions: (1) The average values of comprehensive index for ES in 2010, 2015, and 2020 were 0.43, 0.41, and 0.44, respectively, which were generally in the average level. There is no significant difference in spatial distribution, and the overall presents the characteristics of "the west is better than the east, and the central part is the lowest". (2) From 2010 to 2020, the coupling coordination degree between the two systems increased from 0.29 to 0.36, achieving a transition from a status of moderate disorder to mild disorder. However, there exists spatial imbalance in the spatial distribution, with the overall pattern shifting from "the east is better than the west" to "the west is better than the east". (3) From 2020 to 2035, the level of coupling coordination between the two systems continues to improve. Among the three scenarios, the coupling coordination degree is ranked as follows: low-carbon scenario > natural development scenario > industry-led scenario, indicating that intensifying restoration and governance measures is beneficial for improving the coordination status in most parts of the study area. Finally, based on the research results, three policy implications are proposed: building "three mountains", conserving "three rivers", and coordinating "three districts". The research results are benefit for providing a scientific basis and support for the sustainable and coordinated development of Chengdu Metropolitan Area, and also offer reference and samples for other metropolitan areas.
表1 数据类型及来源Table 1 Data types and sources |
| 数据类型 | 数据名称 | 数据年份 | 数据来源 | 单位 | 分辨率 |
|---|---|---|---|---|---|
| 基础数据 | 行政边界 | 2020 | 国家地球系统科学数据中心 (http://www.geodata.cn/) | — | 矢量数据 |
| 土地利用 | 2010、2015、2020 | 武汉大学年度中国土地覆盖数据集(CLCD)[21] | — | 30 m | |
| 自然环境数据 | 年降雨量* | 2010、2015、2020 | 国家地球系统科学数据中心 (http://www.geodata.cn/) | mm | 1 km |
| 潜在蒸散量 | |||||
| 年均气温* | 2020 | 资源环境科学与数据中心(https://www.resdc.cn/) | ℃ | 1 km | |
| 流域及子流域边界 | 2010、2015、2020 | — | 矢量数据 | ||
| 国家公园、自然保护区 | 2020 | — | |||
| 中国土壤数据库 | 1995 | 国家青藏高原科学数据中心(http://data.tpdc.ac.cn/zhhans/) | — | 1 km | |
| DEM数据* | 2020 | 地理空间数据云(https://www.gscloud.cn/) | m | 30 m | |
| 坡度* | 利用ArcGIS软件基于DEM数据计算所得 | (°) | |||
| 坡向* | |||||
| 交通区位数据 | 到水体距离* | 2020 | 基于全球地理信息资源目录服务系统(https://www.webmap.cn/)中水体、铁路、高速公路、国道、省道、城市一级道路、城市二级道路、城市三级道路的矢量数据,经过ArcGIS欧氏距离计算 得到 | m | 30 m |
| 到铁路距离* | |||||
| 到高速公路距离* | |||||
| 到国道距离* | |||||
| 到省道距离* | |||||
| 到城市一级道路距离* | |||||
| 到城市二级道路距离* | |||||
| 到城市三级道路距离* | |||||
| 社会经济数据 | GDP* | 2010、2015、2020 | 四川省统计年鉴[19,22,23] | 亿元 | 统计数据 |
| 常住人口城镇化率 | % | ||||
| 人口规模 | 万人 | ||||
| 城乡居民可支配收入 | 元 | ||||
| 人口密度* | 2020 | 地理国情监测云平台 (http://www.dsac.cn/) | 人/km2 | 1 km |
注:表中带*数据为PLUS模型驱动因素所需数据。 |
表2 综合评价指标体系及指标权重Table 2 The integrated evaluation index system and index weights |
| 宏观系统 | 权重 | 一级指标 | 权重 | 二级指标 | 单位 | 权重 | 指标属性 |
|---|---|---|---|---|---|---|---|
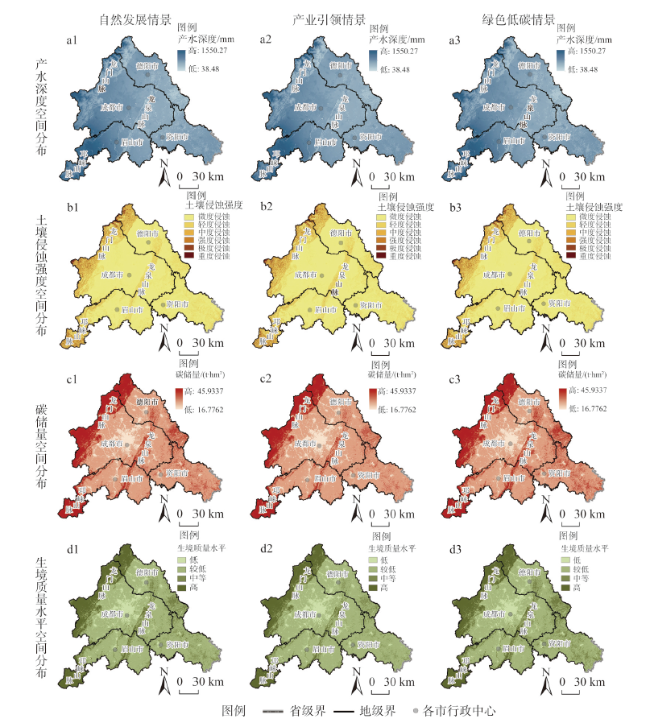
| 生态系统 | 0.5 | 水源涵养服务功能 | 0.12 | 产水深度 | mm | 0.12 | + |
| 土壤保持服务功能 | 0.09 | 土壤侵蚀模数 | t/km2 | 0.09 | - | ||
| 固碳释氧服务功能 | 0.14 | 碳储量 | t/hm2 | 0.14 | + | ||
| 生境质量服务功能 | 0.15 | 生境质量指数 | — | 0.15 | + | ||
| 社会经济系统 | 0.5 | 经济发展指数 | 0.28 | GDP | 亿元 | 0.15 | + |
| 常住人口城镇化率 | % | 0.13 | + | ||||
| 社会发展指数 | 0.22 | 人口规模 | 万人 | 0.10 | + | ||
| 城乡居民人均可支配收入 | 元 | 0.12 | + |
注:+表示正指标,-表示逆指标。某指标值越大评价值越高则为正指标,某指标值越小评价值越高则为逆指标。 |
表3 耦合协调度等级划分标准Table 3 Classification criteria for coupling coordination degree |
| 协调等级 | 失调衰退区间 | 过渡调和区间 | 协调发展区间 | |||||||||
|---|---|---|---|---|---|---|---|---|---|---|---|---|
| 极度失调 | 严重失调 | 中度失调 | 轻度失调 | 濒临失调 | 勉强协调 | 初级协调 | 中级协调 | 良好协调 | 优质协调 | |||
| D值 | (0, 0.1) | [0.1, 0.2) | [0.2, 0.3) | [0.3, 0.4) | [0.4, 0.5) | [0.5, 0.6) | [0.6, 0.7) | [0.7, 0.8) | [0.8, 0.9) | [0.9, 1) | ||
表4 多情景设定Table 4 Settings for multi-simulation scenarios |
| 情景类型 | 发展情况 | 生态保护目标 | 土地利用需求设置 |
|---|---|---|---|
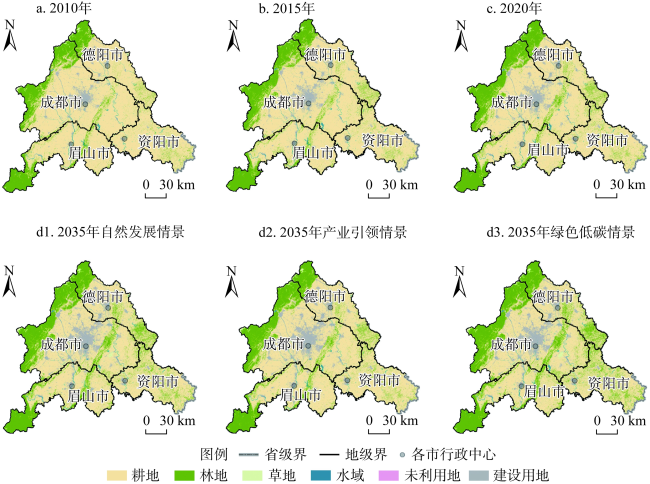
| 自然发展情景 | 以2015—2020年土地利用变化规律为参考,不人为干预各类用地间的转化速率,土地利用需求基本不受政策调整的影响 | 青山绿道蓝网相呼应的城市生态格局基本形成 | 2015—2020年,研究区城镇化进程持续推进,故将相关数据视为2035年自然发展情景下的转移成本矩阵,通过马尔科夫链得到其土地利用需求 |
| 产业引领情景 | 将产业发展作为首要目标,聚焦粮食安全和第二、三产业升级问题。严格保证耕地不减少的同时,建设用地有序扩张 | 保护自然生态系统的基本稳定,提升森林、草原质量 | 调试模型后设定林地、草地转为耕地的概率增加15%,耕地转移为建设用地的概率减少20%,草地、水域、未利用地转为建设用地的概率增加20% |
| 绿色低碳情景 | 将贯彻落实“双碳”战略作为首要目标,聚焦优化生态空间网络和筑牢生态绿色本底问题。重视对林地、草地等高碳汇能力生态系统的保护和修复 | 构筑多层次、网络化、功能复合的“一心一屏三网三环多片”生态空间格局 | 调试模型后设定耕地、水域转移为建设用地的概率降低40%,建设用地转为林地、草地、水域的概率增加20% |
表5 成都都市圈多情景下土地利用转移成本矩阵及邻域因子参数设置Table 5 Cost matrix and neighborhood factor parameter settings for land use transfer under multi-simulation scenarios in Chengdu Metropolitan Area |
| 情景类型 | 2020年土地利用类型 | 2035年土地利用类型转移可能性 | 邻域因子参数 | |||||
|---|---|---|---|---|---|---|---|---|
| 耕地 | 林地 | 草地 | 水域 | 未利用地 | 建设用地 | |||
| 自然发展情景 | 耕地 | 1 | 1 | 1 | 1 | 0 | 1 | 0.075 |
| 林地 | 1 | 1 | 1 | 0 | 0 | 0 | 0.141 | |
| 草地 | 1 | 1 | 1 | 1 | 0 | 1 | 0.182 | |
| 水域 | 1 | 1 | 1 | 1 | 0 | 1 | 0.062 | |
| 未利用地 | 1 | 1 | 1 | 1 | 1 | 1 | 0.060 | |
| 建设用地 | 0 | 1 | 0 | 1 | 0 | 1 | 0.373 | |
| 产业引领情景 | 耕地 | 1 | 0 | 0 | 1 | 0 | 1 | 0.106 |
| 林地 | 1 | 1 | 1 | 0 | 0 | 0 | 0.113 | |
| 草地 | 1 | 1 | 1 | 1 | 0 | 1 | 0.056 | |
| 水域 | 1 | 1 | 0 | 1 | 0 | 1 | 0.067 | |
| 未利用地 | 1 | 1 | 1 | 1 | 1 | 1 | 0.102 | |
| 建设用地 | 0 | 0 | 0 | 0 | 0 | 1 | 0.430 | |
| 绿色低碳情景 | 林地 | 1 | 1 | 1 | 1 | 0 | 1 | 0.047 |
| 林地 | 0 | 1 | 1 | 0 | 0 | 0 | 0.257 | |
| 草地 | 0 | 1 | 1 | 1 | 0 | 0 | 0.305 | |
| 水域 | 0 | 1 | 1 | 1 | 0 | 1 | 0.173 | |
| 未利用地 | 1 | 1 | 1 | 1 | 1 | 1 | 0.071 | |
| 建设用地 | 0 | 1 | 1 | 1 | 0 | 1 | 0.353 | |
表6 成都都市圈2010—2020年社会经济指标赋值及2035年预测值Table 6 Socio-economic indicators values from 2010 to 2020 and predicted values for 2035 in Chengdu Metropolitan Area |
| 指标 | 年份 | 成都市 | 德阳市 | 眉山市 | 资阳市 |
|---|---|---|---|---|---|
| GDP/亿元 | 2010实际值 | 5889.5 | 917.3 | 542.0 | 348.9 |
| 2015实际值 | 10662.3 | 1525.8 | 958.7 | 572.8 | |
| 2020实际值 | 17716.7 | 2404.1 | 1423.7 | 807.5 | |
| 2035预测值 | 43521.3 | 5681.3 | 3127.1 | 1894.7 | |
| 常住人口城镇化率/% | 2010实际值 | 65.8 | 41.3 | 34.1 | 30.7 |
| 2015实际值 | 73.0 | 47.9 | 42.4 | 34.9 | |
| 2020实际值 | 78.8 | 56.0 | 50.1 | 41.3 | |
| 2035预测值 | 88.6 | 75.2 | 72.3 | 73.7 | |
| 人口规模/万人 | 2010实际值 | 1405.5 | 361.7 | 295.2 | 366.5 |
| 2015实际值 | 1685.3 | 348.5 | 297.9 | 347.6 | |
| 2020实际值 | 2094.7 | 345.7 | 295.6 | 231.0 | |
| 2035预测值 | 2200.0 | 341.7 | 310.3 | 325.0 | |
| 城乡居民人均可支配收入/元 | 2010实际值 | 12897.0 | 10396.4 | 9461.78 | 9526.1 |
| 2015实际值 | 25495.0 | 19918.0 | 19575.5 | 19354.0 | |
| 2020实际值 | 37508.0 | 29575.0 | 29311.0 | 28319.0 | |
| 2035预测值 | 74884.3 | 61251.0 | 58800.6 | 59665.4 |
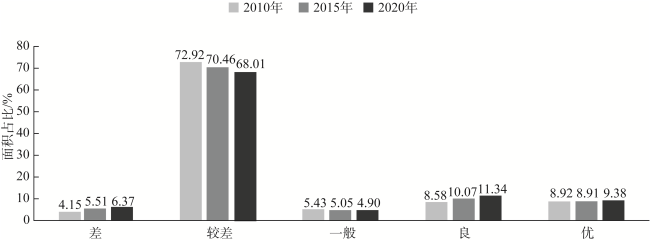
图2 成都都市圈2010—2020年不同等级CES面积占比Fig. 2 Proportion of CES area at different levels from 2010 to 2020 in Chengdu Metropolitan Area |
表7 成都都市圈2010—2020年生态系统与社会经济系统耦合协调发展评价结果Table 7 Coupling coordination development evaluation results of ecosystem and socio-economic system from 2010 to 2020 in Chengdu Metropolitan Area |
| 年份 | 耦合度C值 | 耦合类型 | 耦合协调度D值 | 协调状态 | 协调类型 |
|---|---|---|---|---|---|
| 2010 | 0.47 | 中度耦合 | 0.29 | 中度失调 | 社会经济发展滞后型 |
| 2015 | 0.50 | 中度耦合 | 0.31 | 轻度失调 | 社会经济发展滞后型 |
| 2020 | 0.50 | 中度耦合 | 0.36 | 轻度失调 | 生态发展滞后型 |
图7 成都都市圈2010—2020年土地利用类型及2035年多情景下的模拟土地利用类型Fig. 7 Land use types from 2010 to 2020 and simulated land use types for 2035 under multi-simulation scenarios in Chengdu Metropolitan Area |
图8 成都都市圈2035年多情景下的生态系统服务功能空间分布Fig. 8 Spatial distribution of ecosystem service functions under multiple scenarios in 2035 of Chengdu Metropolitan Area |
表8 成都都市圈2035年多情景下生态系统与社会经济系统耦合协调发展评价结果Table 8 Coupling coordination development evaluation results of ecosystem and socio-economic system of Chengdu Metropolitan Area under multi-simulation scenarios in 2035 |
| 情景类型 | 耦合度C值 | 耦合类型 | 耦合协调度D值 | 协调状态 | 协调类型 |
|---|---|---|---|---|---|
| 自然发展情景 | 0.49 | 中度耦合 | 0.41 | 濒临失调 | 生态发展滞后型 |
| 产业引领情景 | 0.48 | 中度耦合 | 0.39 | 轻度失调 | 生态发展滞后型 |
| 绿色低碳情景 | 0.50 | 中度耦合 | 0.43 | 濒临失调 | 生态发展滞后型 |
| [1] |
人民日报. 绿水青山就是金山银山. http://www.qstheory.cn/qshyjx/2022-09/29/c_1129040861.htm, 2022-09-29.
[People's Daily Comment Department. Clear waters and green mountains. http://www.qstheory.cn/qshyjx/2022-09/29/c_1129040861.htm, 2022-09-29.]
|
| [2] |
四川省人民政府. 成都都市圈发展规划. http://www.sc.gov.cn/10462/zfwjts/2021/11/29/40678782564141e68f4d1d27180befb9/files/d359ac2bcce440c782b597db912491f2.PDF, 2021-11-29.
[Sichuan Provincial People's Government. Development Plan for Chengdu Metropolitan Area. http://www.sc.gov.cn/10462/zfwjts/2021/11/29/40678782564141e68f4d1d27180befb9/files/d359ac2bcce440c782b597db912491f2.PDF, 2021-11-29.]
|
| [3] |
川观新闻. 《成都都市圈发展规划》出炉系全国第三个、中西部唯一都市圈规划. https://baijiahao.baidu.com/s?id=1717774135822544655&wfr=baike, 2021-11-29.
[Chuanguan News "The metropolitan area Development Plan" is the third and only metropolitan area plan in Central and Western China. https://baijiahao.baidu.com/s?id=1717774135822544655&wfr=baike, 2021-11-29.]
|
| [4] |
朱直君, 彭耕, 熊琳, 等. 成都都市圈空间协同策略探讨. 规划师, 2020, 36(19): 79-83.
[
|
| [5] |
王超深. 轨道交通线网影响下的大都市区空间结构模式研究. 西安: 西安建筑科技大学, 2019.
[
|
| [6] |
代鑫, 刘前媛, 唐鹏, 等. 城市群空间结构演变规律及优化方向研究: 以成都平原经济区为例. 城市规划, 2022, 46(10): 104-114.
[
|
| [7] |
崔宏凯, 张林, 王子健, 等. 物流产业发展和区域经济增长的关联效应研究: 基于长江经济带三大都市圈的面板数据. 经济问题, 2021, (3): 78-85.
[
|
| [8] |
庄子薛, 谢梦晴, 张文萍, 等. 基于FLUS-InVEST模型的碳储量时空变迁及多情景模拟预测: 以成德眉资地区为例. 风景园林, 2022, 29(5): 38-44.
[
|
| [9] |
孔凡斌, 杨文才, 徐彩瑶. 环杭州湾城市群生态环境与社会经济耦合协调关系及其影响因素. 生态学报, 2023, 43(6): 2287-2297.
[
|
| [10] |
秦晓川, 付碧宏. 青岛都市圈生态系统服务—经济发展时空协调性分析及优化利用. 生态学报, 2020, 40(22): 8251-8264.
[
|
| [11] |
孙久文, 崔雅琪, 张皓. 黄河流域城市群生态保护与经济发展耦合的时空格局与机制分析. 自然资源学报, 2022, 37(7): 1673-1690.
[
|
| [12] |
马世骏, 王如松. 社会—经济—自然复合生态系统. 生态学报, 1984, 4(1): 1-9.
[
|
| [13] |
赵武生, 石培基. 基于InVEST模型的复合生态系统耦合协调关系研究: 以兰西城市群为例. 中国环境科学, 2023, 43(4): 1883-1894.
[
|
| [14] |
|
| [15] |
白娥, 薛冰. 土地利用与土地覆盖变化对生态系统的影响. 植物生态学报, 2020, 44(5): 543-552.
[
|
| [16] |
|
| [17] |
|
| [18] |
|
| [19] |
成都社会科学在线. 成都都市圈是个什么“圈”?. http://www.cdsk.org.cn/detail.jsp?id=24855, 2022-05-24.
[Chengdu Social Science Online. What is metropolitan area?. http://www.cdsk.org.cn/detail.jsp?id=24855, 2022-05-24.]
|
| [20] |
四川省统计局. 四川统计年鉴2020. http://tjj.sc.gov.cn/tjnj/cs/2020/zk/indexce.htm, 2021.
[Sichuan Provincial Bureau of Statistics. Sichuan Statistical Yearbook 2020. http://tjj.sc.gov.cn/tjnj/cs/2020/zk/indexce.htm, 2021.]
|
| [21] |
|
| [22] |
四川省统计局. 四川统计年鉴2010. http://tjj.sc.gov.cn/scstjj/c105855/nj.shtml, 2011.
[Sichuan Provincial Bureau of Statistics. Sichuan Statistical Yearbook 2010. http://tjj.sc.gov.cn/scstjj/c105855/nj.shtml, 2011.]
|
| [23] |
四川省统计局. 四川统计年鉴2015. http://tjj.sc.gov.cn/tjnj/cs/2015/zk/indexce.htm, 2016.
[Sichuan Provincial Bureau of Statistics. Sichuan Statistical Yearbook 2015. http://tjj.sc.gov.cn/tjnj/cs/2015/zk/indexce.htm, 2016.]
|
| [24] |
胡影, 冯晓明, 巩杰. 基于生态系统服务的宁夏回族自治区自然—社会经济协调性分析. 生态学报, 2022, 42(16): 6523-6533.
[
|
| [25] |
杨培峰, 焦泽飞. 生态—社会经济系统耦合方法在县域国土空间生态修复规划中的运用: 以四川威远县为例. 自然资源学报, 2021, 36(9): 2308-2319.
[
|
| [26] |
刘宇. 基于InVEST模型的喀斯特地区茶园生态系统服务功能评估: 以云南省广南县为例. 昆明: 云南大学, 2021.
[
|
| [27] |
周彬, 余新晓, 陈丽华, 等. 基于InVEST模型的北京山区土壤侵蚀模拟. 水土保持研究, 2010, 17(6): 9-13, 19.
[
|
| [28] |
张梦迪, 张芬, 李雄. 基于InVEST模型的生境质量评价: 以北京市通州区为例. 风景园林, 2020, 27(6): 95-99.
[
|
| [29] |
滕雅丽, 谢苗苗, 王回茴, 等. 资源型城市土地利用转型及其对生境质量的影响: 以乌海市为例. 生态学报, 2022, 42(19): 7941-7951.
[
|
| [30] |
任胤铭, 刘小平, 许晓聪, 等. 基于FLUS-InVEST模型的京津冀多情景土地利用变化模拟及其对生态系统服务功能的影响研究. 生态学报, 2023, 43(11): 1-15.
[
|
| [31] |
熊曦, 肖俊. 武陵山片区城镇化与生态环境耦合协调度时空分异: 以六个中心城市为例. 生态学报, 2021, 41(15): 5973-5987.
[
|
| [32] |
中共四川省委、 四川省人民政府. 《关于推动成德眉资同城化发展的指导意见》. http://jhj.sc.gov.cn/scjhj/qyhz/2020/8/3/0355a02de0574313bc175d4a444e8cfe.shtml.
[Sichuan Provincial Committee of the Communist Party of China, Sichuan Provincial People's Government. Guiding opinions on promoting the development of urban integration of Chengdu, Deyang, Meishan and Ziyang. http://jhj.sc.gov.cn/scjhj/qyhz/2020/8/3/0355a02de0574313bc175d4a444e8cfe.shtml.]
|
/
| 〈 |
|
〉 |