
县域包容性增长测度及其对乡村振兴的启示
|
林万龙(1973-),男,江西南康人,博士,教授,博士生导师,研究方向为农业经济理论与政策。E-mail: linwanlong@vip.163.com |
收稿日期: 2023-01-30
修回日期: 2023-04-11
网络出版日期: 2023-08-24
基金资助
国家自然科学基金委应急管理项目(7214100349)
国家社会科学基金重大项目(20ZDA073)
The measurement of inclusive growth at the county-level and its implications for rural revitalization
Received date: 2023-01-30
Revised date: 2023-04-11
Online published: 2023-08-24
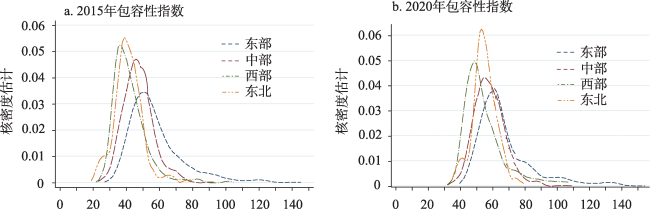
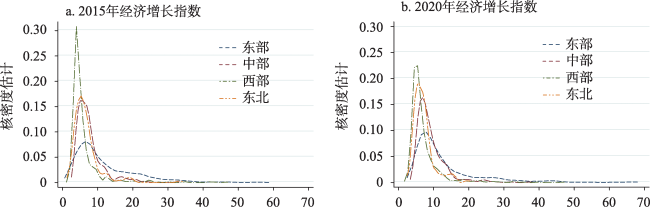
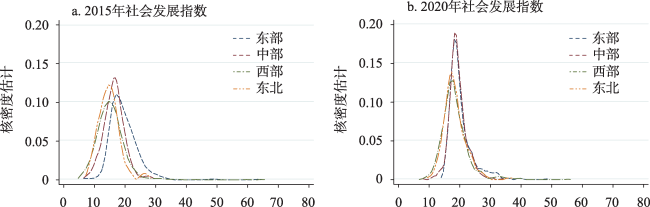
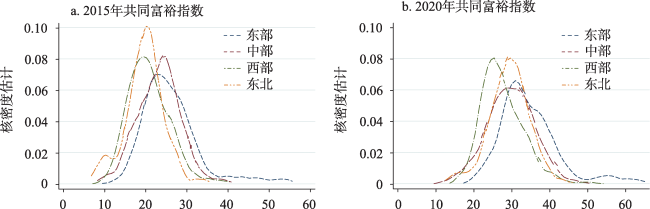
县域的包容性增长是破解新时代三农问题,全面推进乡村振兴的重要实现路径。研究基于2015年和2020年县域数据,从经济增长、社会发展和共同富裕三个维度构建县域包容性增长评价指标体系,运用熵权TOPSIS法、Kernel核密度估计、泰尔指数等方法对县域包容性增长水平进行了测度和分析。研究发现:(1)2015—2020年中国县域包容性增长水平呈上升趋势,呈现东部>中部>东北>西部的格局。从增长速度来看,东北和西部地区的增速领先于东部地区和中部地区。脱贫县及国家乡村振兴重点帮扶县的包容性增长水平落后于全国均值水平。(2)2015—2020年中国县域包容性增长水平总体差异减小。其中,区域内部差异是其主要来源。(3)县域包容性增长水平呈现“东部地区高水平差异、中西部地区低水平均衡”状态。对东部和西部差异来源分解发现,东部地区差异主要来自于省际差异,西部地区差异则主要来自于省内差异。(4)障碍因子识别结果显示,每万人社会福利收养性单位床位数、规模以上工业企业数量、人均公共预算收入、二三产业从业人员占总人口比例、每万人医疗机构床位数以及农村居民人均可支配收入占人均GDP比例是当前县域包容性增长的主要障碍指标。在此基础上,研究从发展壮大县域经济、扩展和提升农户发展机会、增强产业发展的包容性以及统筹推进县域协调发展方面提出了对乡村振兴的启示与相关建议。
林万龙 , 米晶 . 县域包容性增长测度及其对乡村振兴的启示[J]. 自然资源学报, 2023 , 38(8) : 2117 -2134 . DOI: 10.31497/zrzyxb.20230812
Inclusive growth in counties is an important realization path to reslove the rural issues in the New Era and comprehensively promote rural revitalization. Based on the county data in 2015 and 2020, this paper constructs a county inclusive growth evaluation index system from the three dimensions of economic growth, social development, and common prosperity. The study uses the entropy-weighted TOPSIS method, kernel density estimation, and Thiel index to analyze the level of inclusive growth in counties. The research finds that: (1) From 2015 to 2020, the inclusive growth level of counties in China showed an upward trend, presenting a pattern of eastern > central > northeastern > western region. In terms of growth rate, the northeastern and western regions are ahead of the eastern and central regions. The inclusive growth level of poverty alleviation counties and key counties assisted by the national rural revitalization was below the national average. (2) The overall difference in the level of inclusive growth in China's counties between 2015 and 2020 decreased from 0.0364 to 0.0258, with intra-regional differences being the main source. In terms of dimensions, the economic growth has the largest variation, while the social development and common prosperity variation have the smaller variation. (3) The inclusive growth level of the county shows a pattern of "high-level difference in the eastern region and low-level balance in the central and western regions". The decomposition of the sources of differences between the east and the west shows that the differences in the eastern region mainly come from inter-provincial differences, and the differences in the western region mainly come from intra-provincial differences. (4) The identification results of obstacle factors show that the number of beds of social welfare adoption units per 10000 people, the number of industrial enterprises above designated size, the per capita public budget revenue, the proportion of employees in the secondary and tertiary industries in the total population, the number of beds in medical institutions per 10000 people, and the per capita disposable income of rural residents as a proportion of per capita GDP are the main obstacles to the inclusive growth of the county. On this basis, the study puts forward enlightenment and relevant suggestions for comprehensively promoting rural revitalization from the aspects of developing and expanding the county economy, enhancing the accessibility of public services for rural households, promoting the wide sharing of economic results, and enhancing the coordinated development of the county.
表1 县域包容性增长水平评价指标体系Table 1 Evaluation index system of county inclusive growth level |
| 一级指标 | 二级指标 | 三级指标 | 指标属性 |
|---|---|---|---|
| 经济增长 | A1 经济总量 | X1 人均GDP | 正向 |
| A2 财政水平 | X2 人均公共预算收入 | 正向 | |
| A3 产业发展 | X3 第一产业生产总值/总产值 | 负向 | |
| X4 第三产业生产总值/总产值 | 正向 | ||
| X5 规模以上工业企业数量 | 正向 | ||
| A4 金融水平 | X6 年末金融机构各项贷款余额/GDP | 正向 | |
| X7 人均储蓄余额 | 正向 | ||
| 社会发展 | A5 教育 | X8 平均受教育年限 | 正向 |
| A6 医疗 | X9 每万人医疗机构床位数 | 正向 | |
| A7 社会保障 | X10 每万人社会福利收养性单位床位数 | 正向 | |
| X11 县城燃气普及率 | 正向 | ||
| X12 县城供水普及率 | 正向 | ||
| A8 基础设施 与公共环境 | X13 污水处理率 | 正向 | |
| X14 建成区绿化覆盖率 | 正向 | ||
| X15 生活垃圾处理率 | 正向 | ||
| 共同富裕 | A9 收入水平 | X16 城镇居民人均可支配收入 | 正向 |
| X17 农村居民人均可支配收入 | 正向 | ||
| A10 城乡差距 | X18 城乡居民人均可支配收入比 | 负向 | |
| A11 成果共享 | X19 二三产业从业人员/总人口 | 正向 | |
| X20 农村居民人均可支配收入/人均GDP | 正向 |
表2 县域包容性增长水平测度结果Table 2 Measurement results of county inclusive growth level |
| 地区 | 省份 | 经济增长 | 社会发展 | 共同富裕 | 包容指数 | 县域数量/个 | |||||||
|---|---|---|---|---|---|---|---|---|---|---|---|---|---|
| 2015年 | 2020年 | 2015年 | 2020年 | 2015年 | 2020年 | 2015年 | 2020年 | ||||||
| 东部地区 | 浙江 | 20.09 | 25.38 | 22.58 | 26.12 | 37.60 | 48.51 | 80.27 | 99.66 | 50 | |||
| 江苏 | 21.74 | 22.65 | 20.89 | 22.63 | 28.98 | 37.85 | 72.52 | 82.73 | 41 | ||||
| 山东 | 12.27 | 14.95 | 19.70 | 20.30 | 25.40 | 33.86 | 60.05 | 66.43 | 87 | ||||
| 福建 | 10.42 | 12.16 | 18.08 | 20.04 | 24.12 | 31.62 | 52.62 | 63.81 | 57 | ||||
| 广东 | 8.11 | 8.80 | 15.38 | 17.20 | 25.00 | 32.17 | 48.49 | 58.16 | 67 | ||||
| 河北 | 6.86 | 8.26 | 21.55 | 19.26 | 23.72 | 32.13 | 52.13 | 60.28 | 124 | ||||
| 海南 | 6.06 | 8.88 | 15.70 | 18.95 | 19.17 | 27.24 | 40.28 | 52.68 | 15 | ||||
| 东部均值 | 12.03 | 12.95 | 19.65 | 20.33 | 26.21 | 34.64 | 57.89 | 67.92 | 441 | ||||
| 中部地区 | 山西 | 5.79 | 8.02 | 16.05 | 17.85 | 18.33 | 23.55 | 40.17 | 49.61 | 91 | |||
| 湖南 | 6.84 | 9.07 | 16.10 | 19.49 | 22.94 | 30.75 | 45.88 | 59.31 | 87 | ||||
| 湖北 | 8.50 | 9.01 | 17.66 | 20.85 | 25.55 | 31.36 | 51.70 | 61.22 | 66 | ||||
| 安徽 | 9.94 | 10.72 | 18.83 | 21.05 | 26.77 | 33.13 | 55.54 | 64.58 | 61 | ||||
| 河南 | 8.13 | 8.69 | 13.07 | 18.23 | 23.30 | 29.61 | 44.51 | 56.53 | 109 | ||||
| 江西 | 7.20 | 9.43 | 18.77 | 19.77 | 24.51 | 31.54 | 50.47 | 60.74 | 79 | ||||
| 中部均值 | 7.59 | 9.04 | 16.40 | 19.33 | 23.24 | 29.67 | 47.23 | 58.04 | 493 | ||||
| 西部地区 | 内蒙古 | 10.05 | 10.74 | 18.70 | 19.48 | 21.11 | 30.79 | 50.55 | 60.45 | 82 | |||
| 陕西 | 5.81 | 7.43 | 16.42 | 20.63 | 19.01 | 24.58 | 41.25 | 52.64 | 85 | ||||
| 青海 | 5.74 | 5.51 | 15.25 | 17.20 | 17.17 | 25.17 | 38.17 | 47.88 | 39 | ||||
| 甘肃 | 5.30 | 6.41 | 12.73 | 16.11 | 19.64 | 25.84 | 37.67 | 48.36 | 71 | ||||
| 宁夏 | 6.74 | 7.86 | 14.37 | 18.22 | 19.18 | 26.43 | 40.29 | 52.51 | 13 | ||||
| 新疆 | 6.23 | 8.30 | 17.03 | 19.89 | 19.38 | 25.48 | 42.65 | 53.67 | 80 | ||||
| 重庆 | 4.82 | 6.62 | 18.64 | 20.16 | 22.76 | 29.14 | 46.23 | 55.92 | 14 | ||||
| 四川 | 5.35 | 7.26 | 17.12 | 19.26 | 24.75 | 31.88 | 47.22 | 58.40 | 137 | ||||
| 贵州 | 5.48 | 5.80 | 12.14 | 17.19 | 19.84 | 26.64 | 37.46 | 49.63 | 77 | ||||
| 云南 | 4.75 | 6.20 | 13.12 | 16.82 | 19.16 | 25.19 | 37.02 | 48.20 | 117 | ||||
| 广西 | 4.57 | 5.52 | 14.47 | 18.00 | 21.87 | 29.15 | 40.91 | 52.67 | 79 | ||||
| 西部均值 | 5.92 | 7.04 | 15.36 | 18.42 | 20.68 | 27.57 | 41.96 | 53.04 | 794 | ||||
| 东北地区 | 吉林 | 7.01 | 7.11 | 16.46 | 20.07 | 17.71 | 27.27 | 41.19 | 54.20 | 39 | |||
| 黑龙江 | 4.87 | 6.22 | 13.39 | 17.93 | 18.94 | 28.55 | 37.19 | 52.82 | 63 | ||||
| 辽宁 | 8.26 | 9.10 | 15.30 | 17.51 | 22.42 | 32.61 | 46.83 | 58.15 | 43 | ||||
| 东北均值 | 6.70 | 7.07 | 14.78 | 18.38 | 19.64 | 29.41 | 41.12 | 54.77 | 145 | ||||
| 特殊类型县 | 脱贫县 | 4.76 | 5.87 | 15.04 | 17.89 | 19.44 | 25.41 | 39.24 | 49.74 | 735 | |||
| 重点帮扶县 | 4.10 | 4.65 | 13.51 | 16.49 | 20.00 | 25.07 | 37.62 | 46.94 | 154 | ||||
| 全国均值 | — | 7.86 | 8.96 | 16.60 | 19.11 | 22.57 | 29.93 | 47.03 | 57.99 | 1873 | |||
表3 县域包容性增长水平区域差异及来源Table 3 Regional differences and sources of county inclusiveness index |
| 年份 | 总体差异 | 地区内差异 | 地区间差异 | |||||
|---|---|---|---|---|---|---|---|---|
| 总体 | 东部 | 中部 | 西部 | 东北 | ||||
| 包容性指数 | 2015 | 0.0364 | 0.0274 | 0.0111 | 0.0048 | 0.0101 | 0.0014 | 0.0090 |
| (75.19) | (30.49) | (13.19) | (27.75) | (5.11) | (24.81) | |||
| 2020 | 0.0258 | 0.0208 | 0.0093 | 0.0037 | 0.0072 | 0.0007 | 0.0050 | |
| (80.70) | (35.87) | (14.31) | (27.89) | (2.63) | (19.30) | |||
| 经济增长指数 | 2015 | 0.2250 | 0.1814 | 0.0818 | 0.0263 | 0.0643 | 0.0089 | 0.0436 |
| (80.61) | (36.36) | (11.70) | (28.57) | (3.98) | (19.39) | |||
| 2020 | 0.1808 | 0.1479 | 0.0818 | 0.0263 | 0.0643 | 0.0089 | 0.0329 | |
| (81.81) | (40.48) | (12.63) | (26.30) | (2.40) | (18.19) | |||
| 社会发展指数 | 2015 | 0.0385 | 0.0330 | 0.0075 | 0.0057 | 0.0180 | 0.0018 | 0.0055 |
| (85.76) | (19.38) | (14.85) | (46.79) | (4.74) | (14.24) | |||
| 2020 | 0.0209 | 0.0201 | 0.0046 | 0.0030 | 0.0112 | 0.0014 | 0.0008 | |
| (96.09) | (21.75) | (14.29) | (53.49) | (6.57) | (3.91) | |||
| 共同富裕指数 | 2015 | 0.0351 | 0.0299 | 0.0097 | 0.0071 | 0.0110 | 0.0020 | 0.0052 |
| (85.10) | (27.74) | (20.35) | (31.21) | (5.81) | (14.90) | |||
| 2020 | 0.0262 | 0.0221 | 0.0068 | 0.0060 | 0.0081 | 0.0013 | 0.0041 | |
| (84.19) | (25.78) | (22.80) | (30.71) | (4.91) | (15.81) | |||
注:括号内数值为贡献率,单位为%,下同。 |
表4 2020年东部地区包容性增长水平区域差异及来源Table 4 Regional differences and sources of inclusive growth levels in eastern region in 2020 |
| 总体差异 | 省份内部差异 | 省际差异 | |||||||
|---|---|---|---|---|---|---|---|---|---|
| 总体 | 浙江 | 江苏 | 山东 | 福建 | 广东 | 河北 | 海南 | ||
| 0.0336 | 0.0160 | 0.0046 | 0.0025 | 0.0023 | 0.0016 | 0.0019 | 0.0029 | 0.0001 | 0.0176 |
| (47.63) | (13.74) | (7.44) | (6.96) | (4.70) | (5.71) | (8.72) | (0.35) | (52.37) | |
表5 2020年西部地区包容性增长水平区域差异及来源Table 5 Regional differences and sources of inclusive growth levels in the western region in 2020 |
| 总体差异 | 省区内部差异 | 省际差异 | ||||||
|---|---|---|---|---|---|---|---|---|
| 总体 | 内蒙古 | 陕西 | 青海 | 甘肃 | 宁夏 | 新疆 | ||
| 0.0186 | 0.0153 (82.28) | 0.0028 | 0.0014 | 0.0005 | 0.0020 | 0.0003 | 0.0016 | 0.0033 (17.72) |
| (15.06) | (7.77) | (2.81) | (10.69) | (1.60) | (8.35) | |||
| 重庆 | 四川 | 贵州 | 云南 | 广西 | ||||
| 0.0001 | 0.0030 | 0.0007 | 0.0024 | 0.0006 | ||||
| (0.38) | (15.97) | (3.73) | (12.66) | (3.26) | ||||
表6 县域包容性增长水平子准则层障碍度Table 6 Obstacle degree of sub-criteria for inclusive growth level at county level |
| 指标 | 年份 | 指标 | 年份 | ||
|---|---|---|---|---|---|
| 2015 | 2020 | 2015 | 2020 | ||
| A1 经济总量 | 6.41 | 6.63 | A7 社会保障 | 18.46 | 19.43 |
| A2 财政水平 | 10.32 | 10.87 | A8 基础设施与公共环境 | 4.04 | 3.26 |
| A3 金融水平 | 6.45 | 6.36 | A9 收入水平 | 14.55 | 12.47 |
| A4 产业发展 | 14.17 | 14.97 | A10 城乡差距 | 0.19 | 0.17 |
| A5 教育水平 | 0.33 | 0.31 | A11 成果共享 | 16.86 | 17.33 |
| A6 医疗水平 | 8.22 | 8.19 | — | — | — |
表7 县域包容性增长水平指标障碍度Table 7 Obstacle degree of county inclusive growth level index |
| 指标 | 年份 | 指标 | 年份 | ||
|---|---|---|---|---|---|
| 2015 | 2020 | 2015 | 2020 | ||
| X1 人均GDP | 6.41 | 6.63 | X11 县城燃气普及率 | 0.87 | 0.50 |
| X2 人均公共预算收入 | 10.32 | 10.87 | X12 县城供水普及率 | 0.07 | 0.04 |
| X3 第一产业生产总值/总产值 | 0.15 | 0.16 | X13 污水处理率 | 0.26 | 0.18 |
| X4 第三产业生产总值/总产值 | 0.48 | 0.42 | X14 建成区绿化覆盖率 | 2.80 | 2.54 |
| X5 规模以上工业企业数量 | 13.54 | 15.40 | X15 生活垃圾处理率 | 0.04 | 0.04 |
| X6 年末金融机构各项贷款余额/GDP | 2.83 | 2.90 | X16 城镇居民人均可支配收入 | 6.50 | 5.50 |
| X7 人均储蓄余额 | 3.63 | 3.47 | X17 农村居民人均可支配收入 | 8.05 | 6.97 |
| X8 平均受教育年限 | 0.33 | 0.31 | X18 城乡居民人均可支配收入比 | 0.19 | 0.17 |
| X9 每万人医疗机构床位数 | 8.22 | 8.19 | X19 二三产业从业人员/总人口 | 9.57 | 10.00 |
| X10 每万人社会福利收养性单位床位数 | 18.46 | 19.43 | X20 农民人均可支配收入/人均GDP | 7.29 | 7.34 |
表8 不同包容性增长水平等级县域的主要障碍因素排序Table 8 Main obstacles in counties at different levels of inclusive growth |
| 包容性等级 | 障碍因素排序 | |||||
|---|---|---|---|---|---|---|
| 1 | 2 | 3 | 4 | 5 | 6 | |
| Ⅰ级 | X10 | X5 | X19 | X2 | X9 | X17 |
| Ⅱ级 | X10 | X5 | X2 | X19 | X9 | X17 |
| Ⅲ级 | X10 | X5 | X2 | X19 | X9 | X17 |
| Ⅳ级 | X10 | X5 | X2 | X19 | X9 | X20 |
| Ⅴ级 | X10 | X5 | X2 | X19 | X20 | X9 |
| [1] |
高强, 薛洲. 以县域城乡融合发展引领乡村振兴: 战略举措和路径选择. 经济纵横, 2022, (12): 17-24.
[
|
| [2] |
黄振华. 县域、县城与乡村振兴. 理论与改革, 2022, (4): 156-165, 168.
[
|
| [3] |
中华人民共和国农业农村部. 县域内城乡产业融合发展模式实践探索. http://www.zcggs.moa.gov.cn, 2021-12-23.
[ Ministry of Agriculture and Rural Affairs of the People's Republic of China. Practice and exploration of urban and rural industrial integration development model in the county. http://www.zcggs.moa.gov.cn, 2021-12-23.]
|
| [4] |
杜志雄. 坚持城乡融合, 推动县域经济高质量发展. 农业经济与管理, 2022, (6): 1-4.
[
|
| [5] |
中华人民共和国农业农村部农业农村部. 县域城乡融合发展问题研究报告. http://www.zcggs.moa.gov.cn, 2021-12-23.
[ Ministry of Agriculture and Rural Affairs of the People's Republic of China. Research report on the integrated development of urban and rural areas in county. http://www.zcggs.moa.gov.cn, 2021-12-23.]
|
| [6] |
林万龙, 纪晓凯. 从摆脱绝对贫困走向农民农村共同富裕. 中国农村经济, 2022, (8): 2-15.
[
|
| [7] |
杜志雄, 肖卫东, 詹琳. 包容性增长理论的脉络、要义与政策内涵. 中国农村经济, 2010, (11): 4-14.
[
|
| [8] |
蔡荣鑫. “包容性增长”理念的形成及其政策内涵. 经济学家, 2009, (1): 102-104.
[
|
| [9] |
范永忠, 范龙昌. 包容性增长理念及现实意义. 理论与改革, 2010, (6): 85-86.
[
|
| [10] |
张国献. 当前国内包容性增长研究述评. 现代经济探讨, 2011, (2): 56-60.
[
|
| [11] |
|
| [12] |
于敏, 王小林. 中国经济的包容性增长: 测量与评价. 经济评论, 2012, (3): 30-38.
[
|
| [13] |
魏婕, 任保平. 中国经济增长包容性的测度: 1978—2009. 中国工业经济, 2011, (12): 5-14.
[
|
| [14] |
马强文, 任保平. 包容性增长测度及影响因素分析: 基于经济可持续的视角. 中国人口·资源与环境, 2012, 22(7): 101-108.
[
|
| [15] |
黎蔺娴, 边恕. 经济增长、收入分配与贫困: 包容性增长的识别与分解. 经济研究, 2021, 56(2): 54-70.
[
|
| [16] |
赵川, 程广斌, 李祎. 中国城市包容性增长: 空间集聚、区域差异及收敛特征. 软科学, 2023, http://kns.cnki.net/kcms/detail/51.1268.g3.20230315.1445.002.html.
[
|
| [17] |
张勋, 万广华. 中国的农村基础设施促进了包容性增长吗?. 经济研究, 2016, 51(10): 82-96.
[
|
| [18] |
江鑫, 黄乾. 乡村公路、人口城市化和乡村包容性经济增长. 南方经济, 2020, (4): 62-83.
[
|
| [19] |
黄倩, 李政. 县域普惠金融发展与经济包容性增长: 基于云南省120个县域数据的实证分析. 云南财经大学学报, 2019, 35(1): 52-66.
[
|
| [20] |
白晶洁, 张峁. 普惠金融发展、区域收敛与包容性经济增长: 基于辽宁省44县(市/区)数据的实证研究. 征信, 2018, 36(3): 20-26.
[
|
| [21] |
张大鹏, 陈池波. 旅游发展促进了连片特困地区的包容性增长吗: 来自中部贫困县的证据. 农业技术经济, 2020, (4): 107-116.
[
|
| [22] |
范轶琳, 吴晓波. 包容性增长研究述评. 经济管理, 2011, 33(9): 180-184.
[
|
| [23] |
林毅夫, 庄巨惠, 汤敏, 等. 以共享式增长促进社会和谐. 北京: 中国计划出版社, 2008: 40-88.
[
|
| [24] |
刘荣. 双循环经济增长的新空间:中国县域经济的包容性增长. 北京: 社会科学文献出版社, 2022: 107-121.
[
|
| [25] |
李晓园, 陈武. 我国县域经济包容性增长评价及启示: 基于苏赣陕三省的数据分析. 江西社会科学, 2014, 34(9): 44-50.
[
|
| [26] |
陈光春, 马国群. 边境县域经济包容性发展系统仿真研究: 以广西东兴市为例. 社会科学家, 2016, (11): 65-70.
[
|
| [27] |
|
| [28] |
文建东, 李慧, 石韵珞. 经济增长质量的测度与分析: 以县域经济为例. 湖北社会科学, 2012, (7): 72-79.
[
|
| [29] |
周扬, 郭远智, 刘彦随. 中国县域贫困综合测度及2020年后减贫瞄准. 地理学报, 2018, 73(8): 1478-1493.
[
|
| [30] |
曹丽哲, 潘玮, 公丕萍, 等. 中国县域经济发展活力的区域格局. 经济地理, 2021, 41(4): 30-37.
[
|
| [31] |
化祥雨, 金祥荣, 吕海萍, 等. 高质量发展耦合协调时空格局演化及影响因素: 以浙江省县域为例. 地理科学, 2021, 41(2): 223-231.
[
|
| [32] |
朱玲, 何伟. 脱贫农户的社会流动与城乡公共服务. 经济研究, 2022, 57(3): 25-48.
[
|
| [33] |
吕光明, 陈欣悦. 县域基本公共服务均等化的测度与结构解析. 财政研究, 2022, (4): 52-68.
[
|
| [34] |
孙永胜, 佟连军. 吉林省限制开发区域资源环境承载力综合评价. 自然资源学报, 2021, 36(3): 634-645.
[
|
| [35] |
王淑婧, 李俊峰. 长三角城市群高质量绿色发展的均衡性特征及障碍因素. 自然资源学报, 2022, 37(6): 1540-1554.
[
|
| [36] |
刘宇峰, 原志华, 郭玲霞, 等. 陕西省城市绿色增长水平时空演变特征及影响因素解析. 自然资源学报, 2022, 37(1): 200-220.
[
|
/
| 〈 |
|
〉 |