
市域国土空间碳排放测算及低碳化发展效率差异
|
张振龙(1980-),男,河北平山人,博士,副教授,研究方向为国土空间规划、城乡规划技术与方法。E-mail: zhenlongzhang@163.com |
收稿日期: 2022-08-08
修回日期: 2023-03-30
网络出版日期: 2023-06-09
基金资助
江苏高校优势学科(城乡规划学)建设工程项目
国家一流专业(城乡规划)建设项目
江苏省研究生科研与实践创新计划项目(SJCX22_1547)
Calculation of carbon emissions and the difference of low-carbon development efficiency on city territorial space
Received date: 2022-08-08
Revised date: 2023-03-30
Online published: 2023-06-09
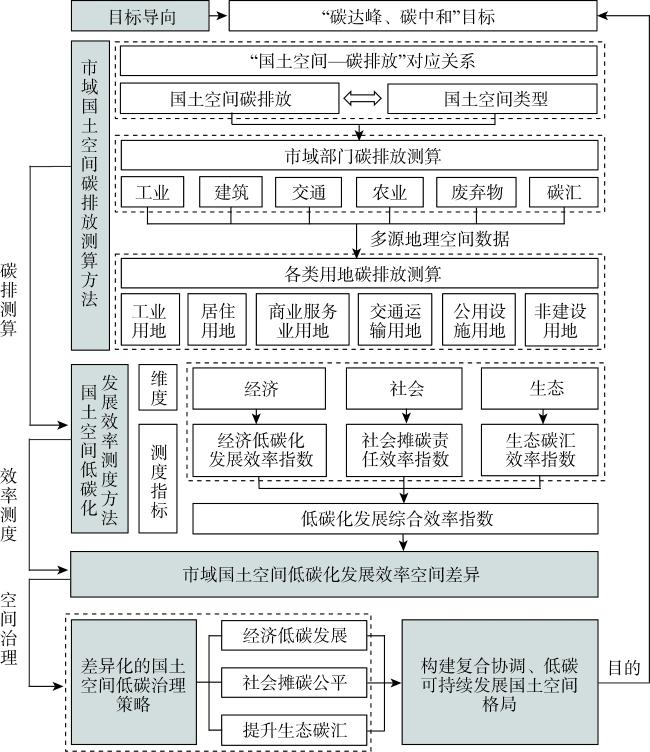
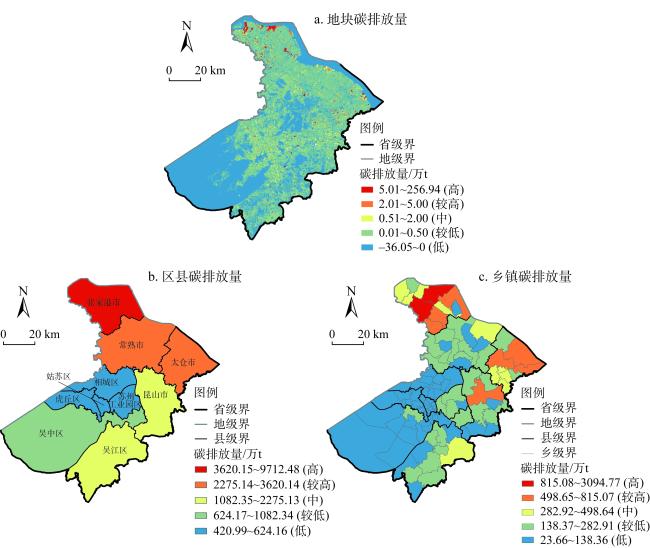
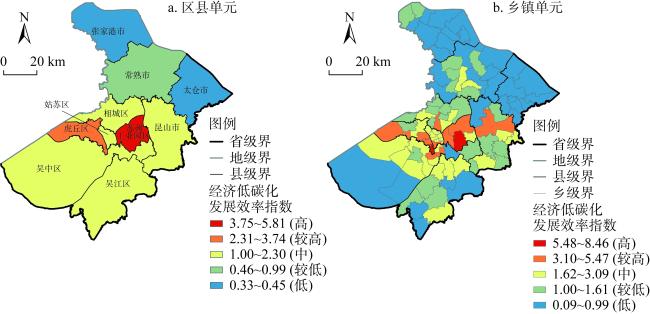
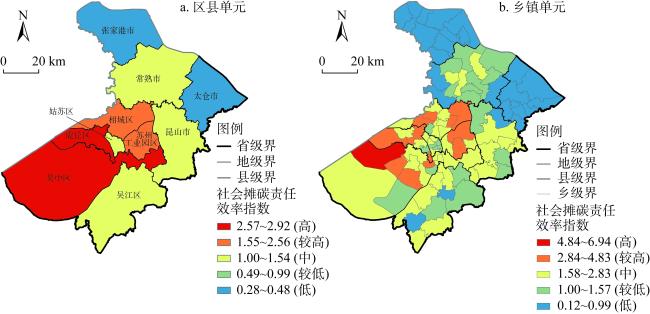
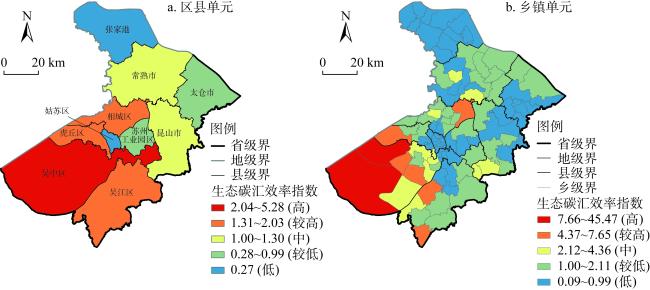
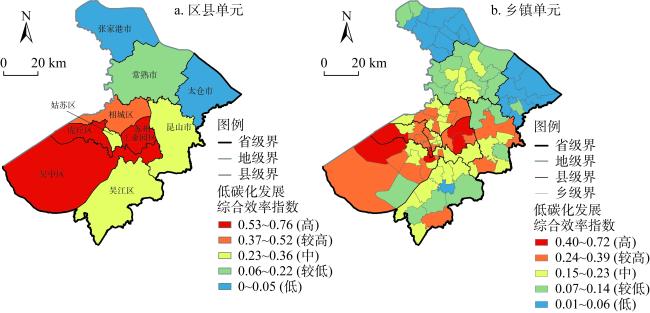
国土空间低碳化发展为实现“双碳”战略目标提供基础。市域空间是国土空间规划兼具目标传导与战略落实双重属性的关键地域单元,揭示市域国土空间碳排放特征及其低碳化发展效率的空间差异对于塑造绿色低碳的国土空间格局具有重要意义。研究探索国土空间碳排放测算方法,从经济、社会、生态三个维度分析市域国土空间低碳化发展效率的空间差异特征,进一步提出面向空间治理的优化策略,并以苏州市为例进行了实证分析。结果表明:(1)构建的市域国土空间碳排放测算方法及低碳化发展模型能够有效测度市域碳排放特征及其低碳化发展效率空间差异。(2)苏州市2020年碳排放总量为2.38亿t,碳排放量高值地块集中分布在各类工业集聚区内,低值地块分散分布在乡镇地带以及各类碳汇主体地区。国土空间低碳化发展效率在不同尺度上均有明显差异,区县尺度主要表现出地域差异,乡镇尺度具有城乡差异。同时,经济社会发展水平相对较高的地区,其经济、社会低碳化发展效率也较高,但生态低碳化发展效率往往较低。(3)根据区县、乡镇不同空间类型,促进经济社会的绿色发展转型,发挥国土空间规划减排固碳的作用,构建复合协调、低碳可持续的国土空间格局。
张振龙 , 侯琰珍 , 孙鸿鹄 . 市域国土空间碳排放测算及低碳化发展效率差异[J]. 自然资源学报, 2023 , 38(6) : 1464 -1481 . DOI: 10.31497/zrzyxb.20230606
Low-carbon development of territorial space provides the basis for realizing the strategic goal of the carbon peak and the carbon neutrality. The city region is a key regional unit with dual attributes of target transmission and strategy implementation in territorial space. It is of great significance to promote the realization of the "dual carbon" goal and to reveal the level of carbon emissions and spatial difference of low-carbon development efficiency of territorial spatial in cities for shaping the low-carbon sustainable territorial spatial pattern. This study explored the methodological system for measuring carbon emissions in territorial space, analyzed the characteristics of spatial differences in the efficiency of low-carbon development in city territorial space from economic, social and ecological dimensions based on the measurement results, further proposed a spatial governance-oriented optimization strategy, and finally conducted an empirical analysis using Suzhou city as an example. The results showed that: (1) The built carbon emission measurement method and low-carbonization development model of city territorial space can effectively measure the carbon emission characteristics of Suzhou city and its spatial differences in low-carbonization development efficiency. (2) The total carbon emissions in Suzhou in 2020 were 238 million tons, and the high-value parcels of carbon emissions were concentrated in various industrial agglomerations, while the low-value parcels were dispersedly distributed in the rural areas and the main areas of various carbon sinks. The development efficiency of territorial spatial low-carbonization varied significantly at different scales, mainly reflecting regional differences at the county and district scales and urban-rural differences at the township scale. Meanwhile, regions with relatively high levels of economic and social development had higher economic and social low-carbonization development efficiency, but ecological low-carbonization development efficiency was often lower. (3) According to the different spatial types of districts and townships, this paper promotes the transformation of green development of economy and society, bringing into play the role of territorial spatial planning in emission reduction and carbon sequestration, and building a composite and coordinated, low-carbon and sustainable territorial spatial pattern.
表1 研究数据来源Table 1 Description of research data sources |
| 数据类型 | 具体数据 | 数据内容 | 数据来源 |
|---|---|---|---|
| 统计数据 | 能源数据 | 工业企业分行业能源消费量、城市居民日常生活能源消费量 | 《苏州统计年鉴(2021年)》《张家港统计年鉴(2021年)》《昆山统计年鉴(2021年)》《太仓统计年鉴(2021年)》《吴江年鉴(2021年)》《2020年苏州市交通发展年度报告》、苏州市第七次人口 普查 |
| 工业数据 | 水泥、玻璃、合成氨等主要工业产品产量 | ||
| 交通数据 | 公路、铁路、水运的客货运周转量、城市公共交通的年行驶里程 | ||
| 农业数据 | 农用机械量、农药量、化肥量、动物存栏量、农作物产量等 | ||
| 人口数据 | 常住人口数量 | ||
| 经济数据 | GDP数据,部分缺失数据结合《苏州市第四次全国经济普查》相关数据进行数据插补 | ||
| 空间数据 | 土地利用数据 | 根据高分二号遥感卫星图像解译,遥感图像空间分辨率 1 m,获取时间2018年5月。参照《第三次全国国土调查技术规程》进行分类,整体分类精度高于85% | 中国资源卫星应用中心 |
| POI数据 | 2020年苏州市域POI数据,根据研究需要进行分类筛选与归并,并进行数据清洗、坐标转换 | 高德API | |
| 家庭户数数据 | 具有经纬度的小区户数数据 | 安居客 | |
| 道路数据 | 高速路、国道、省道、县道、乡道等城市分等级道路 | Open Street Map |
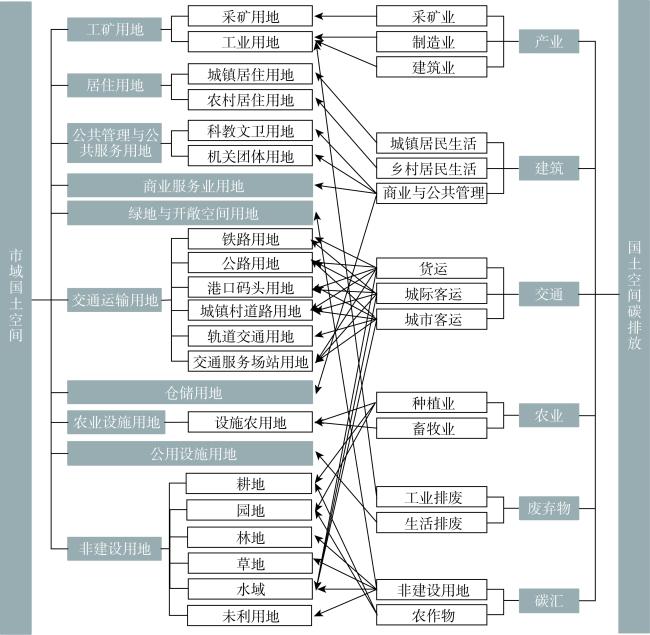
表2 基于多源数据的国土空间碳排放分配方法Table 2 Territorial spatial carbon emission allocation method based on multi-source data |
| 碳排放 | 国土空间类型 | 分配指标 | 分配方法 | |
|---|---|---|---|---|
| 工业 | 采矿业 | 采矿用地 | 行业POI数据 产品产量数据 | 统计对应地块内包含各类行业POI的数量比例,通过各类工业产品产量修正能源消耗量,按照最终参数分配碳排放量,最后累加综合[29] |
| 工业生产制造 | 工业用地 | |||
| 供应业 | 公用设施用地 | |||
| 建筑 | 居民生活 | 城镇居住用地农村宅基地 | 户数 | 依据地块户数比例分配碳排放量[13] |
| 商业服务与公共管理 | 商业服务业用地公共管理与公共服务用地 | 商业服务设施POI 公共管理设施POI | 统计对应地块内包含各类设施POI的数量比例,按照比例分配碳排放量,最后累加综合[13] | |
| 交通 | 货运 城际客运 城市客运 | 交通运输用地 | 城市道路数据交通设施POI数据 | 根据运输长度比例,分配铁路、水路以及轨道交通用地碳排放量;运用标准道路长度法,通过设施POI密度修正交通活动强度,按照最终参数分配碳排放量[30] |
| 农业 | 种植业 | 耕地、园地 | 土地利用面积 | 根据地块面积比例分配碳排放量[29] |
| 畜牧业 | 设施农用地 | |||
| 废弃物 | 工业排废 | 工业用地 | 土地利用面积 | 根据地块面积比例分配碳排放量 |
| 生活排废 | 公用设施用地 | |||
| 碳汇 | 非建设用地 | 林地、草地、水域、未利用地 | 土地利用面积 | 根据地块面积直接测算碳排放量 |
| 农作物 | 耕地、园地 | 根据地块面积比例分配碳排放量 | ||
表3 市域国土空间碳排放量Table 3 Carbon emissions in the city level territorial space |
| 部门 | 国土空间类型 | CO2排放量/万t | 部门排放总量/万t | 比例/% |
|---|---|---|---|---|
| 工业 | 工业用地 | 12430.46 | 19334.77 | 81.32 |
| 公用设施用地 | 6905.31 | |||
| 建筑 | 城镇居住用地 | 767.06 | 2882.76 | 12.21 |
| 农村宅基地 | 537.13 | |||
| 商业服务业用地 | 1030.09 | |||
| 公共管理与公共服务用地 | 548.48 | |||
| 交通 | 交通运输用地 | 1421.44 | 1421.44 | 5.98 |
| 农业 | 耕地、园地 | 94.68 | 100.70 | 0.42 |
| 设施农用地 | 6.02 | |||
| 废弃物 | 工业用地 | 1.02 | 288.30 | 1.21 |
| 公用设施用地 | 287.28 | |||
| 碳汇 | 耕地、园地 | 71.96 | -251.86 | -1.06 |
| 林地、草地、水域 | 179.9 | |||
| 合计 | 23776.11 | 23776.11 | 100.00 | |
| [1] |
熊健, 卢柯, 姜紫莹, 等. “碳达峰、碳中和”目标下国土空间规划编制研究与思考. 城市规划学刊, 2021, (4): 74-80.
[
|
| [2] |
王海鲲, 张荣荣, 毕军. 中国城市碳排放核算研究: 以无锡市为例. 中国环境科学, 2011, 31(6): 1029-1038.
[
|
| [3] |
顾朝林. 城市碳排放清单及其规划应用研究. 南方建筑, 2013, (4): 4-12.
[
|
| [4] |
石洪昕, 穆兴民, 张应龙, 等. 四川省广元市不同土地利用类型的碳排放效应研究. 水土保持通报, 2012, 32(3): 101-106.
[
|
| [5] |
姜洋, 何永, 毛其智, 等. 基于空间规划视角的城市温室气体清单研究. 城市规划, 2013, 37(4): 50-56, 67.
[
|
| [6] |
|
| [7] |
曾紫琪, 王芳, 冯艳芬, 等. 碳中和视角下广东省城市低碳发展效率空间分异及其驱动机制. 广州大学学报: 自然科学版, 2022, 21(3): 74-80, 88.
[
|
| [8] |
窦睿音, 焦贝贝, 张文洁, 等. 西部资源型城市绿色发展效率时空分异与驱动力. 自然资源学报, 2023, 38(1): 238-254.
[
|
| [9] |
杨颖. 四川省低碳经济发展效率评价. 中国人口·资源与环境, 2012, 22(6): 52-56.
[
|
| [10] |
胡剑波, 高鹏, 左鹏飞. 中国碳排放福利绩效区域差异及其贡献度研究. 经济问题, 2018, (11): 54-60.
[
|
| [11] |
潘竟虎, 张永年. 中国能源碳足迹时空格局演化及脱钩效应. 地理学报, 2021, 76(1): 206-222.
[
|
| [12] |
|
| [13] |
|
| [14] |
郑德高, 吴浩, 林辰辉, 等. 基于碳核算的城市减碳单元构建与规划技术集成研究. 城市规划学刊, 2021, (4): 43-50.
[
|
| [15] |
国家发展和改革委员会应对气候变化司. 省级温室气体清单编制指南(试行). 北京, 2010.
[Department of Climate Change, National Development and Reform Commission. Guidelines for the provincial greenhouse gas inventories (for trial implementation). Beijing, 2010.]
|
| [16] |
杨欣, 蔡银莺, 张安录. 武汉城市圈碳排放的时空格局及影响因素分解研究: 基于2001—2009年市级面板数据的实证. 长江流域资源与环境, 2013, 22(11): 1389-1396.
[
|
| [17] |
屈金凤, 楚春礼, 鞠美庭, 等. 居民生活能源消费碳排放驱动因素分解: 以天津市为例. 生态经济, 2017, 33(4): 38-42.
[
|
| [18] |
孟凡强. 铁路实现绿色发展的路径探讨. 铁路节能环保与安全卫生, 2019, 9(5): 14-17.
[
|
| [19] |
魏艳旭, 孙根年, 马丽君, 等. 中国旅游交通碳排放及地区差异的初步估算. 陕西师范大学学报: 自然科学版, 2012, 40(2): 76-84.
[
|
| [20] |
|
| [21] |
赵敏, 张卫国, 俞立中. 上海市居民出行方式与城市交通CO2排放及减排对策. 环境科学研究, 2009, 22(6): 747-752.
[
|
| [22] |
|
| [23] |
杜金霜, 付晶莹, 郝蒙蒙. 基于生态网络效用的昭通市“三生空间”碳代谢分析. 自然资源学报, 2021, 36(5): 1208-1223.
[
|
| [24] |
邱子健, 靳红梅, 高南, 等. 江苏省农业碳排放时序特征与趋势预测. 农业环境科学学报, 2022, 41(3): 658-669.
[
|
| [25] |
赵荣钦, 黄贤金, 彭补拙. 南京城市系统碳循环与碳平衡分析. 地理学报, 2012, 67(6): 758-770.
[
|
| [26] |
谢鸿宇, 陈贤生, 林凯荣, 等. 基于碳循环的化石能源及电力生态足迹. 生态学报, 2008, 28(4): 1729-1735.
[
|
| [27] |
段晓男, 王效科, 逯非, 等. 中国湿地生态系统固碳现状和潜力. 生态学报, 2008, 28(2): 463-469.
[
|
| [28] |
韩召迎, 孟亚利, 徐娇, 等. 区域农田生态系统碳足迹时空差异分析: 以江苏省为案例. 农业环境科学学报, 2012, 31(5): 1034-1041.
[
|
| [29] |
|
| [30] |
王堃, 高佳佳, 田贺忠, 等. 基于POI兴趣点的排放清单空间分配方法. 中国环境科学, 2017, 37(6): 2377-2382.
[
|
| [31] |
秦炳涛, 柳佳男. 长三角绿色发展效率时空演变及空间溢出分析: 基于Super-SBM模型和Tobit回归. 生态经济, 2022, 38(11): 64-71.
[
|
| [32] |
李璐, 董捷, 徐磊, 等. 功能区土地利用碳收支空间分异及碳补偿分区: 以武汉城市圈为例. 自然资源学报, 2019, 34(5): 1003-1015.
[
|
| [33] |
林伯强, 孙传旺. 如何在保障中国经济增长前提下完成碳减排目标. 中国社会科学, 2011, (1): 64-76, 221.
[
|
| [34] |
卢俊宇, 黄贤金, 戴靓, 等. 基于时空尺度的中国省级区域能源消费碳排放公平性分析. 自然资源学报, 2012, 27(12): 2006-2017.
[
|
| [35] |
王秋贤, 高志强, 宁吉才. 基于公平的中国省域碳排放差异模型构建探讨: 以中国2010年碳排放为例. 资源科学, 2014, 36(5): 998-1004.
[
|
| [36] |
董捷, 魏旭华, 陈恩. 土地利用碳排放地域差异下减排责任分摊研究: 以武汉城市圈为例. 长江流域资源与环境, 2019, 28(4): 872-882.
[
|
/
| 〈 |
|
〉 |