
资源型城市碳排放效率评价及其政策启示
|
张明斗(1983- ),男,山东济宁人,博士,副教授,硕士生导师,研究方向为城市经济。E-mail: zhangmingdou0537@126.com |
收稿日期: 2022-01-24
修回日期: 2022-10-08
网络出版日期: 2023-01-28
基金资助
国家自然科学基金项目(71804021)
辽宁省“兴辽英才计划”青年拔尖人才项目(XLYC2007123)
东北财经大学省级以上科研平台研究能力提升专项(PT-Y202227)
Evaluation of carbon emission efficiency of resource-based cities and its policy enlightenment
Received date: 2022-01-24
Revised date: 2022-10-08
Online published: 2023-01-28
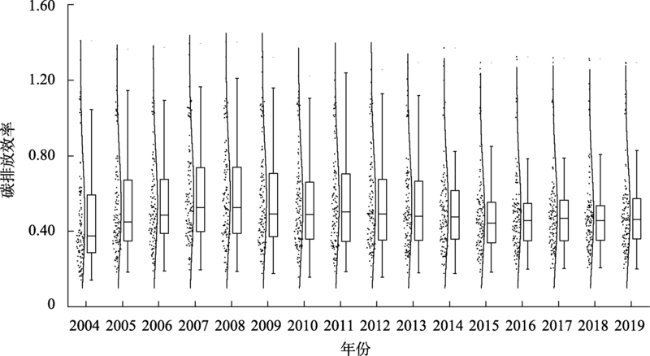
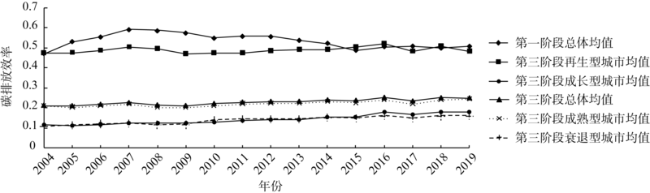
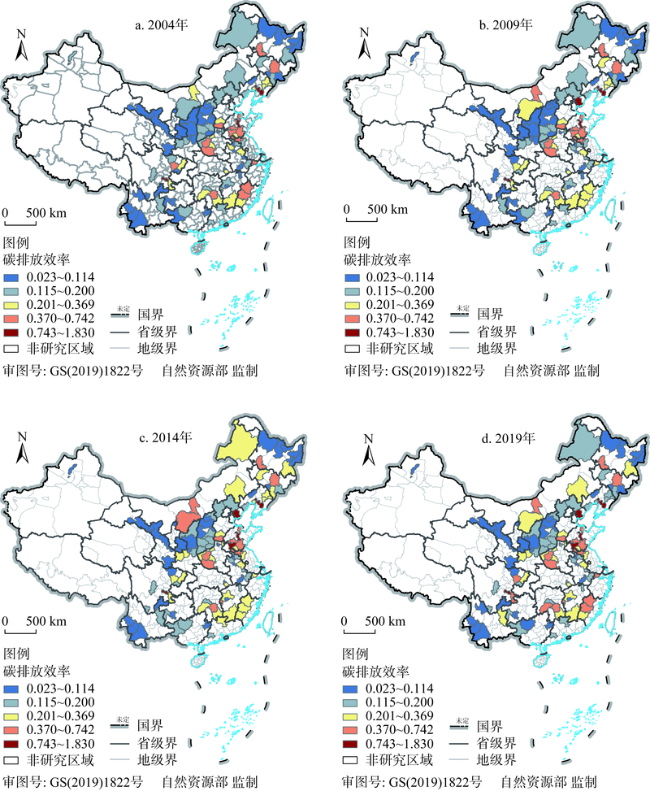
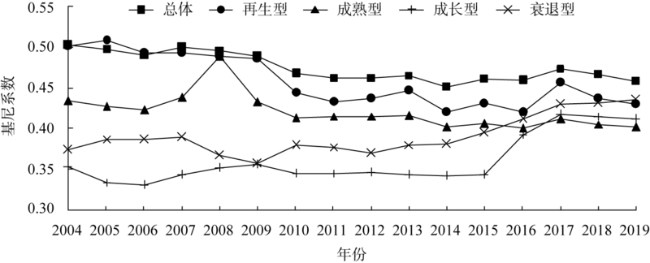
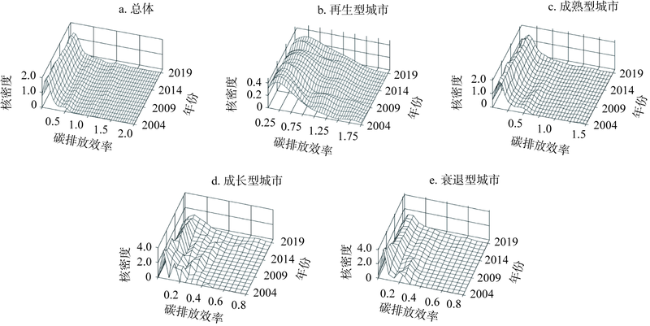
基于资源型城市面临经济转型与节能减排的双重压力,本文采用三阶段超效率SBM模型,实证测度了2004—2019年中国114个资源型城市碳排放效率,并利用Dagum基尼系数、核密度估计、QAP回归分析等方法对效率差异、时空演变以及差异来源进行探讨。研究表明:(1)剔除环境因素和随机干扰后,资源型城市碳排放效率均值降至0.230,但整体呈现上升趋势。(2)碳排放效率高值区集中于再生型与成熟型城市,分布较为分散;低值区则主要为成长型与衰退型城市,并于东北、中部等地区呈现集聚性特征。(3)资源型城市碳排放效率差异较大,其中,组间差异贡献率最高,但呈现下降趋势;再生型和成熟型城市组内差异相对稳定,成长型和衰退型城市组内差异逐渐扩大。(4)人口密度、居民可支配收入和规模企业数量差异会显著扩大资源型城市碳排放效率差异,而且人口密度、人口结构以及居民可支配收入差异对不同类型资源型城市碳排放效率差异呈现显著的异质性影响。基于分析结果,本文提出三点政策启示:一是依据资源型城市类型,采取因地制宜的减排方案;二是增加低碳创新投入,促进产业绿色转型;三是推广绿色消费方式,加强居民端减排。
关键词: 资源型城市; 碳排放效率; 差异分析; 三阶段超效率SBM模型
张明斗 , 席胜杰 . 资源型城市碳排放效率评价及其政策启示[J]. 自然资源学报, 2023 , 38(1) : 220 -237 . DOI: 10.31497/zrzyxb.20230114
Based on the dual pressures of economic transformation and energy conservation and emission reduction faced by resource-based cities, this paper empirically measures the carbon emission efficiency of 114 resource-based cities in China from 2004 to 2019 by using a three-stage super-efficiency SBM model, and discusses the efficiency differences, spatio-temporal evolution and sources of differences by using the methods of Dagum Gini coefficient, kernel density estimation and QAP regression analysis. The results show that: (1) After the environmental factors and random interference is removed, the average carbon emission efficiency of resource-based cities decreases to 0.230, but the overall trend is on the rise. (2) The areas with high carbon emission efficiency are concentrated in regenerating and mature cities, and the distribution is relatively scattered. The low value areas are mainly growing and declining cities, and they are clustered in northeast, central and other regions. (3) The carbon emission efficiency of resource-based cities varies greatly, among which the contribution rate of inter-group difference is the highest, but it shows a downward trend; The differences within the groups of regenerating and mature cities are relatively stable, while the differences within the groups of growing and declining cities are gradually expanding. (4) The differences of population density, per capita disposable income and the number of large-scale enterprises will significantly expand the differences of carbon emission efficiency of resource-based cities, and the differences in population density, population structure and disposable income of residents have a significant heterogeneous impact on the differences in carbon emission efficiency of different types of resource-based cities. Considering the characteristics of carbon emission efficiency of resource-based cities, this paper puts forward the following policy implications: Firstly, according to the types of resource-based cities, we should adopt emission reduction schemes that suit local conditions. Secondly, we should increase investment in low-carbon innovation and promote green transformation of industry. Resource-based cities can increase R&D investment by imitating innovation, and make low-carbon innovation more directional and targeted. At the same time, resource-based cities should encourage enterprises to carry out green technological transformation and upgrading. Thirdly, we will promote green consumption mode and strengthen emission reduction of residents. The government should enhance residents' cognitive level of consumption emission reduction ability and encourage consumers to make low-carbon consumption. Moreover, the government should explore green financial innovation, establish individual carbon credit and carbon account system, and encourage residents' participation in green financial market.
表1 第二阶段SFA回归结果Table 1 Second stage SFA regression results |
| 变量 | 资本存量松弛量 | 就业人数松弛量 | 能源投入松弛量 |
|---|---|---|---|
| 常数项 | -525.046*** (-8.190) | -3.292 (-1.214) | 275.703*** (15.631) |
| 产业结构 | 678.162*** (5.628) | 12.788*** (2.767) | -11.597 (-0.496) |
| 科技投入水平 | 19341.987*** (16.094) | 152.493*** (3.090) | 994.766*** (664.017) |
| 环境规制水平 | -34.888** (-2.553) | 0.237 (0.493) | 14.955*** (9.237) |
| 经济开放水平 | 18.909*** (3.707) | 0.072 (0.462) | -0.730 (-1.102) |
| 2787277.900*** (238411.520) | 1161.639*** (8.339) | 21086.387*** (18927.674) | |
| γ | 0.920*** (362.727) | 0.766*** (26.415) | 0.777*** (106.443) |
| 对数似然函数值 | -14385.034 | -7817.007 | -10643.103 |
| LR单边检验 | 2826.814*** | 560.952*** | 866.380*** |
注:*、**、***分别表示10%、5%、1%显著性水平,括号内为T统计量。 |
表2 资源型城市碳排放效率的组间基尼系数Table 2 Inter-regional Gini coefficient of carbon emission efficiency of resource-based cities |
| 年份 | 再生型— 成熟型 | 再生型— 成长型 | 再生型— 衰退型 | 成熟型— 成长型 | 成熟型— 衰退型 | 成长型— 衰退型 |
|---|---|---|---|---|---|---|
| 2004 | 0.563 | 0.674 | 0.683 | 0.465 | 0.477 | 0.385 |
| 2005 | 0.567 | 0.672 | 0.673 | 0.446 | 0.464 | 0.372 |
| 2006 | 0.559 | 0.663 | 0.662 | 0.440 | 0.457 | 0.370 |
| 2007 | 0.568 | 0.665 | 0.667 | 0.449 | 0.465 | 0.374 |
| 2008 | 0.576 | 0.664 | 0.673 | 0.438 | 0.450 | 0.365 |
| 2009 | 0.562 | 0.648 | 0.655 | 0.440 | 0.444 | 0.363 |
| 2010 | 0.539 | 0.632 | 0.618 | 0.424 | 0.427 | 0.366 |
| 2011 | 0.528 | 0.617 | 0.606 | 0.422 | 0.426 | 0.365 |
| 2012 | 0.531 | 0.616 | 0.610 | 0.420 | 0.423 | 0.362 |
| 2013 | 0.535 | 0.616 | 0.614 | 0.417 | 0.428 | 0.366 |
| 2014 | 0.516 | 0.591 | 0.599 | 0.404 | 0.421 | 0.366 |
| 2015 | 0.534 | 0.607 | 0.616 | 0.404 | 0.427 | 0.374 |
| 2016 | 0.526 | 0.587 | 0.610 | 0.415 | 0.431 | 0.408 |
| 2017 | 0.542 | 0.603 | 0.621 | 0.432 | 0.444 | 0.429 |
| 2018 | 0.528 | 0.591 | 0.614 | 0.427 | 0.444 | 0.430 |
| 2019 | 0.507 | 0.574 | 0.596 | 0.426 | 0.445 | 0.430 |
| 均值 | 0.543 | 0.626 | 0.632 | 0.429 | 0.442 | 0.383 |
表3 资源型城市碳排放效率差异来源分解Table 3 Source decomposition of carbon emission efficiency difference in resource-based cities |
| 年份 | 区域内 | 贡献率/% | 区域间 | 贡献率/% | 超变密度 | 贡献率/% |
|---|---|---|---|---|---|---|
| 2004 | 0.157 | 31.24 | 0.245 | 48.73 | 0.101 | 20.03 |
| 2005 | 0.153 | 30.89 | 0.241 | 48.62 | 0.102 | 20.49 |
| 2006 | 0.152 | 30.99 | 0.235 | 47.99 | 0.103 | 21.02 |
| 2007 | 0.156 | 31.28 | 0.235 | 47.17 | 0.108 | 21.55 |
| 2008 | 0.151 | 30.48 | 0.241 | 48.64 | 0.104 | 20.88 |
| 2009 | 0.153 | 31.27 | 0.230 | 47.06 | 0.106 | 21.67 |
| 2010 | 0.146 | 31.22 | 0.210 | 44.96 | 0.111 | 23.82 |
| 2011 | 0.147 | 31.77 | 0.202 | 43.66 | 0.114 | 24.58 |
| 2012 | 0.147 | 31.72 | 0.203 | 43.99 | 0.112 | 24.30 |
| 2013 | 0.147 | 31.61 | 0.205 | 44.04 | 0.113 | 24.35 |
| 2014 | 0.143 | 31.67 | 0.194 | 43.05 | 0.114 | 25.28 |
| 2015 | 0.143 | 31.07 | 0.202 | 43.88 | 0.115 | 25.05 |
| 2016 | 0.142 | 30.88 | 0.190 | 41.44 | 0.127 | 27.68 |
| 2017 | 0.147 | 30.93 | 0.191 | 40.21 | 0.137 | 28.85 |
| 2018 | 0.145 | 31.10 | 0.187 | 40.08 | 0.134 | 28.83 |
| 2019 | 0.146 | 31.87 | 0.177 | 38.58 | 0.135 | 29.55 |
| 均值 | 0.148 | 31.25 | 0.212 | 44.51 | 0.115 | 24.25 |
表4 资源型城市碳排放效率差异的影响因素及变量说明Table 4 The description of influencing factors and variables of carbon emission efficiency difference in resource-based cities |
| 变量名称 | 变量含义 | 指标计算 | 数据来源 |
|---|---|---|---|
| Pop | 人口密度差异 | 城市i和城市j户籍人数与行政区域面积比值差值矩阵 | 中国城市统计年鉴 |
| Ps | 人口结构差异 | 城市i和城市j中小学生人数占户籍人口比例差值矩阵 | 中国区域经济统计年鉴 |
| Dpi | 居民可支配收入差异 | 城市i和城市j城镇居民可支配收入差值矩阵 | 中国区域经济统计年鉴 |
| Fis | 财政支出差异 | 城市i和城市j财政支出占GDP比例差值矩阵 | 中国城市统计年鉴 |
| Road | 基础设施建设差异 | 城市i和城市j公路里程与行政区域面积比值差值矩阵 | 中国区域经济统计年鉴 |
| Co | 规模企业数量差异 | 城市i和城市j规模以上工业企业数量差值矩阵 | 中国城市统计年鉴 |
表5 基准回归结果Table 5 Benchmark regression results |
| 变量名称 | 2004年 | 2009年 | 2014年 | 2019年 |
|---|---|---|---|---|
| Intercept | -0.272*** | -0.261*** | -0.312*** | -0.219*** |
| Pop | 1.132** | 1.432** | 1.256** | 3.028*** |
| Ps | 0.051 | 0.286 | -0.304 | -0.525* |
| Dpi | 0.017** | 0.006 | 0.123*** | 0.021*** |
| Fis | 0.108 | 0.050 | -0.494 | -0.035 |
| Road | -0.027 | -0.093** | -0.045 | -0.114*** |
| Co | 0.059*** | 0.064*** | 0.054*** | 0.041*** |
| R2 | 0.194 | 0.231 | 0.215 | 0.195 |
| 随机置换次数/次 | 5000 | 5000 | 5000 | 5000 |
表6 异质性回归结果Table 6 Heterogeneous regression results |
| 变量名称 | 再生型 | 成熟型 | 成长型 | 衰退型 |
|---|---|---|---|---|
| Intercept | -0.056*** | -0.095*** | -0.217*** | 0.036*** |
| Pop | 4.928** | 5.182*** | 6.978** | -1.159** |
| Ps | -0.353** | -0.577 | 0.710 | 0.171 |
| Dpi | 0.019 | 0.017** | 0.017 | -0.008 |
| Fis | 0.124 | 0.092 | -0.159 | -0.186 |
| Road | -0.309** | -0.249*** | -0.134*** | -0.254*** |
| Co | 0.037* | 0.021*** | 0.030*** | 0.016** |
| R2 | 0.175 | 0.213 | 0.381 | 0.338 |
| 随机置换次数/次 | 5000 | 5000 | 5000 | 5000 |
| [1] |
卢硕, 张文忠, 余建辉, 等. 资源型城市演化阶段识别及其发展特征. 地理学报, 2020, 75(10): 2180-2191.
[
|
| [2] |
李虹, 邹庆. 环境规制、资源禀赋与城市产业转型研究: 基于资源型城市与非资源型城市的对比分析. 经济研究, 2018, 53(11): 182-198.
[
|
| [3] |
李江龙, 徐斌. “诅咒”还是“福音”: 资源丰裕程度如何影响中国绿色经济增长?. 经济研究, 2018, 53(9): 151-167.
[
|
| [4] |
阎晓, 涂建军. 黄河流域资源型城市生态效率时空演变及驱动因素. 自然资源学报, 2021, 36(1): 223-239.
[
|
| [5] |
刘竹, 耿涌, 薛冰, 等. 城市能源消费碳排放核算方法. 资源科学, 2011, 33(7): 1325-1330.
[
|
| [6] |
程叶青, 王哲野, 张守志, 等. 中国能源消费碳排放强度及其影响因素的空间计量. 地理学报, 2013, 68(10): 1418-1431.
[
|
| [7] |
耿文欣, 范英. 碳交易政策是否促进了能源强度的下降? 基于湖北试点碳市场的实证. 中国人口·资源与环境, 2021, 31(9): 104-113.
[
|
| [8] |
王少剑, 高爽, 黄永源, 等. 基于超效率SBM模型的中国城市碳排放绩效时空演变格局及预测. 地理学报, 2020, 75(6): 1316-1330.
[
|
| [9] |
李金铠, 马静静, 魏伟. 中国八大综合经济区能源碳排放效率的区域差异研究. 数量经济技术经济研究, 2020, 37(6): 109-129.
[
|
| [10] |
王凯, 张淑文, 甘畅, 等. 中国旅游业碳排放效率的空间网络结构及其效应研究. 地理科学, 2020, 40(3): 344-353.
[
|
| [11] |
胡剑波, 闫烁, 韩君. 中国产业部门隐含碳排放效率研究: 基于三阶段DEA模型与非竞争型I-O模型的实证分析. 统计研究, 2021, 38(6): 30-43.
[
|
| [12] |
盖美, 朱静敏, 孙才志, 等. 中国沿海地区海洋经济效率时空演化及影响因素分析. 资源科学, 2018, 40(10): 1966-1979.
[
|
| [13] |
李博, 张文忠, 余建辉. 碳排放约束下的中国农业生产效率地区差异分解与影响因素. 经济地理, 2016, 36(9): 150-157.
[
|
| [14] |
张卓群, 张涛, 冯冬发. 中国碳排放强度的区域差异、动态演进及收敛性研究. 数量经济技术经济研究, 2022, 39(4): 67-87.
[
|
| [15] |
屈小娥. 中国省际全要素CO2排放效率差异及驱动因素: 基于1995—2010年的实证研究. 南开经济研究, 2012, 28(3): 128-141.
[
|
| [16] |
莫惠斌, 王少剑. 黄河流域县域碳排放的时空格局演变及空间效应机制. 地理科学, 2021, 41(8): 1324-1335.
[
|
| [17] |
李顺成, 肖卫东, 王志宝. 家庭部门能源消费影响因素及碳排放结构研究: 基于PLS结构方程模型的实证解析. 软科学, 2020, 34(2): 117-123.
[
|
| [18] |
刘志华, 徐军委, 张彩虹. 科技创新、产业结构升级与碳排放效率: 基于省际面板数据的PVAR分析. 自然资源学报, 2022, 37(2): 508-520.
[
|
| [19] |
禹湘, 陈楠, 李曼琪. 中国低碳试点城市的碳排放特征与碳减排路径研究. 中国人口·资源与环境, 2020, 30(7): 1-9.
[
|
| [20] |
邵海琴, 王兆峰. 中国交通碳排放效率的空间关联网络结构及其影响因素. 中国人口·资源与环境, 2021, 31(4): 32-41.
[
|
| [21] |
周杰琦, 韩颖, 林洪. FDI对中国工业碳排放效率的影响机理及其效应: 理论构建与经验分析. 软科学, 2016, 30(1): 76-80.
[
|
| [22] |
朱德进, 杜克锐. 对外贸易、经济增长与中国二氧化碳排放效率. 山西财经大学学报, 2013, 35(5): 1-11.
[
|
| [23] |
何文举, 张华峰, 陈雄超, 等. 中国省域人口密度、产业集聚与碳排放的实证研究: 基于集聚经济、拥挤效应及空间效应的视角. 南开经济研究, 2019, 35(2): 207-225.
[
|
| [24] |
李在军, 尹上岗, 姜友雪, 等. 长三角经济增长与碳排放异速关系及形成机制. 自然资源学报, 2022, 37(6): 1507-1523.
[
|
| [25] |
王睿, 张赫, 强文丽, 等. 基于城镇化的中国县级城市碳排放空间分布特征及影响因素. 地理科学进展, 2021, 40(12): 1999-2010.
[
|
| [26] |
|
| [27] |
|
| [28] |
|
| [29] |
|
| [30] |
罗登跃. 三阶段DEA模型管理无效率估计注记. 统计研究, 2012, 29(4): 104-107.
[
|
| [31] |
孙亚男, 杨名彦. 中国绿色全要素生产率的俱乐部收敛及地区差距来源研究. 数量经济技术经济研究, 2020, 37(6): 47-69.
[
|
| [32] |
张军, 吴桂英, 张吉鹏. 中国省际物质资本存量估算: 1952—2000. 经济研究, 2004, 39(10): 35-44.
[
|
| [33] |
张少辉, 余泳泽, 杨晓章. 中国城市固定资本存量估算与生产率收敛分析: 1988—2015. 中国软科学, 2021, 36(7): 74-86.
[
|
| [34] |
柯善咨, 向娟. 1996—2009年中国城市固定资本存量估算. 统计研究, 2012, 29(7): 19-24.
[
|
| [35] |
韩刚, 袁家冬, 张轩, 等. 紧凑城市空间结构对城市能耗的作用机制: 基于江苏省的实证研究. 地理科学, 2019, 39(7): 1147-1154.
[
|
| [36] |
|
| [37] |
|
| [38] |
|
| [39] |
李健, 周慧. 中国碳排放强度与产业结构的关联分析. 中国人口·资源与环境, 2012, 22(1): 7-14.
[
|
| [40] |
叶琴, 曾刚, 戴劭勍, 等. 不同环境规制工具对中国节能减排技术创新的影响: 基于285个地级市面板数据. 中国人口·资源与环境, 2018, 28(2): 115-122.
[
|
| [41] |
王兴民, 吴静, 白冰, 等. 中国CO2排放的空间分异与驱动因素: 基于198个地级及以上城市数据的分析. 经济地理, 2020, 40(11): 29-38.
[
|
/
| 〈 |
|
〉 |