
服务业对资源枯竭城市转型的经济增长效应——基于23座地级市的面板数据
|
刘霆 (1992- ),男,山东青岛人,博士研究生,研究方向为资源型城市转型研究。E-mail: lucientonius0627@163.com |
收稿日期: 2022-03-21
修回日期: 2022-06-23
网络出版日期: 2023-01-28
基金资助
国家自然科学基金项目(41471107)
The economic growth effect of the service industry on the transformation of resource-depleted cities: Based on panel data from 23 prefecture-level cities in China
Received date: 2022-03-21
Revised date: 2022-06-23
Online published: 2023-01-28
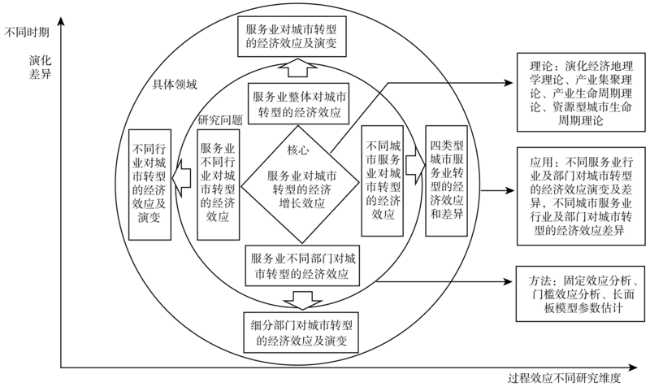
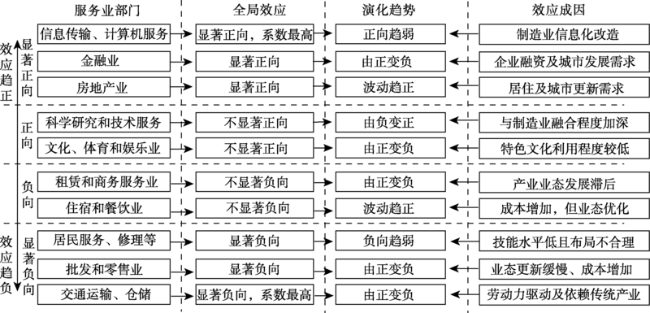
实现经济平稳健康增长是当前资源枯竭城市转型的重要目标之一,以服务业为驱动的发展模式对于提高经济增长、促进就业具有重要意义。基于2001—2018年中国23座资源枯竭城市面板数据,运用固定效应模型、门槛模型等探究服务业对资源枯竭城市转型的经济增长效应。结果表明:(1)服务业在不同时期对城市转型的经济效应存在差异,随发展水平提升呈现“促进—抑制—促进”变化趋势;(2)生产性服务业在不同时期对城市转型的经济效应存在“负向—正向—负向”演变趋势,生活性服务业随发展水平提升呈现“抑制—促进—抑制”的效应变动;(3)交通运输等传统服务业部门对城市转型的经济效应为负向,信息传输等高端服务业部门的效应为正向;(4)服务业对煤炭型和森工型城市转型的经济效应显著为正。
刘霆 , 申玉铭 . 服务业对资源枯竭城市转型的经济增长效应——基于23座地级市的面板数据[J]. 自然资源学报, 2023 , 38(1) : 140 -156 . DOI: 10.31497/zrzyxb.20230109
At present, realizing steady and healthy economic growth is one of the major aims of resource-depleted cities in urban transformation. The service-driven development mode is of great significance for improving economic growth levels and promoting employment in resource-depleted cities during the process of urban transformation. Based on panel data of 23 prefecture-level resource-depleted cities in China from 2001 to 2018. This paper aims to analyze the economic growth effect of the service industry on the transformation of resource-depleted cities by utilizing the fixed-effect model and threshold model. The results indicate that: (1) Generally, there are differences in the economic growth effects of service industry development on urban transformation in different stages of transformation, and the economic growth effects of service industry on urban transformation show a trend of "promotion-inhibition-promotion" with the improvement of service industry development level. (2) Producer service industry placed an effect of "negative-positive-negative" trend on the economic growth of urban transformation at different stages of transformation, and the consumer service industry exerts an effect of "suppression-promotion-inhibition" on the economic growth of urban transformation with the improvement of consumer service industry development level. (3) Traditional service sectors such as transportation, wholesale and retail have a negative effect on the economic growth of urban transformation, while high-end service sectors such as information transmission and finance place a positive effect on economic growth. (4) The overall economic growth effect of the service industry on the transformation of coal cities and forest cities is significantly positive.
表1 23座地级资源枯竭城市名单Table 1 The list of 23 prefecture-level resource-depleted cities (亿元) |
| 城市 | 省(自治区) | 城市类型 | 服务业规模 | 城市 | 省(自治区) | 城市类型 | 服务业规模 |
|---|---|---|---|---|---|---|---|
| 白山 | 吉林 | 森工型 | 310.08 | 濮阳 | 河南 | 油气型 | 653.02 |
| 白银 | 甘肃 | 金属非金属型 | 228.63 | 七台河 | 黑龙江 | 煤炭型 | 119.63 |
| 抚顺 | 辽宁 | 煤炭型 | 418.90 | 韶关 | 广东 | 金属非金属型 | 737.67 |
| 阜新 | 辽宁 | 煤炭型 | 227.68 | 石嘴山 | 宁夏 | 煤炭型 | 208.01 |
| 鹤岗 | 黑龙江 | 煤炭型 | 108.42 | 双鸭山 | 黑龙江 | 煤炭型 | 208.48 |
| 淮北 | 安徽 | 煤炭型 | 379.89 | 铜川 | 陕西 | 金属非金属型 | 161.55 |
| 黄石 | 湖北 | 金属非金属型 | 562.07 | 铜陵 | 安徽 | 金属非金属型 | 460.34 |
| 焦作 | 河南 | 煤炭型 | 894.77 | 乌海 | 内蒙古 | 煤炭型 | 183.74 |
| 景德镇 | 江西 | 金属非金属型 | 387.83 | 新余 | 江西 | 金属非金属型 | 462.61 |
| 辽源 | 吉林 | 煤炭型 | 282.95 | 伊春 | 黑龙江 | 森工型 | 111.06 |
| 泸州 | 四川 | 油气型 | 621.38 | 枣庄 | 山东 | 煤炭型 | 1025.82 |
| 萍乡 | 江西 | 煤炭型 | 480.41 |
注:资料来源于《全国资源型城市可持续发展规划(2013—2020年)》《中国城市统计年鉴2019》,排序按城市首字母拼音排序,服务业规模数据为2018年(当年价)数据。 |
表2 面板数据模型相关变量描述性统计Table 2 Descriptive statistics of variables in PDM |
| 变量 | 平均值 | 标准差 | 最小值 | 最大值 | 变量 | 平均值 | 标准差 | 最小值 | 最大值 |
|---|---|---|---|---|---|---|---|---|---|
| pgdp | 9.550 | 0.212 | 6.247 | 10.123 | asl | -0.770 | 0.311 | -2.020 | 0.617 |
| ser | -0.257 | 0.343 | -0.502 | 0.289 | esl | -0.646 | 0.268 | -3.073 | 0.301 |
| psl | -0.517 | 0.290 | -1.669 | 0.361 | rsl | -0.387 | 0.655 | -2.533 | 1.334 |
| csl | -0.550 | 0.446 | -1.861 | 1.317 | lsl | -0.304 | 0.327 | -2.441 | 0.797 |
| tsl | -0.562 | 0.206 | -1.528 | 0.478 | fai | 4.021 | 0.518 | 2.432 | 5.332 |
| isl | -0.538 | 0.262 | -1.917 | 0.709 | tec | 0.820 | 0.557 | -1.288 | 1.915 |
| fsl | -0.125 | 0.287 | -2.063 | 0.726 | ind | 4.185 | 0.097 | 3.809 | 4.386 |
| bsl | -0.530 | 0.695 | -4.119 | 1.467 | fdl | 5.158 | 0.332 | 3.546 | 6.179 |
| ssl | -0.743 | 0.232 | -2.502 | 0.944 | gov | 2.665 | 0.544 | -0.12 | 4.062 |
| wsl | -0.415 | 0.488 | -1.849 | 1.720 | tci | 2.891 | 0.587 | 1.171 | 5.119 |
表3 服务业面板数据模型回归检验结果Table 3 The regression test results of PDM of tertiary industry |
| 变量 | 时点固定效应模型(1) | 时点固定效应模型(2) | 2001—2006年 | 2007—2012年 | 2013—2018年 |
|---|---|---|---|---|---|
| ser | -0.079** | -0.211*** | -0.150** | 0.008 | 0.139 |
| (-2.09) | (-3.35) | (-2.47) | (0.48) | (1.18) | |
| ser2 | 0.043*** | ||||
| (2.61) | |||||
| fai | 0.057 | 0.066* | -0.035 | 0.130** | 0.107*** |
| (1.57) | (1.83) | (-1.12) | (2.31) | (4.09) | |
| tec | -0.503*** | -0.501*** | -0.086** | -0.012 | -0.148** |
| (-10.78) | (-10.82) | (-2.18) | (-0.45) | (-2.05) | |
| ind | 0.469*** | 0.405** | 0.993*** | 0.406** | 0.318* |
| (2.73) | (2.35) | (5.72) | (1.99) | (1.70) | |
| fin | -0.212*** | -0.228*** | -0.146*** | -0.354*** | -0.472*** |
| (-3.65) | (-3.93) | (-3.75) | (-3.51) | (-5.55) | |
| gov | 0.064 | 0.063 | -0.008 | 0.020 | 0.190** |
| (1.18) | (1.18) | (-0.22) | (0.21) | (2.18) | |
| tci | 0.316*** | 0.313*** | 0.014 | -0.036 | 0.136*** |
| (12.28) | (12.23) | (0.41) | (-1.29) | (4.16) | |
| 常数项 | 7.463*** | 7.760*** | 5.533*** | 8.782*** | 9.247*** |
| (9.25) | (9.60) | (6.95) | (8.88) | (10.24) | |
| 样本量/个 | 414 | 414 | 138 | 138 | 138 |
| R2 | 0.584 | 0.592 | 0.852 | 0.824 | 0.682 |
| F统计量 | 78.17 | 70.27 | 49.61 | 56.16 | 18.38 |
注:*、**、***分别表示在10%、5%、1%的水平上显著,下同。 |
表4 服务业面板门槛模型回归检验结果Table 4 The regression test results of PTM of tertiary industry |
| 变量 | 双重门槛回归模型 | |
|---|---|---|
| 系数 | 统计量 | |
| 服务业专业化水平(ser)≤ 0.364 | 2.822*** | 3.89 |
| 服务业专业化水平(ser) (0.364<ser≤ 0.584) | -0.647*** | -3.94 |
| 服务业专业化水平(ser) (ser >0.584) | 0.094 | 1.45 |
| 常数项 | 8.312*** | 12.87 |
| 控制变量 | YES | |
| 样本量/个 | 414 | |
| R2 | 0.728 | |
| F统计量 | 51.38*** | |
表5 生产性服务业面板模型回归检验结果Table 5 The regression test results of PDM of producer service industry |
| 变量 | 时点固定效应模型(1) | 时点固定效应模型(2) | 2001—2006年 | 2007—2012年 | 2013—2018年 |
|---|---|---|---|---|---|
| lnpsl | -0.015 | -0.102* | -0.014 | 0.136*** | -0.089* |
| (-0.52) | (-1.68) | (-0.48) | (3.41) | (-1.86) | |
| lnpsl2 | -0.079 | ||||
| (-1.63) | |||||
| 常数项 | 7.362*** | 7.403*** | 5.421*** | 8.865*** | 9.310*** |
| (13.54) | (13.64) | (6.64) | (9.46) | (10.50) | |
| 控制变量 | YES | YES | YES | YES | YES |
| 样本量/个 | 414 | 414 | 138 | 138 | 138 |
| R2 | 0.855 | 0.856 | 0.844 | 0.881 | 0.688 |
| F统计量 | 90.48 | 87.36 | 46.48 | 63.31 | 18.91 |
注:括号内为t值,下同。 |
表6 生活性服务业面板模型回归检验结果Table 6 The regression test results of PDM of consumer service industry |
| 变量 | 时点固定效应模型(1) | 时点固定效应模型(2) | 2001—2006年 | 2007—2012年 | 2013—2018年 |
|---|---|---|---|---|---|
| lncsl | -0.070*** | -0.101*** | 0.041 | -0.073*** | 0.004 |
| (-3.24) | (-3.83) | (1.10) | (-3.37) | (0.11) | |
| lncsl2 | 0.045** | ||||
| (2.03) | |||||
| 常数项 | 7.354*** | 7.229*** | 5.200*** | 8.719*** | 9.012*** |
| (13.73) | (13.47) | (6.22) | (9.29) | (10.13) | |
| 控制变量 | YES | YES | YES | YES | YES |
| 样本量/个 | 414 | 414 | 138 | 138 | 138 |
| R2 | 0.859 | 0.861 | 0.846 | 0.880 | 0.677 |
| F统计量 | 93.41 | 90.61 | 87.01 | 63.13 | 18.02 |
表7 生活性服务业面板门槛模型回归检验结果Table 7 The regression test results of PTM of consumer service industry |
| 变量 | 双重门槛回归模型 | |
|---|---|---|
| 系数 | 统计量 | |
| 生活性服务业专业化水平(csl) ≤ 0.409 | -1.376 | -1.07 |
| 生活性服务业专业化水平-1 (0.409<csl≤ 1.861) | 0.994*** | 3.83 |
| 生活性服务业专业化水平-2 (csl >1.861) | -0.145*** | -4.79 |
| 常数项 | 8.312*** | 13.02 |
| 控制变量 | YES | |
| 样本量/个 | 414 | |
| R2 | 0.698 | |
| F统计量 | 88.06 | |
表8 服务业不同部门面板模型回归检验结果Table 8 The regression test results of PDM in different service sectors |
| 服务业部门 | 2003—2018年 | 2003—2006年 | 2007—2012年 | 2013—2018年 | 演化趋势 |
|---|---|---|---|---|---|
| 交通运输、仓储和邮政业(tsl) | -0.099*** | 0.019 | -0.039 | -0.040 | 由正变负 |
| (-4.13) | (0.55) | (-1.16) | (-0.84) | ||
| 信息传输、计算机服务和软件业(isl) | 0.059** | 0.036 | 0.058* | 0.039 | 正向趋弱 |
| (2.51) | (1.55) | (1.96) | (0.67) | ||
| 金融业(fsl) | 0.052** | 0.003 | 0.133*** | -0.050 | 由正变负 |
| (2.35) | (0.14) | (5.07) | (-0.78) | ||
| 租赁和商务服务业(bsl) | -0.008 | 0.005 | 0.002 | -0.043* | 由正变负 |
| (-0.81) | (0.35) | (0.21) | (-1.80) | ||
| 科学研究和技术服务业(ssl) | 0.033 | -0.004 | 0.102*** | 0.046* | 由负变正 |
| (1.58) | (-0.14) | (4.14) | (1.95) | ||
| 批发和零售业(wsl) | -0.046*** | 0.005 | -0.021 | -0.016 | 由正变负 |
| (-2.72) | (0.11) | (-1.34) | (-0.49) | ||
| 住宿和餐饮业(asl) | -0.023 | 0.026 | -0.056*** | 0.083*** | 波动趋正 |
| (-1.48) | (1.37) | (-3.19) | (3.03) | ||
| 房地产业(esl) | 0.035** | 0.040** | -0.026 | 0.069* | 波动趋正 |
| (2.15) | (2.16) | (-1.22) | (1.79) | ||
| 居民服务、修理和其他服务业(rsl) | -0.036*** | -0.001 | -0.027* | -0.010 | 负向趋弱 |
| (-3.54) | (-0.06) | (-1.97) | (-0.44) | ||
| 文化、体育和娱乐业(lsl) | 0.017 | 0.024 | -0.010 | -0.017 | 由正变负 |
| (0.79) | (0.86) | (-0.37) | (-0.34) |
表9 不同类型城市长面板模型回归结果Table 9 The regression results of LPM of different types of cities |
| 服务业部门 | 煤炭型城市 | 金属及非金属型城市 | 森工型城市 | 油气型城市 |
|---|---|---|---|---|
| 服务业整体(ser) | 0.281*** | 0.012 | 0.281* | 0.080 |
| (0.085) | (0.021) | (0.159) | (0.257) | |
| 生产性服务业(psl) | 0.069 | 0.086 | 0.078 | -0.175* |
| (0.105) | (0.063) | (0.096) | (0.099) | |
| 生活性服务业(csl) | -0.063* | -0.080** | -0.533*** | -0.126* |
| (0.037) | (0.033) | (0.149) | (0.015) | |
| 交通运输、仓储和邮政业(tsl) | 0.024 | -0.051 | -0.609*** | -0.139 |
| (0.030) | (0.048) | (0.196) | (0.094) | |
| 信息传输、计算机服务和软件业(isl) | 0.018 | 0.119** | -0.261 | -0.103 |
| (0.031) | (0.050) | (0.206) | (0.090) | |
| 金融业(fsl) | 0.073* | 0.105** | 0.213 | -0.085 |
| (0.037) | (0.045) | (0.146) | (0.126) | |
| 租赁和商务服务业(bsl) | 0.012 | -0.054*** | 0.247*** | 0.023 |
| (0.019) | (0.019) | (0.079) | (0.062) | |
| 科学研究和技术服务业(ssl) | 0.063 | 0.112*** | -0.301* | -0.044 |
| (0.082) | (0.036) | (0.179) | (0.081) | |
| 批发和零售业(wsl) | -0.060*** | -0.083*** | -0.385*** | 0.020 |
| (0.022) | (0.024) | (0.122) | (0.122) | |
| 住宿和餐饮业(asl) | -0.078*** | 0.020 | -0.125 | 0.064 |
| (0.029) | (0.019) | (0.112) | (0.083) | |
| 房地产业(esl) | 0.087*** | 0.051* | -0.319** | -0.071 |
| (0.020) | (0.028) | (0.127) | (0.139) | |
| 居民服务、修理和其他服务业(rsl) | -0.041* | -0.049*** | 0.199*** | -0.101*** |
| (0.025) | (0.016) | (0.069) | (0.030) | |
| 文化、体育和娱乐业(lsl) | -0.032 | 0.160*** | 0.068 | 0.130 |
| (0.035) | (0.029) | (0.203) | (0.181) |
| [1] |
余建辉, 李佳洺, 张文忠. 中国资源型城市识别与综合类型划分. 地理学报, 2018, 73(4): 677-687.
[
|
| [2] |
黄天能, 许进龙, 谢凌凌. 资源枯竭城市产业结构转型升级水平测度及其影响因素: 基于24座地级市的面板数据. 自然资源学报, 2021, 36(8): 2065-2080.
[
|
| [3] |
李博, 秦欢, 孙威. 产业转型升级与绿色全要素生产率提升的互动关系: 基于中国116个地级资源型城市的实证研究. 自然资源学报, 2022, 37(1): 186-199.
[
|
| [4] |
张梦硕, 张平宇, 李鹤. 资源型城市经济转型绩效特征与评价方法: 基于东北地区的实证研究. 自然资源学报, 2021, 36(8): 2051-2064.
[
|
| [5] |
李博, 张旭辉. 资源型城市经济转型与服务业发展: 基于中国107座地级资源型城市的比较分析. 西部论坛, 2018, 28(3): 25-32, 99.
[
|
| [6] |
申红艳. 中国衰退型制造业城市产业重构研究. 北京: 北京师范大学, 2019.
[
|
| [7] |
李逢春, 李程骅. 现代服务业推动城市转型发展: 实践、验证及路径. 上海经济研究, 2013, 25(12): 22-30.
[
|
| [8] |
|
| [9] |
邓兰兰. 基于资源型城市转型的生产性服务业发展研究. 商业研究, 2012, (8): 90-95.
[
|
| [10] |
|
| [11] |
|
| [12] |
|
| [13] |
李程骅, 郑琼洁. 中国服务业发展如何推动城市转型进程? 基于SYS-GMM的实证检验. 学习与探索, 2016, (11): 89-98.
[
|
| [14] |
陈妍, 梅林. 东北地区资源型城市转型过程中社会—经济—环境协调演化特征. 地理研究, 2018, 37(2): 307-318.
[
|
| [15] |
|
| [16] |
李程骅. 现代服务业推动城市转型研究. 北京: 中国社会科学出版社, 2017.
[
|
| [17] |
方远平, 唐瑶, 陈宏洋, 等. 中国城市群知识密集型服务业集聚与经济增长关系研究: 基于动态面板数据的GMM方法. 经济问题探索, 2018, (2): 85-93.
[
|
| [18] |
胡晓辉, 张文忠. 制度演化与区域经济弹性—两个资源枯竭型城市的比较. 地理研究, 2018, 37(7): 1308-1319.
[
|
| [19] |
胡晓辉, 朱晟君,
[
|
| [20] |
刘霆, 李业锦, 任悦悦, 等. 中国资源枯竭型城市转型的影响因素. 资源与产业, 2019, 21(1): 45-53.
[
|
| [21] |
张旺, 申玉铭, 曾春水. 十五以来中国资源型城市服务业发展研究. 经济地理, 2012, 32(8): 57-63.
[
|
| [22] |
王晓楠, 孙威. 黄河流域资源型城市转型效率及其影响因素. 地理科学进展, 2020, 39(10): 1643-1655.
[
|
| [23] |
陈强. 高级计量经济学及Stata应用(第二版). 北京: 高等教育出版社, 2014.
[
|
| [24] |
|
| [25] |
罗军, 陈建国. FDI、人力资本门槛与就业: 基于门槛效应的检验. 世界经济研究, 2014, (7): 74-89.
[
|
| [26] |
陈妍, 梅林. 东北地区资源型城市经济转型发展波动特征与影响因素: 基于面板数据模型的分析. 地理科学, 2017, 37(7): 1080-1086.
[
|
| [27] |
裴耀琳, 郭淑芬. 资源禀赋约束下型服务业集聚的产业结构调整效应研究: 基于资源型城市与非资源型城市的对比分析. 软科学, 2021, 35(1): 62-67.
[
|
| [28] |
张大鹏. 旅游业推动资源枯竭型城市转型发展研究. 北京: 经济科学出版社, 2019.
[
|
| [29] |
白雪洁, 汪海凤, 孙红印. 金融发展、资源特征与城市转型. 经济管理研究, 2016, 37(2): 35-43.
[
|
| [30] |
孙威, 李洪省. 中国资源枯竭城市的区位条件辨析. 地理学报, 2013, 68(2): 199-208.
[
|
/
| 〈 |
|
〉 |