
产业转型对中国资源型城市增长与收缩演变轨迹的影响机制
|
吴康(1984- ),男,江苏淮安人,博士,教授,博士生导师,研究方向为城市经济与空间治理、大数据与城市可持续发展。E-mail: wukang@cueb.edu.cn |
收稿日期: 2022-07-04
修回日期: 2022-10-25
网络出版日期: 2023-01-28
基金资助
国家自然科学基金项目(42171216)
国家自然科学基金项目(71733001)
青年北京学者计划(041)
首都经济贸易大学青年创新团队项目(QNTD202009)
The mechanisms of industrial transformation on the evolutionary trajectory of growth and shrinkage in Chinese resource-based cities
Received date: 2022-07-04
Revised date: 2022-10-25
Online published: 2023-01-28
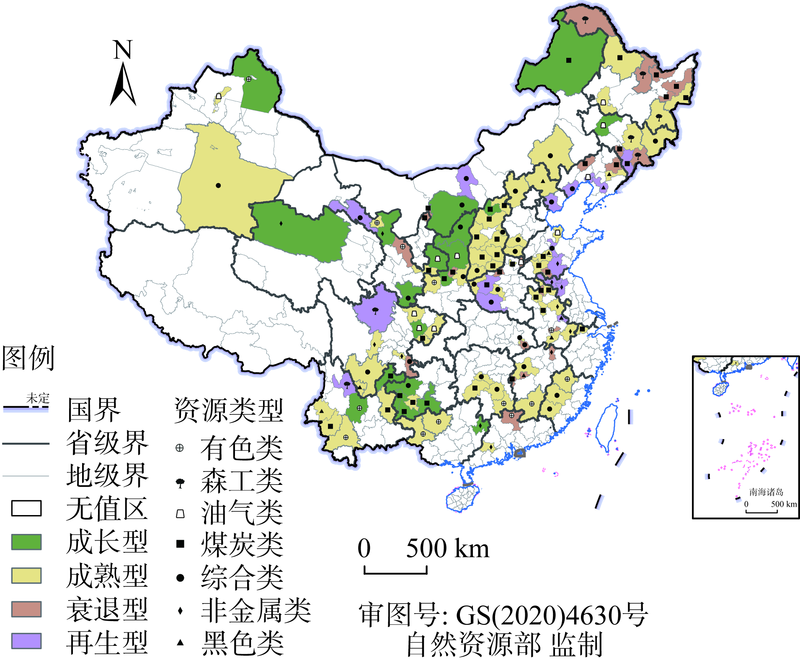
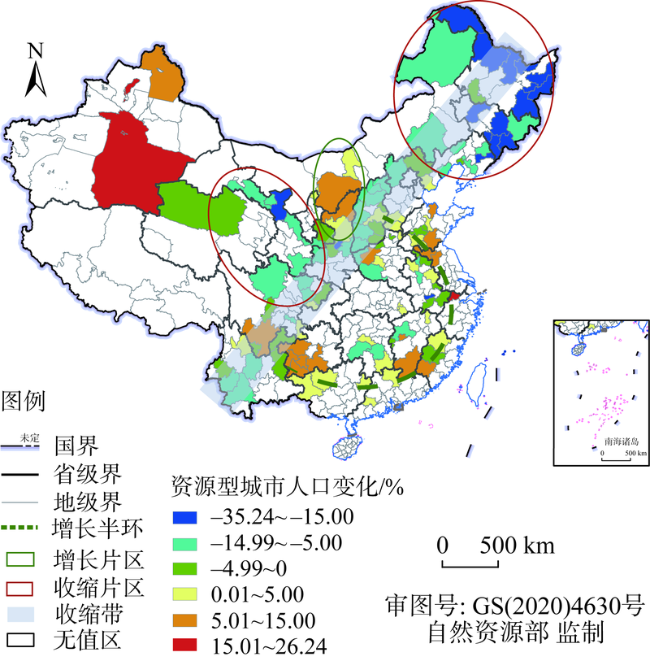
中国正进入高质量发展阶段,资源型城市的增长与收缩面临着内外部条件的系统性重构,资源型城市在转型发展过程中如何摆脱“矿竭城衰”的历史宿命,实现城市人口的正增长,目前尚缺乏经验证据。本文采用2010—2020年116个资源型城市的截面与面板数据,定量刻画了资源型城市增长与收缩的演变轨迹,并实证考察了产业结构转型对人口增减变化的相关影响机制。研究发现:中国六成以上的资源型城市在研究期内表现为收缩状态,呈现出“一带两片”的空间分布格局;产业结构合理化和高级化在短期内均对资源型城市的人口增长表现为挤出效应,长期来看,产业结构合理化的影响转为正向,产业结构高级化的补偿效应暂未显现;产业结构多样化在短期内可促进资源型城市人口的增长,但长期来看并不显著。基于此,资源型城市的转型发展需要以提高产业结构合理化水平为重要突破口,以产业结构高级化为长期主线,基于地方比较优势实施产业延伸与产业更新并行战略,构建多元化的产业体系,不同类型、不同发展阶段资源型城市的产业结构转型应强调战略差异化。
吴康 , 刘骁啸 , 姚常成 . 产业转型对中国资源型城市增长与收缩演变轨迹的影响机制[J]. 自然资源学报, 2023 , 38(1) : 109 -125 . DOI: 10.31497/zrzyxb.20230107
In the new high-quality development stage, the growth and shrinkage of resource-based cities face a systematic reconfiguration of internal and external conditions. There is a lack of empirical evidence on how resource-based cities can escape from the historical fate of "exhaustion of mines and decline of cities" and achieve positive urban population growth in the process of transformation and development. This paper uses cross-sectional and panel data of 116 resource-based cities from 2010 to 2020 to quantitatively characterize their trajectory of growth and shrinkage, and empirically investigate the influence mechanism of industrial structure transformation on population growth and decline. The study finds that more than 60% of resource-based cities in China were shrinking during the study period, showing a geographical distribution pattern of "one belt and two areas". The rationalization and upgrading of industrial structure both show crowding-out effects on the population growth of resource-based cities in the short term, and in the long term, the effect of industrial structure rationalization turns positive, while the compensating effect of industrial structure upgrading is not yet apparent. In the long run, the impact of industrial structure rationalization turns positive, while the compensating effect of industrial structure upgrading has not yet appeared. The diversity of industrial structure can promote the population growth of resource-based cities in the short term, but this effect is not significant in the long term. Based on those findings, the transformation and development of resource-based cities need to improve the level of industrial structure rationalization as an important breakthrough, take industrial structure upgrading as a long-term main line, implement parallel strategies of industrial extension and industrial renewal based on local comparative advantages, and build a diversified industrial system. The industrial structure transformation of resource-based cities of different types and development stages should emphasize strategic differentiation.
表1 2010—2020年不同类型资源型城市人口变化情况Table 1 Population change in different types of resource-based cities during 2010-2020 |
| 方式 | 类型 | 常住人口变化率/% | |||||
|---|---|---|---|---|---|---|---|
| ≤ -15 | -15~ -5 | -5~0 | 0~5 | 5~15 | ≥15 | ||
| 发展阶段 | 成长型 | 2 | 4 | 3 | 2 | 4 | 0 |
| 成熟型 | 5 | 20 | 17 | 15 | 4 | 2 | |
| 衰退型 | 8 | 4 | 2 | 8 | 1 | 0 | |
| 再生型 | 1 | 4 | 2 | 4 | 4 | 0 | |
| 资源类型 | 非金属类 | 1 | 1 | 2 | 4 | 3 | 0 |
| 黑色类 | 1 | 1 | 6 | 0 | 1 | 0 | |
| 煤炭类 | 8 | 13 | 10 | 7 | 3 | 1 | |
| 森工类 | 4 | 0 | 0 | 1 | 0 | 0 | |
| 油气类 | 1 | 2 | 4 | 2 | 1 | 1 | |
| 有色类 | 1 | 4 | 0 | 5 | 1 | 0 | |
| 综合类 | 0 | 11 | 2 | 10 | 4 | 0 | |
表2 产业结构转型对资源型城市人口增长的回归结果Table 2 Regression results of industrial structure transformation on population growth in resource-based cities |
| 变量 | 模型1 | 模型2 | 模型3 |
|---|---|---|---|
| GPOP | GPOP | GPOP | |
| OIS | -1.269*** | -1.215*** | -1.198*** |
| (-3.85) | (-3.82) | (-3.77) | |
| RIS | 0.011** | 0.011** | |
| (2.26) | (2.25) | ||
| RDI | 0.036* | ||
| (1.81) | |||
| POP | -0.401*** | -0.408*** | -0.409*** |
| (-7.23) | (-7.59) | (-7.62) | |
| RE | -0.611*** | -0.531*** | -0.497** |
| (-3.11) | (-2.77) | (-2.58) | |
| WAGE | 0.044 | 0.049 | 0.051* |
| (1.43) | (1.62) | (1.74) | |
| MP | 0.122 | 0.148 | 0.120 |
| (1.03) | (1.27) | (1.01) | |
| SCI | 0.011 | 0.010 | 0.011* |
| (1.64) | (1.54) | (1.81) | |
| FDI | 0.008** | 0.008** | 0.009*** |
| (2.47) | (2.59) | (2.70) | |
| DOC | -0.059*** | -0.061*** | -0.062*** |
| (-3.36) | (-3.42) | (-3.43) | |
| TEA | -0.090** | -0.095** | -0.093** |
| (-2.34) | (-2.50) | (-2.47) | |
| Constant | 4.331*** | 4.126*** | 4.182*** |
| (5.26) | (5.26) | (5.30) | |
| N/个 | 805 | 805 | 805 |
| city | yes | yes | yes |
| year | yes | yes | yes |
| R2 | 0.298 | 0.304 | 0.308 |
注:***、**、*分别表示在1%、5%、10%水平上显著,括号内为t统计值,下同。 |
表3 产业结构转型对资源型城市人口变化中长期影响的回归结果Table 3 Regression results of industrial structure transformation on population change in resource-based cities in the medium and long term |
| 变量 | 模型1 | 模型2 | 模型3 |
|---|---|---|---|
| GPOP | GPOP | GPOP | |
| OIS | -1.286*** | -1.277*** | -1.145** |
| (-2.92) | (-2.76) | (-2.43) | |
| RIS | 0.011* | 0.012* | 0.012* |
| (1.78) | (1.78) | (1.66) | |
| RDI | 0.032* | 0.024 | 0.009 |
| (1.87) | (1.44) | (0.41) | |
| L.OIS | 0.240 | 0.491 | 0.504 |
| (0.55) | (1.10) | (1.33) | |
| L2.OIS | -0.456 | 0.211 | |
| (-1.27) | (0.67) | ||
| L3.OIS | -1.383*** | ||
| (-5.79) | |||
| L.RIS | 0.003 | 0.005 | -0.003 |
| (0.63) | (1.06) | (-0.45) | |
| L2.RIS | 0.000 | 0.005 | |
| (0.04) | (1.12) | ||
| L3.RIS | -0.008* | ||
| (-1.77) | |||
| L.RDI | 0.011 | 0.000 | 0.016 |
| (0.49) | (0.01) | (0.52) | |
| L2.RDI | 0.012 | 0.021 | |
| (0.45) | (0.65) | ||
| L3.RDI | -0.011 | ||
| (-0.43) | |||
| Constant | 3.785*** | 4.411*** | 5.544*** |
| (4.35) | (3.61) | (4.34) | |
| 控制变量 | yes | yes | yes |
| N/个 | 720 | 631 | 546 |
| city | yes | yes | yes |
| year | yes | yes | yes |
| R2 | 0.337 | 0.359 | 0.403 |
表4 产业结构转型对资源型城市人口增长的回归结果(替换被解释变量)Table 4 Regression results of industrial structure transformation on population growth in resource-based cities (replacing the explanatory variables) |
| 变量 | 模型1 | 模型2 | 模型3 | 模型4 |
|---|---|---|---|---|
| GR | GR | GR | GR | |
| OIS | -131.24*** | -125.72*** | -123.93*** | -118.123** |
| (-3.86) | (-3.83) | (-3.78) | (-2.43) | |
| RIS | 1.148** | 1.132** | 1.255* | |
| (2.26) | (2.25) | (1.66) | ||
| RDI | 3.732* | 0.925 | ||
| (1.82) | (0.41) | |||
| L.OIS | 51.805 | |||
| (1.32) | ||||
| L2.OIS | 22.010 | |||
| (0.67) | ||||
| L3.OIS | -142.607*** | |||
| (-5.80) | ||||
| L.RIS | -0.270 | |||
| (-0.46) | ||||
| L2.RIS | 0.552 | |||
| (1.12) | ||||
| L3.RIS | -0.779* | |||
| (-1.78) | ||||
| L.RDI | 1.687 | |||
| (0.52) | ||||
| L2.RDI | 2.104 | |||
| (0.64) | ||||
| L3.RDI | -1.131 | |||
| (-0.42) | ||||
| 控制变量 | yes | yes | yes | yes |
| Constant | 349.93*** | 328.80*** | 334.56*** | 470.232*** |
| (4.12) | (4.06) | (4.11) | (3.58) | |
| N/个 | 805 | 805 | 805 | 546 |
| city | yes | yes | yes | yes |
| year | yes | yes | yes | yes |
| R2 | 0.305 | 0.311 | 0.315 | 0.405 |
表5 内生性问题处理结果Table 5 Results for endogeneity issues |
| 变量 | 模型1 | 模型2 | 模型3 | 模型4 | 模型5 | 模型6 |
|---|---|---|---|---|---|---|
| GPOP | GPOP | GPOP | GR | GR | GR | |
| OIS | -0.209* | -21.642* | ||||
| (-1.82) | (-1.82) | |||||
| RIS | 0.014** | 1.407** | ||||
| (2.51) | (2.52) | |||||
| RDI | 0.024* | 2.516* | ||||
| (1.94) | (1.94) | |||||
| 控制变量 | yes | yes | yes | yes | yes | yes |
| Constant | 1.130*** | 1.025*** | 0.859*** | 18.306 | 7.678 | -9.679 |
| (4.35) | (4.67) | (4.26) | (0.68) | (0.34) | (-0.46) | |
| N/个 | 805 | 805 | 805 | 805 | 805 | 805 |
| Model | 工具变量 | 工具变量 | 工具变量 | 工具变量 | 工具变量 | 工具变量 |
| R2 | 0.112 | 0.110 | 0.085 | 0.140 | 0.135 | 0.111 |
表6 产业结构转型对资源型城市人口增长的异质性分析Table 6 Heterogeneity analysis of industrial structure transformation on population growth in resource-based cities |
| 变量 | 模型1 | 模型2 | 模型3 | 模型4 | 模型5 | 模型6 |
|---|---|---|---|---|---|---|
| Growth样本组 GPOP | Shrinkage样本组 GPOP | 成长型城市 GPOP | 成熟型城市 GPOP | 衰退型城市 GPOP | 再生型城市 GPOP | |
| OIS | -1.812*** | -0.884*** | -0.560 | -2.168*** | 0.329 | 1.005 |
| (-4.67) | (-3.13) | (-0.69) | (-4.26) | (1.47) | (1.65) | |
| RIS | 0.008 | 0.013** | 0.031 | 0.023** | -0.011* | 0.009 |
| (1.00) | (2.23) | (0.97) | (2.20) | (-2.00) | (1.04) | |
| RDI | 0.037* | 0.055** | 0.174 | 0.051* | 0.021 | 0.004 |
| (1.65) | (2.02) | (1.45) | (1.72) | (0.99) | (0.10) | |
| 控制变量 | yes | yes | yes | yes | yes | yes |
| N/个 | 392 | 413 | 64 | 435 | 185 | 121 |
| city | yes | yes | yes | yes | yes | yes |
| year | yes | yes | yes | yes | yes | yes |
| R2 | 0.321 | 0.371 | 0.548 | 0.380 | 0.393 | 0.554 |
表7 产业结构转型对资源型城市人口增长的异质性分析(替换被解释变量)Table 7 Heterogeneity analysis of industrial structure transformation on population growth in resource-based cities (replacing the explanatory variables) |
| 变量 | 模型1 | 模型2 | 模型3 | 模型4 | 模型5 | 模型6 |
|---|---|---|---|---|---|---|
| Growth样本组 GR | Shrinkage样本组 GR | 成长型城市 GR | 成熟型城市 GR | 衰退型城市 GR | 再生型城市 GR | |
| OIS | -187.723*** | -91.226*** | -58.240 | -224.000*** | 33.993 | 103.880 |
| (-4.67) | (-3.12) | (-0.70) | (-4.25) | (1.47) | (1.66) | |
| RIS | 0.865 | 1.365** | 3.202 | 2.392** | -1.186* | 0.886 |
| (1.00) | (2.23) | (0.97) | (2.19) | (-1.99) | (1.06) | |
| RDI | 3.819* | 5.704** | 18.078 | 5.257* | 2.218 | 0.448 |
| (1.66) | (2.03) | (1.45) | (1.72) | (0.99) | (0.11) | |
| 控制变量 | yes | yes | yes | yes | yes | yes |
| N/个 | 392 | 413 | 64 | 435 | 185 | 121 |
| city | yes | yes | yes | yes | yes | yes |
| year | yes | yes | yes | yes | yes | yes |
| R2 | 0.327 | 0.377 | 0.558 | 0.387 | 0.373 | 0.558 |
| [1] |
徐博, 王宝珍. 城缩之维与规治之变: 国际城市收缩问题的历史演化逻辑研究. 东北师大学报: 哲学社会科学版, 2018, (4): 168-175.
[
|
| [2] |
张京祥, 赵丹, 陈浩. 增长主义的终结与中国城市规划的转型. 城市规划, 2013, 37(1): 45-55.
[
|
| [3] |
李郇, 吴康, 龙瀛, 等. 局部收缩: 后增长时代下的城市可持续发展争鸣. 地理研究, 2017, 36(10): 1997-2006.
[
|
| [4] |
吴康, 李耀川. 收缩情景下城市土地利用及其生态系统服务的研究进展. 自然资源学报, 2019, 34(5): 1121-1134.
[
|
| [5] |
吴康, 戚伟. 收缩型城市: 认知误区、统计甄别与测算反思. 地理研究, 2021, 40(1): 213-229.
[
|
| [6] |
余建辉, 李佳洺, 张文忠. 中国资源型城市识别与综合类型划分. 地理学报, 2018, 73(4): 677-687.
[
|
| [7] |
卢硕, 张文忠, 余建辉, 等. 资源型城市演化阶段识别及其发展特征. 地理学报, 2020, 75(10): 2180-2191.
[
|
| [8] |
胡语宸, 刘艳军, 孙宏日. 城市增长与收缩的演变过程及其影响因素: 以黑龙江省煤炭资源型城市为例. 地理科学, 2020, 40(9): 1450-1459.
[
|
| [9] |
|
| [10] |
|
| [11] |
吴康, 龙瀛, 杨宇. 京津冀与长江三角洲的局部收缩: 格局、类型与影响因素识别. 现代城市研究, 2015, (9): 26-35.
[
|
| [12] |
毛蒋兴, 何邕健. 资源型城市生命周期模型研究. 地理与地理信息科学, 2008, 24(1): 56-60.
[
|
| [13] |
贾敬敦, 黄黔, 徐铭. 中国资源(矿业)枯竭型城市经济转型科技战略研究. 北京: 中国农业科学技术出版社, 2004.
[
|
| [14] |
刘云刚. 中国资源型城市界定方法的再考察. 经济地理, 2006, 26(6): 940-944.
[
|
| [15] |
刘云刚. 中国资源型城市的职能分类与演化特征. 地理研究, 2009, 28(1): 153-160.
[
|
| [16] |
孙威, 李洪省. 中国资源枯竭城市的区位条件辨析. 地理学报, 2013, 68(2): 199-208.
[
|
| [17] |
张文忠. 中国资源型城市可持续发展研究. 北京: 科学出版社, 2014.
[
|
| [18] |
孙淼, 丁四保. 中国资源型城市衰退的体制原因分析. 经济地理, 2005, 25(2): 273-276.
[
|
| [19] |
董丽晶, 张平宇. 老工业城市产业转型及其就业变化研究: 以沈阳市为例. 地理科学, 2008, 28(2): 162-168.
[
|
| [20] |
李博, 佟连军, 韩增林. 东北地区煤炭城市脆弱性与可持续发展模式. 地理研究, 2010, 29(2): 361-372.
[
|
| [21] |
张文忠, 王岱. 中国资源型城市的城镇化特征和发展路径选择. 中国国土资源经济, 2014, (6): 12-17.
[
|
| [22] |
张文忠, 余建辉, 王岱. 中国资源型城市转型路径和模式研究. 城市与区域规划, 2011, 4(1): 41-56.
[
|
| [23] |
|
| [24] |
王常君, 曲阳阳, 吴相利. 资源枯竭型城市的经济—人口收缩治理研究: 基于黑龙江省资源枯竭型城市的现实分析. 宏观经济研究, 2019, (8): 156-169.
[
|
| [25] |
杜志威, 李郇. 基于人口变化的东莞城镇增长与收缩特征和机制研究. 地理科学, 2018, 38(11): 1837-1846.
[
|
| [26] |
孟祥凤, 王冬艳, 李红. 东北老工业城市收缩的驱动力分析. 现代城市研究, 2020, (3): 25-32.
[
|
| [27] |
|
| [28] |
余建辉, 张文忠. 中国资源枯竭城市的转型效果评价. 自然资源学报, 2011, 26(1): 11-21.
[
|
| [29] |
张文忠, 余建辉, 李佳洺. 资源枯竭城市转型的驱动因素和机理解析. 中国科学院院刊, 2016, 31(1): 92-100.
[
|
| [30] |
李虹, 邹庆. 环境规制、资源禀赋与城市产业转型研究: 基于资源型城市与非资源型城市的对比分析. 经济研究, 2018, 53(11): 182-197.
[
|
| [31] |
苗长虹, 胡志强, 耿凤娟, 等. 中国资源型城市经济演化特征与影响因素: 路径依赖、脆弱性和路径创造的作用. 地理研究, 2018, 37(7): 1268-1281.
[
|
| [32] |
孙天阳, 陆毅, 成丽红. 资源枯竭型城市扶助政策实施效果、长效机制与产业升级. 中国工业经济, 2020, (7): 98-116.
[
|
| [33] |
柯善咨, 赵曜. 产业结构、城市规模与中国城市生产率. 经济研究, 2014, 49(4): 76-88, 115.
[
|
| [34] |
|
| [35] |
周学良. 产业结构升级的就业效应分析. 金融发展研究, 2015, (2): 21-26.
[
|
| [36] |
王莹莹, 童玉芬. 产业集聚与结构高度化对北京人口规模的影响: 膨胀还是收敛?. 人口学刊, 2015, 37(6): 5-13.
[
|
| [37] |
袁冬梅, 信超辉, 袁珶. 产业集聚模式选择与城市人口规模变化: 来自285个地级及以上城市的经验证据. 中国人口科学, 2019, (6): 46-58.
[
|
| [38] |
马佐澎, 李诚固, 张平宇. 东北三省城镇收缩的特征及机制与响应. 地理学报, 2021, 76(4): 767-780.
[
|
| [39] |
|
| [40] |
周振华. 论现代经济增长与产业结构优化. 财经研究, 1990, (6): 14-19, 64.
[
|
| [41] |
傅元海, 叶祥松, 王展祥. 制造业结构优化的技术进步路径选择: 基于动态面板的经验分析. 中国工业经济, 2014, (9): 78-90.
[
|
| [42] |
干春晖, 郑若谷, 余典范. 中国产业结构变迁对经济增长和波动的影响. 经济研究, 2011, 46(5): 4-16, 31.
[
|
| [43] |
付凌晖. 中国产业结构高级化与经济增长关系的实证研究. 统计研究, 2010, 27(8): 79-81.
[
|
| [44] |
曾刚, 陆琳忆, 何金廖. 生态创新对资源型城市产业结构与工业绿色效率的影响. 资源科学, 2021, 43(1): 94-103.
[
|
| [45] |
张复明, 景普秋. 资源型经济的形成: 自强机制与个案研究. 中国社会科学, 2008, (5): 117-130, 207.
[
|
| [46] |
李金滟, 宋德勇. 专业化、多样化与城市集聚经济: 基于中国地级单位面板数据的实证研究. 管理世界, 2008, (2): 25-34.
[
|
| [47] |
刘修岩, 宋萍. 市场潜能与城市增长: 基于中国城市数据的实证研究. 东南大学学报: 哲学社会科学版, 2015, 17(6): 74-83, 147.
[
|
| [48] |
陈妍, 梅林. 东北地区资源型城市人口分布与影响因素的定量分析. 地理科学, 2018, 38(3): 402-409.
[
|
| [49] |
刘贵文, 谢芳芸, 洪竞科, 等. 基于人口经济数据分析中国城市收缩现状. 经济地理, 2019, 39(7): 50-57.
[
|
| [50] |
|
| [51] |
|
| [52] |
魏守华, 杨阳, 陈珑隆. 城市级、人口增长差异与城镇体系演变. 中国工业经济, 2020, (7): 5-23.
[
|
| [53] |
|
| [54] |
周茂, 陆毅, 李雨浓. 地区产业升级与劳动收入份额: 基于合成工具变量的估计. 经济研究, 2018, 53(11): 132-147.
[
|
| [55] |
|
| [56] |
段存儒, 曾贤刚. 中国资源型城市转型对劳动力需求的影响. 自然资源学报, 2021, 36(3): 606-617.
[
|
/
| 〈 |
|
〉 |
