
中国高等级旅游景区资源多尺度时空差异及其影响因素
|
张广海(1963- ),男,山东临沂人,博士,教授,博士生导师,主要从事旅游开发规划与管理、区域经济研究。E-mail: guanghaizh@163.com |
收稿日期: 2021-09-06
修回日期: 2021-10-23
网络出版日期: 2022-12-28
基金资助
国家社会科学基金项目(19BGL138)
山东省社会科学规划项目(19CDNJ14)
Multiscale analysis of the spatiotemporal differences and the influencing factors of the high-level tourist attractions in China
Received date: 2021-09-06
Revised date: 2021-10-23
Online published: 2022-12-28
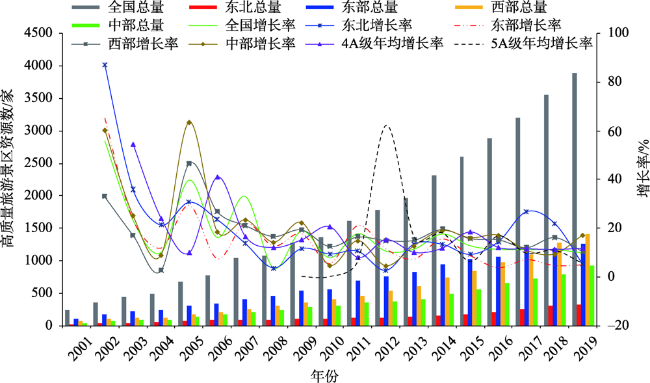
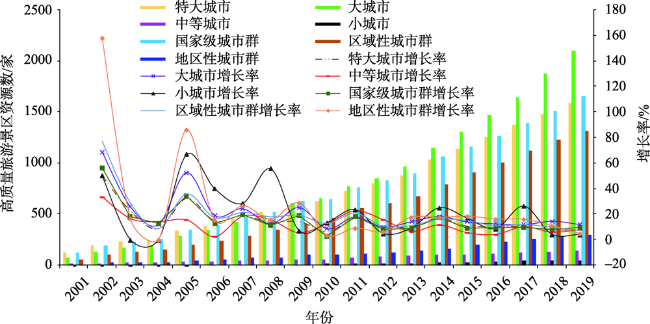
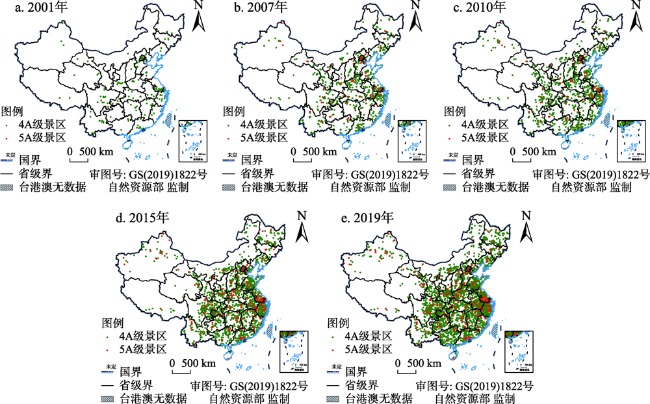
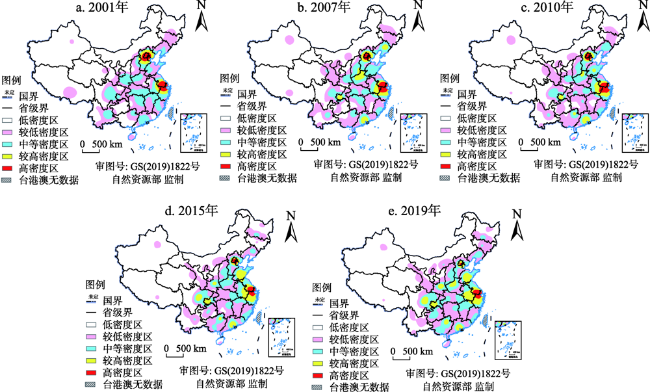
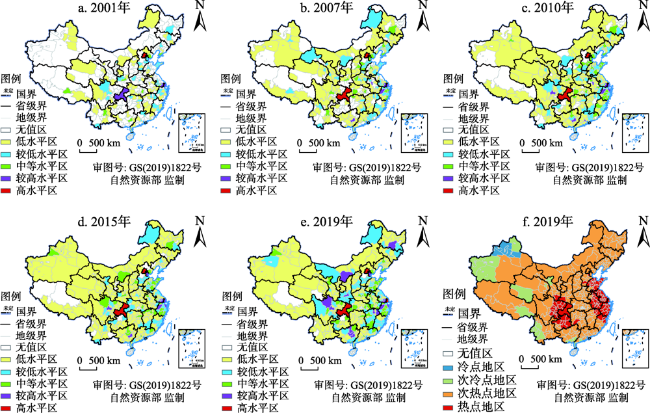
以中国337个地级以上城市内的5A和4A级景区为研究对象,通过构建总体分异指数(GDI)并采用探索性空间数据分析(ESDA)等方法,从省级、城市群、城市等不同空间尺度,对2001—2019年中国高等级旅游景区资源时空演化特征进行综合分析。结果表明:(1)4A级景区主导了中国高等级旅游景区数量与增长率的变化趋势,2015年之后增长速度进入相对平缓状态;(2)时序上,中部和东北地区的各省份高等级旅游景区数量较少,但增长率较高,而西部省份则均相对较高,东部省份则是数量最多但增长率最低,到2017年西部超过东部,数量最多;城市规模与高等级旅游景区数量呈正比,与增长率呈反比;(3)空间上,中国高等级旅游景区分布密集程度逐年升高,呈现出主要依托东部沿海地区与中部地区城市群集聚分布的特征,且空间热点、次热点地区占主导地位,形成了“两点集聚—多极多区—集群集聚”的空间演化格局;(4)GDI指数随着研究尺度的缩小而增大,空间尺度越小,高等级旅游景区资源的差异越大;(5)中国高等级旅游景区空间分布主要受社会、经济、资源等因素相互作用的影响,其中人口规模、旅游经济、人文资源是共同的最为关键的因子。研究结果可为优化中国景区资源空间布局以及旅游业高质量及区域协调发展提供一定参考。
张广海 , 袁洪英 , 段若曦 , 董跃蕾 . 中国高等级旅游景区资源多尺度时空差异及其影响因素[J]. 自然资源学报, 2022 , 37(10) : 2672 -2687 . DOI: 10.31497/zrzyxb.20221014
Taking 4A and 5A scenic spots of high-level tourist attractions in 337 cities in China as the research object, the spatial and temporal evolution characteristics of high-level tourist attraction resources in China from 2001 to 2019 were comprehensively analyzed by constructing the overall differentiation index (GDI) and using exploratory spatial data analysis (ESDA). The results show that: (1) In China, 4A scenic spots dominate the developing trend of high-level tourist attractions in number and growth, and the growth rate enters a period of being relatively stable after 2015. (2) According to the time sequence analysis, the number of high-level tourist attractions in the central and northeast regions is small, but the growth rate is higher than that of other regions. In the western region, there is a large number of high-level tourist attractions and they are increasing fast, while the eastern region has the most high-level tourist attractions, they are experiencing the lowest growth rate, exceeded by the western region in number in 2017. The size of the city is proportional to the number of high-level tourist attractions, inversely proportional to the growth rate. (3) From the spatial perspective, the distribution density of high-level tourist attractions in China is increasing year by year. The density of high-level tourist attractions is related to the agglomeration of urban agglomerations in coastal areas and the central region. The spatial hot spots and sub-hot spots occupy the dominant position, forming a pattern of "two points agglomeration, multi-pole and multi-region agglomeration, clusters agglomeration". (4) The GDI index increases with the reduction of the research scale, and the smaller the spatial scale is, the greater the differences between high-level tourist attraction resources are. (5) The spatial distribution characteristics of high-level tourist attractions in China are influenced by the interaction of social factors, economic factors, resource factors and other factors, among which, the population scale, tourism economy as well as human and culture resources are critical. The research results can provide some reference for optimizing the spatial layout of scenic spots resources and coordinating high-quality regional development of tourism in China.
表1 多尺度下中国高等级旅游景区GDI指数Table 1 GDI index of high-level tourist attractions in China at multiple scales |
| 年份 | 全国GDI指数 | 四大区域GDI指数 | 城市群GDI指数 | 城市GDI指数 | |||||||||||||
|---|---|---|---|---|---|---|---|---|---|---|---|---|---|---|---|---|---|
| 省级 | 四大区域 | 城市 | 东部 | 中部 | 西部 | 东北 | 国家级 | 区域性 | 地区性 | 特大城市 | 大城市 | 中等城市 | 小城市 | ||||
| 2001 | 0.29 | 0.26 | 2.95 | 0.23 | 0.10 | 0.27 | 0.24 | 0.22 | 0.81 | 0.40 | 2.29 | 2.83 | 2.42 | 3.08 | |||
| 2002 | 0.31 | 0.26 | 2.69 | 0.22 | 0.11 | 0.30 | 0.21 | 0.23 | 1.06 | 0.30 | 2.13 | 2.50 | 2.58 | 2.74 | |||
| 2003 | 0.33 | 0.25 | 2.44 | 0.24 | 0.15 | 0.31 | 0.26 | 0.25 | 1.02 | 0.34 | 1.83 | 2.23 | 2.48 | 2.74 | |||
| 2004 | 0.34 | 0.24 | 2.39 | 0.21 | 0.15 | 0.31 | 0.34 | 0.25 | 1.05 | 0.34 | 1.73 | 2.20 | 2.61 | 2.74 | |||
| 2005 | 0.32 | 0.22 | 2.03 | 0.24 | 0.13 | 0.27 | 0.33 | 0.27 | 0.34 | 0.32 | 1.51 | 1.80 | 2.38 | 2.54 | |||
| 2006 | 0.30 | 0.19 | 1.84 | 0.23 | 0.13 | 0.29 | 0.30 | 0.24 | 0.25 | 0.34 | 1.37 | 1.63 | 2.38 | 2.03 | |||
| 2007 | 0.28 | 0.20 | 1.62 | 0.25 | 0.13 | 0.23 | 0.21 | 0.26 | 0.22 | 0.28 | 1.22 | 1.39 | 2.34 | 1.57 | |||
| 2008 | 0.27 | 0.21 | 1.45 | 0.27 | 0.10 | 0.21 | 0.19 | 0.24 | 0.21 | 0.26 | 1.15 | 1.23 | 2.12 | 0.99 | |||
| 2009 | 0.28 | 0.21 | 1.22 | 0.29 | 0.11 | 0.21 | 0.24 | 0.25 | 0.19 | 0.19 | 1.02 | 0.96 | 1.92 | 1.00 | |||
| 2010 | 0.28 | 0.21 | 1.05 | 0.29 | 0.11 | 0.24 | 0.18 | 0.22 | 0.19 | 0.18 | 0.88 | 0.80 | 1.70 | 0.78 | |||
| 2011 | 0.29 | 0.22 | 0.94 | 0.32 | 0.11 | 0.24 | 0.15 | 0.23 | 0.22 | 0.15 | 0.76 | 0.68 | 1.78 | 0.85 | |||
| 2012 | 0.31 | 0.23 | 0.94 | 0.34 | 0.10 | 0.26 | 0.14 | 0.23 | 0.23 | 0.14 | 0.75 | 0.69 | 1.61 | 0.86 | |||
| 2013 | 0.31 | 0.23 | 0.80 | 0.36 | 0.07 | 0.26 | 0.14 | 0.22 | 0.23 | 0.15 | 0.64 | 0.57 | 1.43 | 0.64 | |||
| 2014 | 0.31 | 0.23 | 0.75 | 0.36 | 0.04 | 0.27 | 0.20 | 0.22 | 0.23 | 0.14 | 0.59 | 0.53 | 1.45 | 0.61 | |||
| 2015 | 0.31 | 0.22 | 0.68 | 0.37 | 0.04 | 0.27 | 0.23 | 0.23 | 0.24 | 0.16 | 0.49 | 0.48 | 1.26 | 0.66 | |||
| 2016 | 0.31 | 0.21 | 0.62 | 0.38 | 0.06 | 0.29 | 0.14 | 0.23 | 0.23 | 0.16 | 0.46 | 0.41 | 1.20 | 0.74 | |||
| 2017 | 0.29 | 0.19 | 0.55 | 0.38 | 0.06 | 0.28 | 0.09 | 0.22 | 0.22 | 0.17 | 0.39 | 0.36 | 1.19 | 0.55 | |||
| 2018 | 0.30 | 0.18 | 0.50 | 0.39 | 0.07 | 0.31 | 0.07 | 0.22 | 0.21 | 0.19 | 0.39 | 0.29 | 1.24 | 0.59 | |||
| 2019 | 0.30 | 0.18 | 0.49 | 0.40 | 0.07 | 0.32 | 0.08 | 0.21 | 0.19 | 0.21 | 0.39 | 0.29 | 1.25 | 0.59 | |||
| 方差 | 0.00 | 0.00 | 0.64 | 0.00 | 0.00 | 0.00 | 0.01 | 0.00 | 0.10 | 0.01 | 0.37 | 0.67 | 0.28 | 0.86 | |||
表2 多尺度下高等级旅游景区资源分布影响因子探测结果Table 2 Detected results of driving factors of resource distribution of high-level tourist attractions at multiple scales |
| 探测指标 | x1 | x2 | x3 | x4 | x5 | x6 | x7 | x8 | x9 |
|---|---|---|---|---|---|---|---|---|---|
| 省级 | 0.794*** | 0.544*** | 0.135*** | 0.022*** | 0.663*** | 0.604*** | 0.473*** | 0.070*** | 0.255*** |
| 城市群 | 0.791*** | 0.408*** | 0.670*** | 0.674*** | 0.949*** | 0.750*** | 0.458*** | 0.247*** | 0.558*** |
| 城市 | 0.670*** | 0.049*** | 0.053*** | 0.063*** | 0.639*** | 0.643*** | 0.149*** | 0.014*** | 0.054*** |
注:***P<0.01。 |
表3 多尺度下高等级旅游景区资源分布影响因子交互探测结果Table 3 Interactive detection results of driving factors of resource distribution of high-level tourist attractions at multiple scales |
| 交互因子 | 省级 | 城市群 | 城市 | 交互因子 | 省级 | 城市群 | 城市 |
|---|---|---|---|---|---|---|---|
| x1∩x2 | 0.926 | 0.987 | 0.704 | x3∩x7 | 0.841 | 0.817 | 0.296 |
| x1∩x3 | 0.871 | 0.811 | 0.716 | x3∩x8 | 0.269 | 0.807 | 0.140 |
| x1∩x4 | 0.849 | 0.797 | 0.711 | x3∩x9 | 0.734 | 0.795 | 0.189 |
| x1∩x5 | 0.818 | 0.981 | 0.770 | x4∩x5 | 0.687 | 0.981 | 0.767 |
| x1∩x6 | 0.925 | 0.794 | 0.768 | x4∩x6 | 0.659 | 0.797 | 0.762 |
| x1∩x7 | 0.904 | 0.989 | 0.709 | x4∩x7 | 0.593 | 0.818 | 0.325 |
| x1∩x8 | 0.836 | 0.979 | 0.699 | x4∩x8 | 0.295 | 0.808 | 0.170 |
| x1∩x9 | 0.880 | 0.997 | 0.699 | x4∩x9 | 0.485 | 0.793 | 0.176 |
| x2∩x3 | 0.826 | 0.965 | 0.146 | x5∩x6 | 0.874 | 0.978 | 0.737 |
| x2∩x4 | 0.680 | 0.994 | 0.170 | x5∩x7 | 0.705 | 0.986 | 0.744 |
| x2∩x5 | 0.816 | 0.984 | 0.741 | x5∩x8 | 0.674 | 0.960 | 0.675 |
| x2∩x6 | 0.850 | 0.987 | 0.750 | x5∩x9 | 0.744 | 0.993 | 0.752 |
| x2∩x7 | 0.872 | 0.767 | 0.240 | x6∩x7 | 0.738 | 0.987 | 0.759 |
| x2∩x8 | 0.664 | 0.793 | 0.134 | x6∩x8 | 0.669 | 0.977 | 0.681 |
| x2∩x9 | 0.751 | 0.970 | 0.213 | x6∩x9 | 0.853 | 0.990 | 0.703 |
| x3∩x4 | 0.270 | 0.707 | 0.157 | x7∩x8 | 0.580 | 0.692 | 0.332 |
| x3∩x5 | 0.815 | 0.990 | 0.737 | x7∩x9 | 0.695 | 0.773 | 0.272 |
| x3∩x6 | 0.936 | 0.791 | 0.733 | x8∩x9 | 0.606 | 0.703 | 0.088 |
| [1] |
许涛. 旅游地学研究内核及其学科体系框架. 干旱区资源与环境, 2021, 35(1): 182-188.
[
|
| [2] |
罗浩, 冯润. 论旅游景区、旅游产品、旅游资源及若干相关概念的经济性质. 旅游学刊, 2019, 34(11): 116-123.
[
|
| [3] |
山海关景区被取消5A级资质河北公布整改措施. http://news.sohu.com/20151012/n423043381.shtml. 2015-10-12.
[Shanhaiguan scenic spot was cancelled 5A qualification Hebei announced rectification measures. http://news.sohu.com/20151012/n423043381.shtml. 2015-10-12.]
|
| [4] |
|
| [5] |
|
| [6] |
|
| [7] |
胡炜霞, 梁晓涛, 桑子俞. 山西省3A及以上旅游景区时空演化特征及原因分析. 干旱区资源与环境, 2020, 34(12): 187-194.
[
|
| [8] |
张广海, 颜文静. 我国旅游业地区比较优势的时空演化及影响因素分析. 资源开发与市场, 2020, 36(4): 427-433.
[
|
| [9] |
谢志华, 吴必虎. 中国资源型景区旅游空间结构研究. 地理科学, 2008, 28(6): 748-753.
[
|
| [10] |
潘竟虎, 李俊峰. 中国A级旅游景点空间分布特征与可达性. 自然资源学报, 2014, 29(1): 55-66.
[
|
| [11] |
丛丽, 于佳平, 王灵恩. 我国半资源消费型野生动物旅游景区时空演变特征及其驱动因素分析. 自然资源学报, 2020, 35(12): 2831-2847.
[
|
| [12] |
唐承财, 孙孟瑶, 万紫微. 京津冀城市群高等级景区分布特征及影响因素. 经济地理, 2019, 39(10): 204-213.
[
|
| [13] |
贾垚焱, 胡静, 刘大均, 等. 长江中游城市群A级旅游景区空间演化及影响机理. 经济地理, 2019, 39(1): 198-206.
[
|
| [14] |
吴春涛, 李隆杰, 何小禾, 等. 长江经济带旅游景区空间格局及演变. 资源科学, 2018, 40(6): 1196-1208.
[
|
| [15] |
王洪桥, 袁家冬, 孟祥君. 东北地区A级旅游景区空间分布特征及影响因素. 地理科学, 2017, 37(6): 895-903.
[
|
| [16] |
麻学锋, 杨雪. 大湘西高级别景区时空分布特征及影响因素的空间异质性. 自然资源学报, 2019, 34(9): 1902-1916.
[
|
| [17] |
李冬花, 张晓瑶, 陆林, 等. 黄河流域高级别旅游景区空间分布特征及影响因素. 经济地理, 2020, 40(5): 70-80.
[
|
| [18] |
刘敏, 郝炜, 张芙蓉. 山西省A级景区空间分布与影响因素. 经济地理, 2020, 35(12): 2831-2847.
[
|
| [19] |
刘亚晶, 罗静, 孙建伟, 等. 2018年湖北省旅游供需的空间结构特征分析: 以A级景区为例. 人文地理, 2021, 36(2): 175-183.
[
|
| [20] |
冯英杰, 吴小根, 张宏磊, 等. 江苏省水利风景区时空演变及其影响因素. 经济地理, 2018, 38(7): 217-224.
[
|
| [21] |
吴清, 李细归, 吴黎, 等. 湖南省A级旅游景区分布格局及空间相关性分析. 经济地理, 2017, 37(2): 193-200.
[
|
| [22] |
白子怡, 薛亮, 严艳. 基于GIS的旅游景区空间分布特征及影响因素定量分析: 以云南省A级旅游景区为例. 云南大学学报: 自然科学版, 2019, 41(5): 982-991.
[
|
| [23] |
林丹, 周向丽, 程叶青, 等. 海南岛乡村旅游资源点空间格局及影响因素. 海南师范大学学报: 自然科学版, 2020, 33(3): 307-317.
[
|
| [24] |
程海峰, 胡文海. 池州市A级旅游景区空间结构. 地理科学, 2014, 34(10): 1275-1280.
[
|
| [25] |
许志晖, 戴学军, 庄大昌, 等. 南京市旅游景区景点系统空间结构分形研究. 地理研究, 2007, 26(1): 132-140.
[
|
| [26] |
吴荣华, 张宏磊, 张捷, 等. 城市历史文化旅游地的小尺度空间结构及关联: 以南京夫子庙景区为例. 地理研究, 2014, 33(12): 2427-2436.
[
|
| [27] |
王洋, 方创琳, 盛长元. 扬州市住宅价格的空间分异与模式演变. 地理学报, 2013, 68(8): 1082-1096.
[
|
| [28] |
|
| [29] |
|
| [30] |
|
| [31] |
赵磊, 丁烨, 杨宏浩. 浙江省旅游景区空间分布差异化研究. 经济地理, 2013, 33(9): 177-183.
[
|
| [32] |
|
| [33] |
张军以, 苏维词, 张凤太. 基于PSR模型的三峡库区生态经济区土地生态安全评价. 中国环境科学, 2011, 31(6): 1039-1044.
[
|
| [34] |
赵雪雁, 王晓琪, 刘江华, 等. 基于不同尺度的中国优质医疗资源区域差异研究. 经济地理, 2020, 40(7): 22-31.
[
|
| [35] |
胡艳兴, 潘竟虎, 陈蜒, 等. 基于ESDA和GWR的中国地级及以上城市四化协调发展时空分异格局. 经济地理, 2015, 35(5): 45-54.
[
|
| [36] |
王劲峰, 徐成东. 地理探测器: 原理与展望. 地理学报, 2017, 72(1): 116-134.
[
|
| [37] |
方创琳, 毛其智, 倪鹏飞. 中国城市群科学选择与分级发展的争鸣及探索. 地理学报, 2015, 70(4): 515-527.
[
|
| [38] |
国务院关于调整城市规模划分标准的通知. http://www.gov.cn/zhengce/content/2014-11/20/content_9225.htm, 2014-11-20.
[Circular of The State Council on adjusting the standards for the classification of city sizes. http://www.gov.cn/zhengce/content/2014-11/20/content_9225.htm, 2014-11-20.]
|
| [39] |
陶全刚, 张洪岩, 程雄, 等. 基于县区单元的我国3A级以上旅游景区空间聚集性研究. 地理与地理信息科学, 2017, 33(3): 113-119.
[
|
| [40] |
黄园淅, 杨波. 从胡焕庸人口线看地理环境决定论. 云南师范大学学报: 哲学社会科学版, 2012, 44(1): 68-73.
[
|
| [41] |
刘宁, 宋秋月, 侯佳佳, 等. 中国旅游产业结构变迁及空间网络演进. 地理与地理信息科学, 2020, 36(5): 119-127.
[
|
| [42] |
吴媛媛, 宋玉祥. 中国旅游经济空间格局演变特征及其影响因素分析. 地理科学, 2018, 38(9): 1491-1498.
[
|
/
| 〈 |
|
〉 |