
基于生态系统服务价值的东北农牧交错区土地利用格局优化与评价
|
耿鑫(1997- ),男,安徽淮南人,博士研究生,研究方向为干旱区资源开发利用。E-mail: gengx.18b@igsnrr.ac.cn |
收稿日期: 2021-02-22
修回日期: 2021-07-30
网络出版日期: 2022-09-28
基金资助
中国科学院战略性先导科技专项(XDA23060405)
国家自然科学基金项目(41971232)
Land use pattern optimization and evaluation based on ESV of agro-pastoral ecotone in Northeast China
Received date: 2021-02-22
Revised date: 2021-07-30
Online published: 2022-09-28
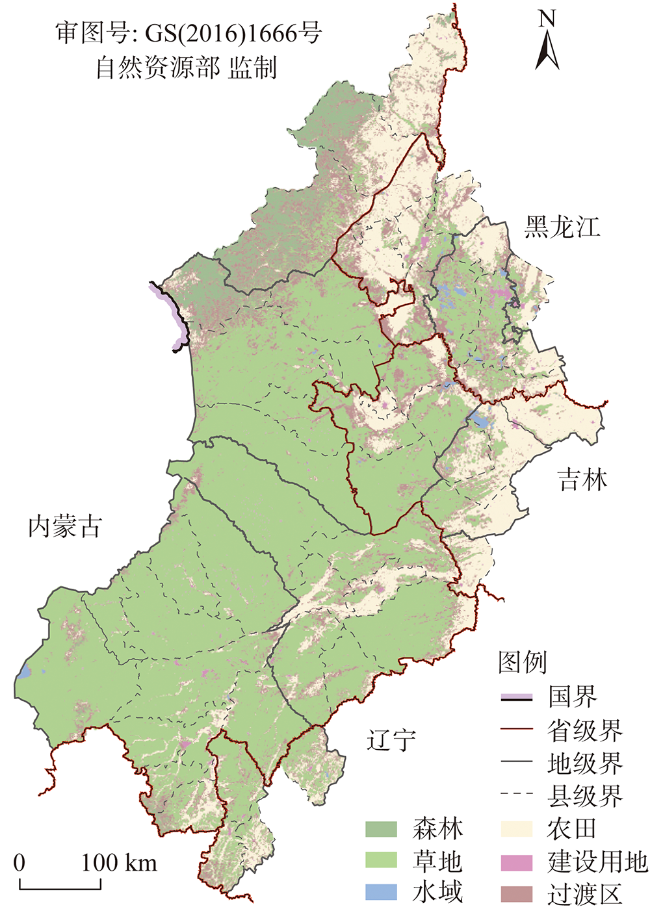
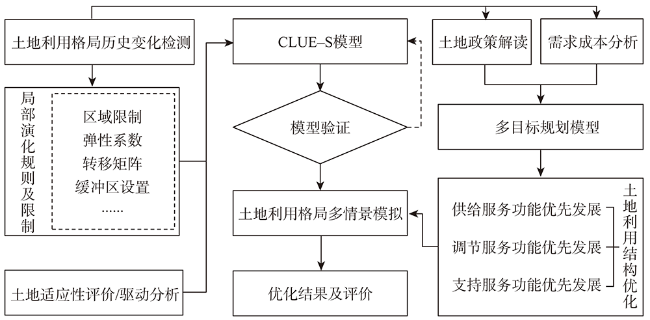
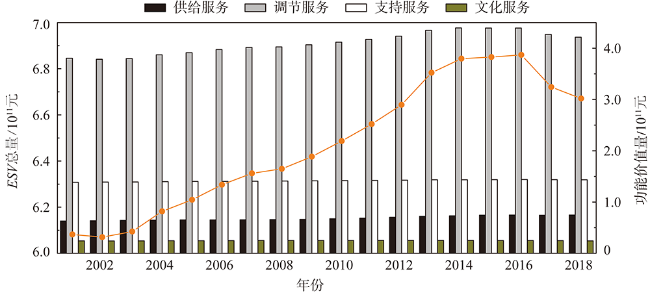
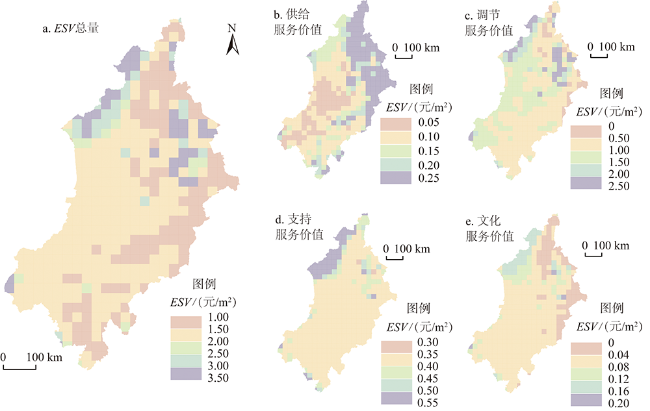
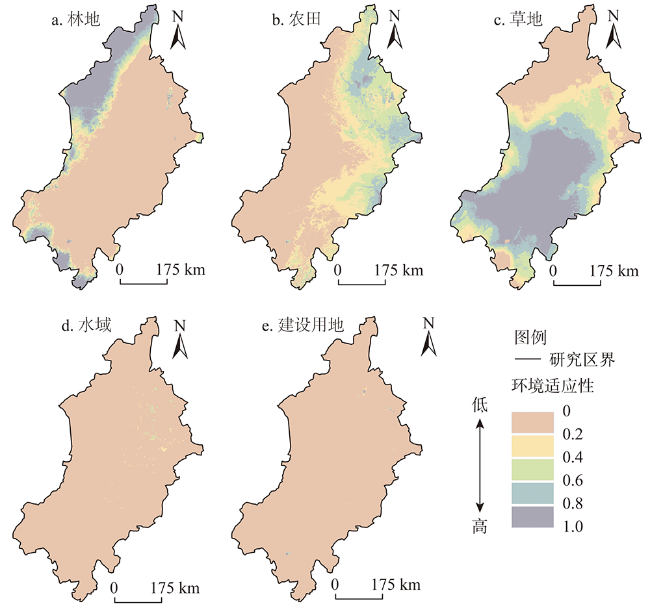
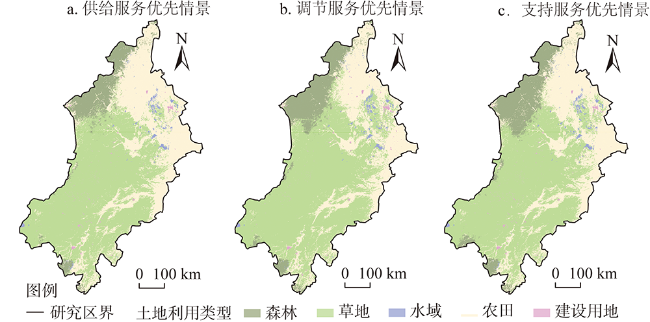
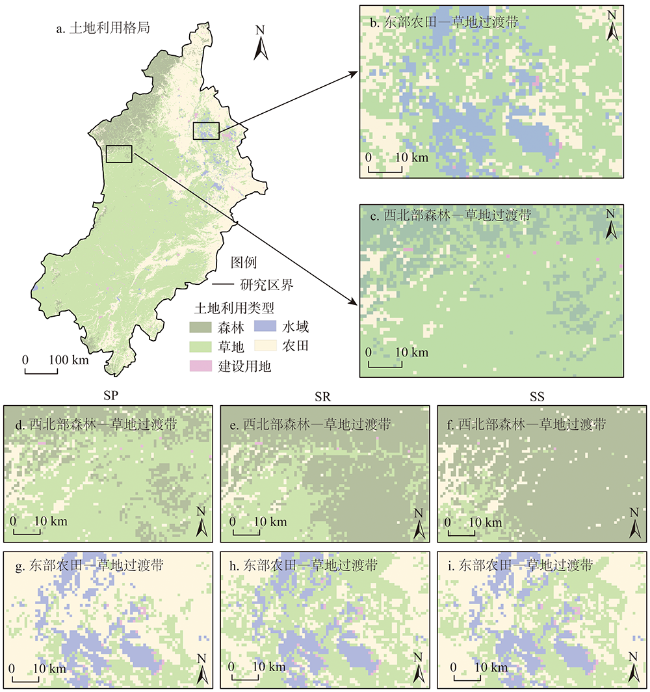
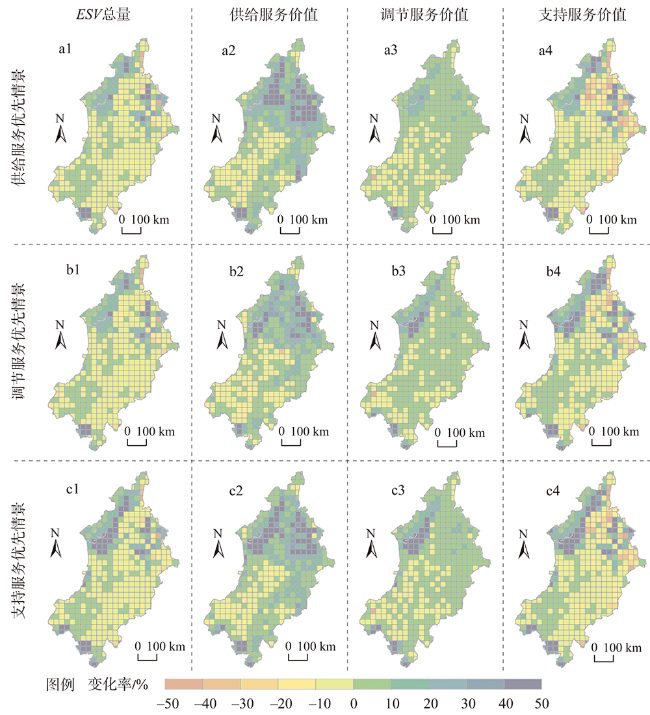
为完善土地规划评估指标、挖掘东北农牧交错区生态建设潜力,在明晰2001—2018年东北农牧交错区生态系统服务价值(ESV)时空特征的基础上,分别以供给服务、调节服务和支持服务三种生态功能为优先发展目标,结合CLUE-S模型提出了三种土地利用格局规划方案。结果显示:(1)2001—2018年研究区ESV总量增长9.69%,其中调节、支持和供给服务功能年均占比分别为67.25%、21.88%和6.74%;(2)三种规划方案对区域ESV提升明显,其中支持服务优先情景下ESV总量提升5.84%,高于供给服务(2.66%)和调节服务(5.19%)优先情景;(3)不同土地利用类型的环境适应性不同,研究区西北部、西南部和东部部分地区更适宜造林和退耕,ESV总量和支持服务价值的提升潜力较大,而北部和东南部地区更适宜开垦农田,供给和调节服务价值提升潜力较大。不同生态系统服务间的权衡与协同是保障区域生态与经济稳定可持续发展的关键。充分考虑政策与环境适应性等因素,对东北农牧交错区土地利用格局进行优化,将为当地规划提供理论基础和实践参考。
耿鑫 , 胡实 , 肖玉 , 王训明 . 基于生态系统服务价值的东北农牧交错区土地利用格局优化与评价[J]. 自然资源学报, 2022 , 37(7) : 1799 -1814 . DOI: 10.31497/zrzyxb.20220710
To improve the evaluation indicators in land planning and tap the potential of ecological construction in agro-pastoral ecotone of Northeast China, the spatiotemporal characteristics of ecosystem service value (ESV) in the region from 2001 to 2018 were interpreted, and three land use options (i.e., prioritized provisioning service, regulating service, and supporting service) were simulated using the multi-objective programming model and CLUE-S model. The results show that: (1) The total ESV increased by 9.69% from 2001 to 2018, with provisioning service, regulating service, and supporting service accounting for 67.25%, 21.88% and 6.74%, respectively. (2) The total ESV increased by 5.84% in the scenario of prioritized supporting service, which was higher than that of prioritized provisioning service (2.66%) and of prioritized regulating service (5.19%). (3) The environmental adaptability of different land use types is different, i.e., in northwestern, southwestern and eastern parts of the study area with more suitability for afforestation and conversion of farmland, the total ESV and supporting service have great potential to improve, while northern and southeastern parts are more suitable for farmland reclamation, which facilitates the improvements of prioritized provisioning service and regulating service. The synergy among different ecosystem services is important in ensuring the security and sustainable development of regional ecology and economy. Aiming to improve ESV with full consideration of policy and environmental adaptability, the land use optimization can provide theoretical basis and practical guidance for the land planning in agro-pastoral ecotone of Northeast China.
表1 中国陆地生态系统单位面积ESV当量表[13]Table 1 ESV unit area of Chinese terrestrial ecosystem[13] |
| 生态系统 分类 | 供给服务 | 调节服务 | 支持服务 | 文化服务 | ||||||||||
|---|---|---|---|---|---|---|---|---|---|---|---|---|---|---|
| 食物 生产 | 原料 生产 | 水资源 供给 | 气体 调节 | 气候 调节 | 净化 环境 | 水文 调节 | 土壤 保持 | 维持 水分 | 生物 多样性 | 美学 景观 | ||||
| 森林 | 0.16 | 0.31 | 0.17 | 1.06 | 3.06 | 0.94 | 2.22 | 1.30 | 0.10 | 1.18 | 0.52 | |||
| 草地 | 0.10 | 0.14 | 0.08 | 0.51 | 1.34 | 0.44 | 0.98 | 0.62 | 0.05 | 0.56 | 0.25 | |||
| 农田 | 0.85 | 0.40 | 0.02 | 0.67 | 0.36 | 0.10 | 0.27 | 1.03 | 0.12 | 0.13 | 0.06 | |||
| 水域 | 0.80 | 0.23 | 8.29 | 0.77 | 2.29 | 5.55 | 102.24 | 0.93 | 0.07 | 2.55 | 1.89 | |||
表2 土地面积调控范围Table 2 Range of land area regulation |
| 类型 | 设定标准 | 阈值/km2 | 政策参考及数据来源 | |
|---|---|---|---|---|
| 下限 | 森林 | 现有森林面积的90% | 27600 | 《全国土地利用总体规划纲要 (2006—2020)》 |
| 草地 | 现有草地面积的90% | 192000 | ||
| 农田 | 现有农田面积的95% | 96700 | ||
| 上限 | 森林 | 控制造林育林成本不超过地区GDP总量的0.5% 参考三北防护林40年总投资约1.1万亿元、实现保有林地面积3014.3万hm2的实践经验,估算造林育林的成本为9.1万元/(a·km2);研究区GDP总量约1万亿元 | 45500 | 《中国林业统计年鉴2018》 《中国统计年鉴2018》 |
| 定值 | 水域 | S型曲线拟合(DoseResp函数) | 3270 | 《中国水利统计年鉴(2001—2017)》 |
| 建设用地 | 城市人口(2400万)×人均占有面积(100 m²) | 2400 | 《城市用地分类与规划建设用地标准》 《中国统计年鉴(2001—2018)》 | |
表3 不同类型ESV理论边界Table 3 Theoretical boundaries of ESV of different types |
| 功能类型 | 边界 | 价值量/亿元 | 森林面积/km² | 草地面积/km² | 农田面积/km² |
|---|---|---|---|---|---|
| 供给服务 | U | 727.08 | 27600 | 192000 | 123475 |
| L | 648.69 | 27600 | 218775 | 96700 | |
| 调节服务 | U | 3462.51 | 45500 | 200875 | 96700 |
| L | 3086.97 | 27600 | 192000 | 123475 | |
| 支持服务 | U | 1506.11 | 45500 | 192000 | 105575 |
| L | 1430.26 | 27600 | 218775 | 96700 | |
| 文化服务 | U | 245.57 | 45500 | 200875 | 96700 |
| L | 215.00 | 27600 | 192000 | 123475 |
注:U和L分别表示上限和下限。 |
表4 不同土地利用类型的多要素Logistic回归及检验(仅保留p<0.01的因子,因子系数扩大1000倍显示)Table 4 Multi-element Logistic regression and testing of different land-use types (only factors with p <0.01 are retained, factor coefficient expanded by 1000 times) |
| 森林 | 草地 | 水域 | 耕地 | 建设用地 | |
|---|---|---|---|---|---|
| 常数 | -33.43 | 3.67 | 16.56 | -3.52 | -0.61 |
| 人口密度 | -15.39 | -2.04 | -5.53 | 3.90 | 1.67 |
| GDP | -3.05 | -0.19 | 0.56 | -0.34 | 0.32 |
| 取水距离 | — | 0.02 | — | -0.01 | 0.01 |
| DEM | 3.76 | 1.03 | -5.67 | -2.77 | -1.38 |
| 坡度 | 155.94 | -51.88 | -1739.26 | -387.19 | -317.31 |
| 降水 | 60.63 | -20.08 | -22.10 | 10.23 | -7.17 |
| 气温 | -391.18 | 709.51 | -839.58 | 22.94 | — |
| 土壤粒径 | — | 20.55 | -121.49 | -30.03 | -22.34 |
| AUC | 0.98 | 0.92 | 0.95 | 0.90 | 0.76 |
表5 模拟与观测结果的对比Table 5 Comparison of simulation and observation results |
| Kappa=0.75 | 模拟分类(栅格计数) | ||||||
|---|---|---|---|---|---|---|---|
| 森林 | 草地 | 农田 | 水域 | 建设用地 | 生产者精度/% | ||
| 实际分类 (栅格计数) | 森林 | 85595 | 16472 | 7048 | 0 | 0 | 78.44 |
| 草地 | 18295 | 763161 | 68728 | 0 | 0 | 89.76 | |
| 农田 | 5225 | 70551 | 323626 | 0 | 0 | 81.03 | |
| 水域 | 0 | 0 | 0 | 13943 | 0 | 100.00 | |
| 建设用地 | 0 | 0 | 0 | 0 | 12048 | 100.00 | |
| 用户精度/% | 78.44 | 89.76 | 81.03 | 100.00 | 100.00 | — | |
表6 主要土地利用变化区的模拟与观测结果对比Table 6 Comparison of simulation and observation results of change area |
| Kappa=0.38 | 模拟分类(栅格计数) | ||||
|---|---|---|---|---|---|
| 森林 | 草地 | 农田 | 生产者精度/% | ||
| 实际分类 (栅格计数) | 森林 | 31351 | 12053 | 4753 | 65.10 |
| 草地 | 6921 | 21083 | 11775 | 53.00 | |
| 农田 | 2252 | 42748 | 71775 | 61.46 | |
| 用户精度/% | 77.37 | 27.78 | 81.28 | — | |
表7 三种情景下土地利用结构配置Table 7 Land use structural configuration under three scenarios (km2) |
| 情景设置 | 权重向量 | 森林面积 | 草地面积 | 农田面积 | 水域面积 | 建设用地面积 |
|---|---|---|---|---|---|---|
| 2018年现状 | 27627 | 213417 | 101815 | 2844 | 3041 | |
| 供给服务优先 | [1; 0.95; 0.95] | 31260 | 193633 | 118182 | 3270 | 2400 |
| 调节服务优先 | [0.95; 1; 0.95] | 38720 | 206207 | 98149 | 3270 | 2400 |
| 支持服务优先 | [0.95; 0.95; 1] | 42849 | 192007 | 108218 | 3270 | 2400 |
| [1] |
|
| [2] |
|
| [3] |
|
| [4] |
|
| [5] |
|
| [6] |
|
| [7] |
|
| [8] |
|
| [9] |
|
| [10] |
|
| [11] |
|
| [12] |
谢高地, 甄霖, 鲁春霞, 等. 一个基于专家知识的生态系统服务价值化方法. 自然资源学报, 2008, 23(5): 911-919.
[
|
| [13] |
谢高地, 张彩霞, 张昌顺, 等. 中国生态系统服务的价值. 资源科学, 2015, 37(9): 1740-1746.
[
|
| [14] |
贾建辉, 陈建耀, 龙晓君, 等. 水电开发对河流生态系统服务的效应评估与时空变化特征分析: 以武江干流为例. 自然资源学报, 2020, 35(9): 2163-2176.
[
|
| [15] |
|
| [16] |
|
| [17] |
|
| [18] |
杨洁, 朱云峰, 李昭阳, 等. 东北农牧交错带土地生态环境安全指标体系的建立于综合评价: 以镇赉县为例. 干旱区资源与环境, 2006, 20(1): 119-124.
[
|
| [19] |
徐磊, 张峭. 中国粮食主产区粮食生产风险度量与分析. 经济纵横, 2011, (21): 110-112.
[
|
| [20] |
|
| [21] |
郑晓, 朱教君. 基于多源遥感影像的三北地区片状防护林面积估算. 应用生态学报, 2013, 24(8): 2257-2264.
[
|
| [22] |
|
| [23] |
王雷, 龙永清, 杨勤科. 重采样方法对DEM数据质量的影响. 水土保持通报, 2016, 36(4): 72-77.
[
|
| [24] |
侯孟阳, 姚顺波, 邓元杰, 等. 格网尺度下延安市生态服务价值时空演变格局与分异特征: 基于退耕还林工程的实施背景. 自然资源学报, 2019, 34(3): 539-552.
[
|
| [25] |
李建春, 袁文华. 基于GIS 格网模型的银川市土地生态安全评价研究. 自然资源学报, 2017, 32(6): 988-1001.
[
|
| [26] |
许小亮, 李鑫, 肖长江, 等. 基于CLUE-S模型的不同情景下区域土地利用布局优化. 生态学报, 2016, 36(17): 5401-5410.
[
|
| [27] |
|
| [28] |
|
| [29] |
张沐锋, 刘万侠, 王健恩, 等. 基于Clue-S模型的石马河流域东莞段生态系统服务价值变化情景模拟. 水土保持通报, 2021, 41(1): 152-160.
[
|
| [30] |
郝晓敬, 张红, 徐小明, 等. 晋北地区土地利用覆被格局的演变与模拟. 生态学报, 2020, 40(1): 257-265.
[
|
| [31] |
|
| [32] |
王金叶, 王艺林, 金博文. 干旱半干旱区山地森林的水分调节功能. 林业科学, 2001, 37(5): 120-125.
[
|
| [33] |
张娟, 李剑萍, 王誊陶, 等. 西北干旱地区气候变化及其对草地生产潜力的影响. 生态科学, 2020, 39(3): 182-192.
[
|
| [34] |
|
| [35] |
沈颂东, 陈鑫强, 韩明友. 东北振兴的产业重构与空间布局: 基于振兴目标、资源优势和物流成本的综合分析. 经济纵横, 2020, (6): 102-108.
[
|
| [36] |
|
/
| 〈 |
|
〉 |